AstroSat and Chandra view of the high soft state of 4U 1630–47 (4U 1630–472): evidence of the disk wind and a rapidly spinning black hole
Abstract
We present the X-ray spectral and timing analysis of the transient black hole X-ray binary 4U 1630–47, observed with the AstroSat, Chandra and MAXI space missions during its soft X-ray outburst in 2016. The outburst, from the rising phase until the peak, is neither detected in hard X-rays (15-50 keV) by the Swift/BAT nor in radio. Such non-detection along with the source behavior in the hardness-intensity and color-color diagrams obtained using MAXI data confirm that both Chandra and AstroSat observations were performed during the high soft spectral state. The High Energy Grating (HEG) spectrum from the Chandra high-energy transmission grating spectrometer (HETGS) shows two strong, moderately blueshifted absorption lines at 6.705 keV and 6.974 keV, which are produced by Fe XXV and Fe XXVI in a low-velocity ionized disk wind. The corresponding outflow velocity is determined to be 36656 km/s. Separate spectral fits of Chandra/HEG, AstroSat/SXT+LAXPC and Chandra/HEG+AstroSat/SXT+LAXPC data show that the broadband continuum can be well described with a relativistic disk-blackbody model, with the disk flux fraction of . Based on the best-fit continuum spectral modeling of Chandra, AstroSat and Chandra+AstroSat joint spectra and using the Markov Chain Monte Carlo simulations, we constrain the spectral hardening factor at 1.56 and the dimensionless black hole spin parameter at 0.92 0.04 within the 99.7% confidence interval. Our conclusion of a rapidly-spinning black hole in 4U 1630–47 using the continuum spectrum method is in agreement with a previous finding applying the reflection spectral fitting method.
1 Introduction
A transient black hole X-ray binary (BHXB) traces several X-ray spectral states during its outburst. Among these states, physical processes associated with the high-intensity, soft, thermal emission-dominated state or the high soft (HS) state are possibly the best understood, due to the relatively simple, non-degenerate spectral modeling. The HS state emission is dominated by a blackbody emission from a geometrically thin and optically thick accretion disk, with the ratio of the disk flux to the total flux greater than 70%80% (Remillard & McClintock, 2006). In particular, the Shakura-Sunyaev prescription (Shakura & Sunyaev, 1973) predicts that the emitting disk may extend down to the innermost stable circular orbit (ISCO) around the black hole. In addition to the disk-blackbody emission, a low luminosity, non-thermal, hard power-law tail with a variable photon index 1.75 (may reach ; Titarchuk & Shaposhnikov, 2010; Motta, Belloni & Homan, 2009; Remillard & McClintock, 2006) has also been observed in the HS state. Such a tail is often explained by the presence of ‘patchy,’ magnetized, active coronal blobs, which are largely independent of underlying accretion and Comptonization details around the thin disk (Haardt, Maraschi & Ghisellini, 1994).
Using a large number of HS state spectra obtained from different outbursts in X-ray binaries using different satellites, it has been found that the observed disk luminosity and the observed disk temperature follow an L T4 relationship, and the apparent inner disk radius remains constant in spite of a variable disk luminosity (Steiner et al., 2010; Muno et al., 1999). Therefore, it is reasonable to assume that such a stable inner disk radius is the ISCO radius (). For the Kerr spacetime, and assuming a corotating disk, the black hole dimensionless spin parameter () can be uniquely estimated from a measured value of , where and are the black hole mass and total angular momentum respectively (e.g., McClintock et al., 2006). Therefore, fitting of the thermal component of the continuum spectrum has been used to estimate , and hence , of several accreting black holes (e.g., Shafee, Narayan & McClintock, 2008; Fragos & McClintock, 2015). The continuum spectrum fitting method is often used when the source inclination angle (), distance () and are independently known. The method is particularly promising, if almost the entire X-ray emission is from the disk, which significantly reduces systematic uncertainties. Note that , and hence , can also be estimated by an alternative method, viz., the fitting of the energy and shape of a broad relativistic spectral line. Such a fluorescent line is believed to originate from the reflection of hard X-rays off the inner disk, and the line is shaped by the Doppler effect, special relativistic beaming, gravitational redshift, etc. (e.g., Miller, 2007).
The black hole HS state is also ideal for observing signatures of wind from the accretion disk (e.g., Neilsen & Lee, 2009). Such features are usually narrow, blueshifted spectral lines which can be observed with Chandra gratings. These lines can provide information about the wind velocity, ionization state and can generally be useful for understanding the matter inflow-outflow mechanism.
In this paper, we focus on the transient BHXB 4U 1630–47 (Jones et al., 1976; Parmar et al., 1995), which goes into outbursts with a typical interval of 600–690 days (Abe et al., 2005; Tomsick et al., 2014). No dynamical mass measurement was possible for 4U 1630–47, because the optical counterpart has not been identified due to the high extinction in the direction of the source near the Galactic plane. Therefore, the identification of the source as a black hole (Parmar et al., 1986) was based on the similarity of its spectral and timing properties with those of BHXBs with measured black-hole masses (e.g., Barret et al., 1996; Abe et al., 2005). Nevertheless, using the correlation between photon index, low-frequency quasi-periodic oscillations (QPOs) and mass accretion rate, Seifina et al. (2014) estimated the compact object mass and inner disk inclination angle of 10 0.1 M⊙ and 70∘ respectively. Note that the observations of flux dips, but a lack of full eclipses, imply a high (but not edge-on) inclination angle (; King et al., 2014; Tomsick et al., 1998; Kuulkers et al., 1998) for 4U 1630–47, which is in agreement with the finding of Seifina et al. (2014).
While the distance of 4U 1630–47 is not known with certainty, the presence of heavy absorption (hydrogen column density cm-2; Tomsick et al., 1998), faint optical counterpart ( 20 magnitude), probably due to the high extinction in the Galactic plane (monochromatic extinction at 5495 Å is 9 at the Galactic latitude of 5∘; Sale et al., 2014) and reddening (Seifina et al., 2014) support a large distance ( 8 kpc) of the source. Moreover, in the direction of 4U 1630–47, the presence of a Giant Molecular Cloud at a measured distance of 11 kpc (Augusteijn et al., 2001) behind the source is consistent with the assumed distance to the source and provides an upper limit to the distance of the source.
The black hole spin value for 4U 1630–47, to the best of our knowledge, has so far not been estimated using the continuum spectrum method mentioned above. However, King et al. (2014) reported, for the first time from this source, a broad relativistic spectral iron emission line using NuSTAR data. During this NuSTAR observation, 4U 1630–47 was in an intermediate state, showing the signature of an accretion disk, a hard Comptonized tail and reflection features from the inner disk. By fitting the reflection spectrum, King et al. (2014) estimated ( statistical errors), and .
Suzaku spectra of 4U 1630–47 showed H-like and He-like Fe absorption lines at 6.96 keV and 6.7 keV (Kubota et al., 2007). These lines were thought to originate from the strongly ionized material in a disk wind. However, using the same Suzaku spectra, Różańska et al. (2014) proposed the accretion disk atmosphere as an alternative origin of the absorption lines. A signature of thermally/radiatively driven disk wind with its ionization having a positive correlation with the source luminosity was noted by Díaz Trigo et al. (2014) using XMM-Newton spectra of 4U 1630–47 during the 2012-2013 outburst. They found that the absorption features disappeared and an emission line appeared at very high luminosity, which implies a significant change in the degree of ionization of wind with increasing luminosity. Later, using a simpler model for the same XMM-Newton spectra, Wang & Méndez (2016) showed the presence of a variable element abundance and a strongly-ionized absorber near the black hole. Using Chandra/HETGS grating spectra of 4U 1630–47, Neilsen et al. (2013, 2014) found robust and strong absorption line caused by the outflowing wind launched during the outburst phase of 4U 1630–47. Neilsen et al. (2014) showed that the detection of ultra-relativistic wind from 4U 1630–47 (Díaz Trigo et al., 2013) is ambiguous and the radio emission from this system may be unrelated to the X-ray emission lines. Miller et al. (2015) found a disk wind that requires magnetic launching from two absorption zones at different radii having velocities of and .
With this background, here we study the 2016 X-ray outburst of 4U 1630–47 in its high soft state. We report the results from the first AstroSat observation of this source. Besides, we analyze Chandra data of the same outburst. These provide us with a rare opportunity to fit high spectral resolution grating spectra and the keV broadband spectra in the same state of the same outburst. Using this Chandra grating and AstroSat broadband spectra, and with the continuum spectrum method, we confirm the previously inferred high of the black hole. We also report strong and blueshifted Fe XXV and Fe XXVI absorption lines in the Chandra grating spectra, implying a low velocity, ionized disk wind in 4U 1630–47 during our observation.
2 Observations and data reduction
2.1 AstroSat data reduction
AstroSat continuously observed 4U 1630–47 between 01 October 2016 09:16:32 and 02 October 2016 16:43:39 covering 15 consecutive satellite orbits. The total observation duration is 94.6 ks. For the broadband spectroscopic purpose, we use simultaneous observations from the Soft X-ray focusing Telescope (SXT) and Large Area X-ray Proportional Counter (LAXPC) instruments.
SXT is a focusing telescope with cooled CCD camera that can perform X-ray imaging and medium resolution spectroscopy in the 0.3-8.0 keV energy range (Singh et al., 2016, 2017). Level-1 Photon Counting (PC) mode data along with the SXT calibration database is processed through a pipeline software (AS1SXTLevel2-1.4a; release date: 06 December 2017) to produce level-2 event files, and then a good time interval (GTI) correcter and SXT event merger script111http://www.tifr.res.in/~astrosat_sxt/page1_data_analysis.php are used to create a merged event file using all the clean events from different orbits with the corrected exposure time. We use XSELECT V2.4e in HEASOFT 6.24 to extract lightcurves and spectra using source regions between 1 and 13 arcmin. An off-axis auxiliary response file (ARF) appropriate for the source location on the CCD is generated from the provided on-axis ARF using sxtmkarf tool\@footnotemark. A blank sky SXT spectrum, provided by the SXT team\@footnotemark is used as the background spectrum. As suggested, while fitting the SXT spectrum we use the gain command that modifies the response file gain linearly. The slope of the linear fit is fixed to 1, and the offset is free to vary.
LAXPC consists of three large area (6000 cm2), almost identical but independent, X-ray proportional counters (LAXPC10, LAXPC20 and LAXPC30) having absolute time resolution of 10 s in the energy range 3.0-80.0 keV (Yadav et al., 2016a, b; Antia et al., 2017; Agrawal et al., 2017). Owing to the high time resolution and high efficiency in hard X-rays, the LAXPC demonstrates remarkable capabilities in spectro-timing analysis of X-ray binaries like GRS 1915+105 (Yadav et al., 2016a), Cyg X-1 (Misra et al., 2017), 4U 1728-34 (Verdhan Chauhan et al., 2017) and Cyg X-3 (Pahari et al., 2018, 2017). Event mode data from LAXPC were acquired in 1024 channels and analyzed using the LAXPC software222http://www.tifr.res.in/~astrosat_laxpc/LaxpcSoft.html. Details of the response matrix computation and the generation of background spectra based on sky background model can be found in Antia et al. (2017). Due to the gas leakage issue in LAXPC30, we do not include its spectra for further analysis. Since the energy spectra during the soft state are dominated by the LAXPC background above 23 keV, we consider the energy range of 4-23 keV for spectral analysis.
2.2 Chandra data reduction
During the peak of the outburst, Chandra observed 4U 1630–47 starting from 21 October 2016 01:24:58 (Observation ID: 19904; PI: Sudip Bhattacharyya) with an effective exposure of 30.93 ks. The observation was performed using the high-energy transmission grating spectrometer (HETGS) instrument which disperses the incident X-ray photons onto the Advanced CCD Imaging Spectrometer spectroscopic array (ACIS-S). To avoid the photon pile-up issue in the CCD, caused by the high soft unabsorbed X-ray flux of 300 mCrab in 0.2-10 keV during the present observation of 4U 1630–47, the ACIS-S array was operated in continuous clocking (CC-GRADED) data mode which activates fast frame transfer and reduces the frame accumulation time from 3.2 s to 2.85 ms. In our analysis, we determine the location of the zeroth order and owing to the highest number of events, we extract and use the first order grating spectra only.
Data reduction was accomplished using the Chandra Interactive Analysis of Observation software (CIAO version 4.10; Fruscione et al. (2006)). The Calibration Database version 4.7.8 is used. Time-averaged first-order High Energy Grating and Medium Energy Grating (MEG) spectra are extracted from the Level-2 event file. Redistribution matrix files (rmfs) and ancillary response files (arfs) are generated using the tool mkgrmf and mkgarf respectively. To obtain a reasonable number of energy spectral bins for the continuum spectral modeling, we group every eight spectral channels into one. All spectral analyses were conducted using XSpec version 12.10.0c. All errors quoted in this paper are 1 errors, unless mentioned otherwise.
The HEG effective area below 1 keV is very low due to soft X-ray absorption in its polyimide structure and due to truncation of the dispersion by the CCD array (Canizares et al., 2005). During the Chandra CC mode observations of bright and absorbed sources, a diffraction scattering halo is observed which significantly dominates the continuum spectra below 2 keV333http://cxc.harvard.edu/cal/Acis/Cal_prods/ccmode/ccmode_final_doc02.pdf and acts as a background for the source spectrum. Therefore, considering best HEG spectral calibrations during the CC mode observation, we use the energy range of 2.0-8.0 keV for spectral analysis.
3 Timing analysis and spectral state determination
3.1 MAXI ans Swift/BAT view of the outburst
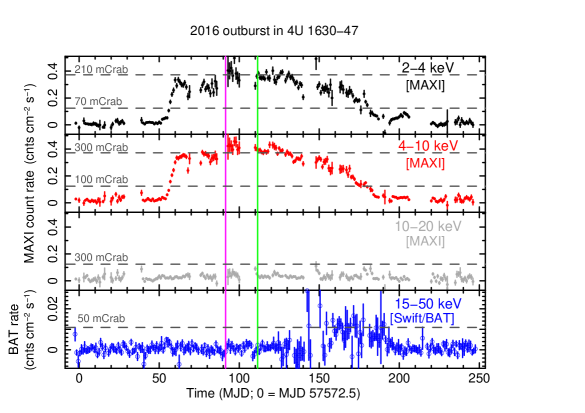
To understand the nature of the 2016 X-ray outburst from 4U 1630–47, we analyze MAXI one-day averaged lightcurves in different energy ranges, as shown in Figure 1. The top three panels show the 2–4 keV, 4–10 keV and 10–20 keV lightcurves covering the entire outburst which lasted for 150 days, and is significantly visible only in 2-4 keV (200 mCrab at the peak) and 4-10 keV ( 300 mCrab at the peak) energy ranges but not visible in the 10-20 keV energy range during the outburst duration. Therefore, the hard X-ray flux is not high enough to be detected with MAXI. To confirm and check the hard X-ray behavior further, we plot the 15-50 keV 1-day averaged Swift/BAT (Krimm et al., 2013) lightcurve of 4U 1630–47 during the same outburst. The source is not detected with the Swift/BAT during first 90 days of the outburst although an increase in the BAT count rate is observed during the decay phase of the outburst. Therefore, the non-detection of 4U 1630–47 in hard X-rays at the beginning of the outburst implies that the source went into a soft X-ray outburst. The times of observations from Chandra and AstroSat are shown by vertical lines in Figure 1. We may note that, although there is a gap of 20 days, both observations were taken during the spectral state when hard X-rays are not detected with Swift/BAT.
3.2 HID and CCD analysis
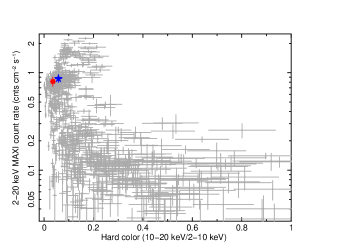
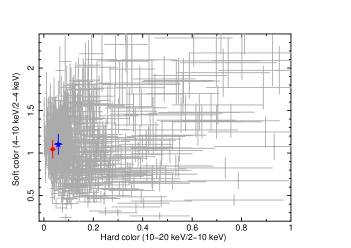
To show both of our observations belong to the canonical soft state and not the intermediate state, we plot hardness-intensity diagram (HID) and color color diagram (CCD) which are shown in the left and right panels of Figure 2 respectively. The hard color is defined as the ratio of background-subtracted count rate between 10–20 keV and 2–10 keV, while the soft color is defined as the ratio of background-subtracted count rate between 4–10 keV and 2–4 keV. To plot HID and CCD, we use one-day averaged MAXI data (Matsuoka et al., 2009) of the last three major outbursts from 4U 1630–47 in 2016, 2015 and 2012. MAXI hard and soft colors during the current Chandra and AstroSat observations are shown by a blue star and a red square respectively. From both HID and CCD, we may note that the hard color and soft color are not significantly different during Chandra and AstroSat observations. The similarities in the CCD and HID implies, although these observations are separated by 20 days, the spectral states are same. If we compare the HID of 4U 1630–47 from MAXI with that from RXTE as presented by Remillard & McClintock (2006), we find that the source spent most of the time in the canonical high soft state during outbursts (close to the lowest hard color or the leftmost section of the ‘q’ diagram), and not in the intermediate state (horizontal tracks of the ‘q’ diagram). Therefore, both our Chandra and AstroSat observations were performed during the canonical high soft state.
3.3 AstroSat observations
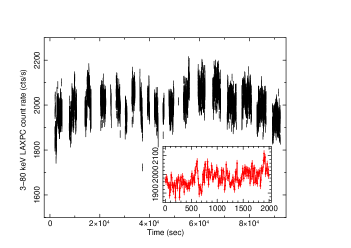
The AstroSat/LAXPC background-subtracted lightcurves combining three LAXPC units in the 3–80 keV light curve is shown in the left panel of Figure 3, while the 0.3–8 keV AstroSat/SXT light curve is shown in the right panel. Time bin size of both lightcurves is 10 s. No strong variation in count rate is observed. To check for the presence of any quasi-periodic oscillations (QPOs) in the light curve, we plot power density spectra (PDS) in Figure 4. PDS are extracted using LAXPC data in the energy ranges 3–6 keV and 6–10 keV. PDS are deadtime-corrected, Poisson-noise subtracted and are also corrected for background. PDS are dominated by a red noise component, and no significant power is observed above Hz at the significance level of 2. The total rms power integrated over Hz is less than 3% in 3–80 keV. These PDS properties are similar to the characteristics of the canonical high soft state (e.g., Remillard & McClintock, 2006).
3.4 Radio observations
4U 1630–47 was also observed in radio wavelength using Australian Telescope Compact Array (ATCA) on 28 September and 21 October 2016 which was simultaneous with the Chandra observation. Both observations were taken at 5.5 GHz and 9 GHz. At these frequencies, no source at the position of 4U 1630–47 was detected at the 3 rms noise level of 17 Jy and 16 Jy respectively on 21 October 2016. At the similar rms level, no source was detected on 28 September 2016. The radio non-detection during our observation is in agreement with the high soft spectral state of the source (Remillard & McClintock, 2006).
4 Spectral analysis and results
As described in Section 3, using MAXI, Swift/BAT and AstroSat data, and from light curves, HID, CCD and PDS, we conclude that both Chandra and AstroSat observations were performed in the high soft state. Therefore, it is meaningful to do combined Chandra and AstroSat spectral analysis. But, to be cautious, first we carry out Chandra grating spectral analysis and AstroSat/SXT+LAXPC joint spectral analysis separately.
4.1 Chandra grating spectral analysis
To understand characteristics of the Chandra/HETGS spectra, we fit the binned, first-order high energy gratings (HEG) spectrum with a thermal disk blackbody model along with the line-of-sight absorption model phabs in XSpec. The abundance is set to aspl from Asplund et al. (2009). Due to calibration issues, we do not use spectra from the medium energy gratings. Motivated by the previous work by King et al. (2014), which demonstrated the presence of a fast-spinning black hole, we use a multi-temperature, relativistic, disk blackbody model kerrbb for a thin, steady state, general relativistic accretion disk around a Kerr black hole (Li et al., 2005). This model fits the broadband continuum well. The residual of the fitting shows two strong absorption features. Due to symmetric shapes of the absorption profiles, we use a Gaussian absorption model to account for the two strong absorption lines at 6.7 keV and 6.97 keV. In our XSpec model phabs*(kerrbb+gabs+gabs), we fix the inclination at , black hole mass at and the distance at kpc, based on our discussion in Section 1. The torque at the inner disk boundary is assumed to be zero. The effect of limb-darkening and self-irradiation are also included. The HEG spectrum can be well fitted by the best-fit model (/dof ). Best-fit spectral parameters are given in Table 1, and the fitted spectra along with residuals are shown in the top left panel of Figure 6. However, to determine the nature and characteristics of absorption lines, we use the original unbinned spectrum to retain the original spectral resolution. The left panel of Figure 5 shows a zoomed portion of the unbinned, continuum-fitted spectra between 5 and 8 keV, where two absorption features at 6.7 keV and 6.97 keV are observed from the residual in the bottom panel. These line energies correspond to Fe XXV and Fe XXVI absorption lines at the rest energy of 6.697 keV and 6.966 keV respectively (Bianchi et al., 2005). Best-fit Fe XXV and Fe XXVI absorption line energies are found to be 6.705 keV and 6.974 keV, which are blueshifted from their rest frame energies by an amount which corresponds to an outflow velocity of 0.0012c. The blueshift is measured with 3 significance, and 1, 2 and 3 contours are shown in the right panel of Figure 5 along with the rest frame energies marked by a vertical and a horizontal line. From the shift in line energies, we estimate the wind velocity is 366 56 km/s. Significances are calculated based on Markov Chain Monte Carlo (MCMC) simulations of fitted parameters, which are described later. Best-fit black hole spin parameter and spectral hardening factor are 0.928 and 1.56 respectively. The spectral hardening factor, defined as a multiplicative factor to relate the effective temperature and the color/observed temperature of the accretion disk (Shimura & Takahara, 1995), is low possibly due to the soft, thermal nature of the spectra (Salvesen et al., 2013).
4.2 AstroSat spectral analysis
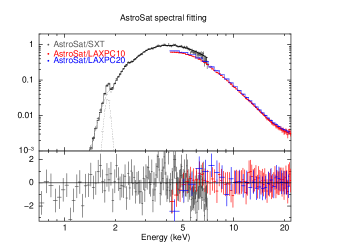
To check the Chandra spectral fitting consistency and to examine the hard X-ray behavior above 8 keV, we jointly fit the simultaneous AstroSat/SXT and AstroSat/LAXPC spectra in the energy range of keV. By fitting with the above mentioned continuum model, we find a significant residual above 16 keV and the fit is unacceptable (/dof = 624/214). To account this, we use a convolving Comptonization model simpl in XSpec. simpl is an empirical but self-consistent model of Comptonization, in which a fraction of the thermal photons from a thin disk works as an input seed spectrum (Steiner et al., 2009). With this modification, the spectrum is fitted well with the /dof = 209/212 (0.99). AstroSat/SXT and AstroSat/LAXPC spectra are not sensitive enough to model two absorption features similar to that shown by the Chandra/HEG spectrum. Therefore, we fix absorption line parameters to that from Chandra/HEG fitting. Best fit spectra along with the residual is shown in the top right panel of Figure 6, while the best-fit parameter values are given in Table 1. Since spectral hardening factor is not constrained, we fix it to 1.57 (see Section 4.1). Best-fit black hole spin parameter is found to be 0.913 (3 errors), which is close to that estimated from Chandra/HEG spectral fitting. From Table 1, we may note that kerrbb best-fit parameters for AstroSat and Chandra data are close to each other. A direct implication of such similarity in spectral parameters is that spectral state do not evolve between the AstroSat and Chandra observation periods. This motivates us to perform Chandra and AstroSat joint spectral analysis.
4.3 Chandra + AstroSat joint spectral analysis
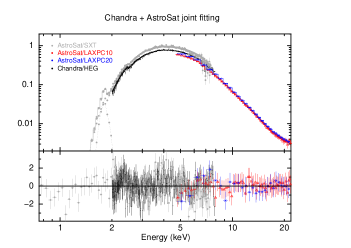
We perform Chandra/HEG and AstroSat/SXT+LAXPC joint spectral analysis to check if spectral parameters from Chandra and AstroSat individual spectral modelling match with Chandra+AstroSat joint fitting. We use the continuum model similar to that used for SXT+LAXPC joint spectral analysis discussed above (see Section 4.2). Absorption line parameters for the SXT spectrum are tied to that with the HEG. Best fit spectra (/dof = 507/477) along with the residual are shown in the bottom left panel of Figure 6, while best-fit parameter values are given in Table 1. The unfolded best-fit model spectra excluding the absorption is shown in the bottom right panel of Figure 6. Best-fit black hole spin parameter and spectral hardening factor with 3 errors are 0.924 and 1.56 respectively. All best-fit parameters are found similar to those estimated from separate AstroSat and Chandra spectral analyses.


| model | parameters | Chandra | AstroSat | Chandra+AstroSat |
| HEG | SXT+LAXPC | SXT+HEG+LAXPC | ||
| constant | – | SXT 1(fixed) | Chandra 1(fixed) | |
| LAXPC10 0.95 | LAXPC10 0.92 | |||
| LAXPC20 1.01 | LAXPC20 0.96 | |||
| SXT 1.13 | ||||
| phabs | NH (1022 cm-2) | 11.8 | 11.2 | 11.5 |
| kerrbb | (1018 gm/s) | 1.49 | 2.17 | 1.51 |
| (3) | 0.928 | 0.913 | 0.924 | |
| 1.57 | 1.57(f) | 1.56 | ||
| simpl | – | 2.79 | 2.84 | |
| Fsc (%) | – | 3.83 | 3.33 | |
| gabs | Egabs1 (keV) | 6.705 | – | 6.708 |
| (eV) | 12.8 | – | 11.3 | |
| 0.76 | – | 0.72 | ||
| gabs | Egabs2 (keV) | 6.974 | – | 6.975 |
| (eV) | 19.6 | – | 18.1 | |
| 1.15 | – | 1.49 | ||
| F0.2-2 | (10-8 ergs s-1 cm-2) | 0.81 | 1.04 | 1.05 |
| F2-10 | (10-8 ergs s-1 cm-2) | 0.92 | 1.45 | 1.33 |
| F10-20 | (10-8 ergs s-1 cm-2) | – | 0.15 | 0.16 |
| F20-100 | (10-8 ergs s-1 cm-2) | – | 0.02 | 0.03 |
| /dof | 250/252 (0.99) | 222/219 (1.01) | 507/477 (1.06) |
4.4 MCMC simulations and results
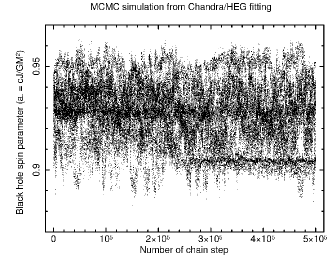
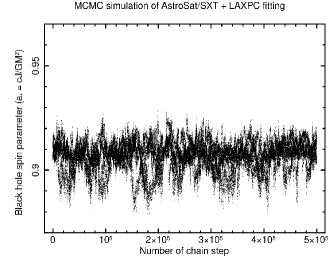
To check whether best-fit parameter values from Chandra, AstroSat and Chandra+AstroSat joint spectral analyses represent global solutions, we perform MCMC simulations of spectral parameters of all three spectral fits. If a large number of free parameters are involved in spectral modeling (for example, our best-fit spectral model has maximum 13 free parameters including cross calibration factors), then the use of minimization technique is not always reliable for estimating the model parameters (Reynolds et al., 2012). As an independent check, we employ the following MCMC simulations technique for validation of results obtained from our minimization method. As X-ray spectral counts usually follow a Poisson distribution, we replace the conventional fit statistic with the appropriate statistic for Poisson data (pgstat in XSpec). This assumes a Poisson distribution of source spectral counts, but a Gaussian distribution of background counts. The derivation of the profile likelihood of pgstat is similar to that of the likelihood of Cstatistic. With the new fit statistics, we run 5105 element chains starting from a random perturbation away from the best-fit and ignoring the first 50000 elements of the chain. The distribution of the current proposal (i.e., an assumed probability distribution for each Monte Carlo step to run the simulation) is assumed to be Gaussian with the rescaling factor of 0.001. We use the Goodman-Weare algorithm for MCMC simulations with 10 walkers.
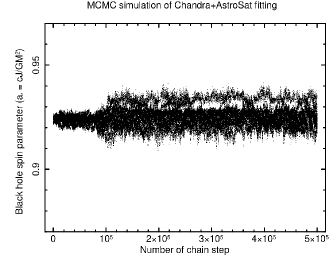
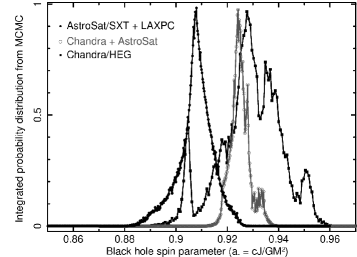
The top left, top right and bottom left panels of Figure 7 show the black hole spin parameter as a function of the number of MCMC chain steps during Chandra/HEG, AstroSat/SXT+LAXPC and Chandra/HEG+AstroSat/SXT+LAXPC spectral fits respectively. We may note that during the Chandra, AstroSat as well as Chandra+AstroSat joint spectral fitting the spin parameter is consistent within the range of . The bottom right panel shows the probability distributions of the black hole spin parameter obtained from MCMC simulations for three different spectral fits. The three probability distributions have significant overlap with each other, and their 3 range is . However, it is important to check how well the spectral hardening factor is constrained, since the spin parameter is known to have a dependency on the spectral hardening factor.
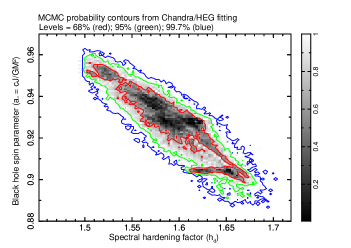
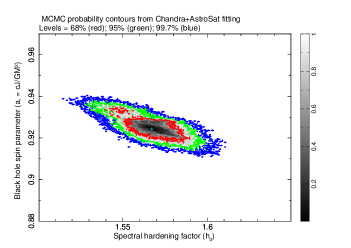
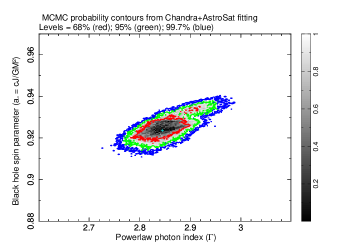
To check the relation between the spin parameter and the spectral hardening factor, we extract MCMC-derived 1, 2 and 3 integrated contours of the black hole spin parameter as a function of the spectral hardening factor from marginal probability distribution of fitted spectral parameters from Chandra/HEG and Chandra/HEG+AstroSat/SXT+LAXPC, and plot them in the top left and top right panels of Figure 8 respectively. From both panels, it is clear that the spectral hardening factor is constrained in the range of with the 99.7% confidence level. This is a little lower than the typically used value of the spectral hardening, i.e., 1.7, but it is in agreement with the fact that both Chandra and AstroSat spectra are observed during high soft state. This is because Salvesen et al. (2013) showed that during the high soft state and at an X-ray flux ergs s-1 cm-2 in the keV range, the spectral hardening factor is usually less than 1.7.
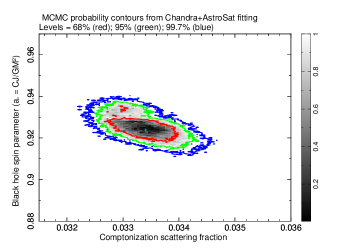
To check if there exists degeneracy among model components, e.g., degeneracy between simpl and kerrbb model parameters, in Figure 8 we plot 1 and 2 contours of the MCMC-derived black hole spin parameter from kerrbb model versus (1) MCMC-derived simpl photon powerlaw index (bottom left panel), and versus (2) simpl Comptonization scattering fraction (bottom right panel), used to fit Chandra/HEG+AstroSat/SXT+LAXPC spectra. Both plots show that the 3 range of photon powerlaw index between and Comptonization fraction between 3.2%3.5%.
Such result implies that the black hole spin parameter obtained from our analysis is robust and with the measurement using independent instrument like Chandra/HEG, AstroSat/LAXPC and AstroSat/SXT, it is well-constrained in the range of 0.88-0.96 with 3 limit.
5 Discussion and conclusions
In this work, we study the 2016 X-ray outburst from the black hole X-ray transient 4U 1630–47. Using MAXI and Swift/BAT one-day averaged lightcurves in different energy bands, we show that the outburst is visible in the keV and keV energy range and is marginally detected in the keV hard X-ray band only during the decay phase of the outburst. During the rising phase, the non-detection in the hard X-ray as well in the radio band confirms that the source has undergone a soft X-ray outburst. Similar bursts were also seen previously from this source. Very close to the peak of the outburst, AstroSat and Chandra observed the source with 94.6 ks and 30.9 ks exposure times, respectively. Although these observations were taken 20 days apart, using the HID and the CCD diagram from MAXI data, we show that the hard and soft color values at the times of AstroSat and Chandra observations were not significantly different, and these two observations were performed during the canonical high soft spectral state of the source. To further confirm the spectral state, we model the Chandra/HEG spectra, and find that the continuum is well fitted with a single relativistic, disk blackbody model. When we extend the broadband fitting up to 23 keV by including the AstroSat/LAXPC, we find that a very steep powerlaw (index ) is required at a marginal scattering fraction of 3-4%. Using Chandra grating spectra, we notice very strong absorption lines at keV and keV, which we identify as the mildly blueshifted Fe XXV and Fe XXVI absorption lines corresponding to the rest frame energies at 6.697 keV and 6.966 keV respectively. If these blueshifted lines are originated from an outflowing wind, then the velocity of the wind would be 366 56 km/s.
We find no evidence of a broad Fe emission line or any other signature of reflection features in either the Chandra or AstroSat spectra. This is not surprising, as previously the reflection spectral component from 4U 1630–47 (King et al., 2014) was observed during the intermediate state, while our observations were performed in the more luminous high soft state. We may note that using XMM-Newton spectra, Díaz Trigo et al. (2014) found an evidence of Fe emission line at the 2-10 keV unabsorbed flux of 2.12 10-8 ergs s-1 cm-2. The 2-10 keV unabsorbed flux computed from our Chandra and AstroSat joint spectral modelling is 1.33 ergs s-1 cm-2 which is lower by a factor of 2 than that reported by Díaz Trigo et al. (2014). However, 2-10 keV unabsorbed flux during their Obs 3 (also see Table 2) matches with our value and rather than the Fe emission line, they found absorption lines during the Obs 3 similar to what we found in the current study. Therefore, the accretion geometry as observed from the XMM-Newton and the present Chandra grating spectra of 4U 1630–47 may be similar at similar flux level.
Assuming a black hole mass of 10 , the Eddington luminosity of 4U 1630–47 would be 1.26 1039 ergs/s. The unabsorbed X-ray flux in keV inferred from the joint Chandra and AstroSat spectral fitting is 2.81 1038 ergs/s. Therefore, the source was accreting at % of the Eddington accretion rate during our observations. We further note that a very weak Comptonization component, inferred from our spectral fitting, implies a low hard X-ray flux available for reflection from the disk. Such a low fraction of hard X-ray flux may be a reason for the non-detection of a reflection spectral component.
There are two widely used techniques for the black hole spin measurement, based on (1) the modeling of the broad relativistic Fe emission line and other reflection features, and (2) the modeling of relativistically-modified thermal continuum spectra. In this paper, we use the latter one. For the thermal continuum modelling, the spectral data selection has the following critical criteria: (1) the continuum spectrum should have a dominant thermal disk-blackbody emission from a geometrically-thin and optically-thick accretion disk; (2) a significant presence of other spectral components, like the reflection or Comptonization continuum, is undesirable, since their presence complicates the spectral modelling, and introduces systematic uncertainties in spin measurement; and (3) the X-ray luminosity should be fairly high, but % of the Eddington luminosity, so that accretion disk is not radiation pressure dominated, and the geometrically thin disk assumption still holds true. Our continuum spectrum, as observed with both Chandra and AstroSat, satisfies all these criteria. This is because no reflection features are observed, X-ray luminosity is % of the Eddington luminosity, and % of the X-ray emission is from a geometrically thin disk. Therefore, our continuum spectra are ideal to determine the black hole spin.
5.1 On black hole spin measurement
By independently modeling Chandra/HEG, AstroSat and Chandra+AstroSat broadband spectra, and using MCMC simulations on fitted spectral parameters, we find that the 3 range of the black hole spin parameter is , which indicates the presence of a rapidly-spinning black hole in 4U 1630–47. This is close to the spin parameter value of 0.985, estimated from modeling reflection spectra of 4U 1630–47 (King et al., 2014). Note that we fix , and in our spectral fitting. Our assumption of should be reasonable, because independent methods have argued or predicted similar values (e.g., , see Section 1; ; King et al. (2014)). As argued in Section 1, our assumption of kpc should also be reasonable. While our assumption of was adopted from the estimated mass reported in Seifina et al. (2014), the absence of a dynamical measurement of mass implies the lack of a confirmed value. We, therefore, considering reasonable limits of the typical stellar black hole mass range, fix the black hole mass at and in our joint spectral modelling of Chandra and AstroSat, fix the best-fit spin values and keep the distance free to vary between 2 kpc and 50 kpc. The best-fit returns an acceptable /dof = 533/477 (1.12) and 549/477 (1.15) for the black hole mass of and respectively. This implies for a reasonable range of black hole masses and distances, the spectral fitting supports the high black hole spin. Therefore, our finding of a rapidly-spinning black hole in 4U 1630–47 should be reliable.
References
- Abe et al. (2005) Abe, Y., Fukazawa, Y., Kubota, A., Kasama, D., Makishima, K. 2005, PASJ, 57, 629
- Agrawal et al. (2017) Agrawal, P. C., Yadav, J. S., Antia, H. M., Dedhia, Dhiraj, Shah, P., Verdhan Chauhan, Jai, Manchanda, R. K., Chitnis, V. R. et al. 2017, JApA 38, 30
- Antia et al. (2017) Antia, H. M., Yadav, J. S., Agrawal, P. C., Chauhan, J. V., Manchanda, R. K., Chitnis, V. et al. 2017, ApJS, 231, 10
- Asplund et al. (2009) Asplund, M., Grevesse, N., Sauval, A.J. and Scott, P. 2009, ARA&A, 47, 481
- Augusteijn et al. (2001) Augusteijn, T., Kuulkers, E., van Kerkwijk, M. H. 2001, A&A, 375, 447
- Barret et al. (1996) Barret, D., McClintock, J. E., Grindlay, J. E., 1996, ApJ, 473, 963
- Bianchi et al. (2005) Bianchi, S., Matt, G., Nicastro, F., Porquet, D., Dubau, J. 2005, MNRAS, 357, 599
- Canizares et al. (2005) Canizares, C. R., Davis, J. E., Dewey, D., Flanagan, K. A., Galton, E. B., Huenemoerder, D. P. et al. 2005, PASP, 117, 1144
- Díaz Trigo et al. (2014) Díaz Trigo M., Migliari S., Miller-Jones J. C. A., Guainazzi, M. 2014, A&A, 571, 76
- Díaz Trigo et al. (2013) Díaz Trigo M., Miller-Jones, J. C. A., Migliari, S., Broderick, J. W., & Tzioumis, T. 2013, Natur, 504, 260
- Fragos & McClintock (2015) Fragos, T., & McClintock, J. E. 2015, ApJ, 800, 17
- Fruscione et al. (2006) Fruscione, A., McDowell, J. C., Allen, G. E., Brickhouse, N. S., Burke, D. J., Davis, J. E. 2006, SPIE, 6270, 1
- Haardt, Maraschi & Ghisellini (1994) Haardt, F., Maraschi, L. & Ghisellini, G. 1994, ApJ, 432, 95
- Jones et al. (1976) Jones, C., Forman, W., Tananbaum, H., Turner, M. J. L. 1976, ApJL, 210, L9
- Kaspi et al. (2001) Kaspi, S., Brandt, W. N., Netzer, H., George, I. M., Chartas, G., Behar, E. et al. 2001, ApJ, 554, 216
- King et al. (2014) King, A. L., Walton, D. J., Miller, J. M., Barret, D., Boggs, S. E., Christensen, F. E. et al., 2014, ApJL, 784, L2
- Krimm et al. (2013) Krimm, H. A., Holland, S. T., Corbet, R. H. D., Pearlman, A. B., Romano, P., Kennea, J. A. et al. 2013, ApJS, 209, 14
- Kubota et al. (2007) Kubota, A., Dotani, T., Cottam, J., Kotani, T., Done, C., Ueda, Y. et al., 2007, PASJ, 59, 185
- Kuulkers et al. (1998) Kuulkers, E., Wijnands, R., Belloni, T., et al. 1998, ApJ, 494, 753
- Li et al. (2005) Li, L., Zimmerman, E. R., Narayan, R., McClintock, J. E. 2005, ApJS, 157, 335
- Matsuoka et al. (2009) Matsuoka, M., Kawasaki, K., Ueno, S., Tomida, H., Kohama, M., Suzuki, M. et al. 2009, PASJ, 61, 999
- McClintock et al. (2006) McClintock, J. E., Shafee, R., Narayan, R., Remillard, R. A., Davis, S. W. & Li, L.-X. 2006, ApJ, 652, 518
- Miller (2007) Miller, J. 2007, ARA&A, 45, 441
- Miller et al. (2015) Miller, J. M., Fabian, A. C., Kaastra, J., Kallman, T., King, A. L., Proga, D., Raymond, J., Reynolds, C. S. 2015, ApJ, 814, 87
- Miller-Jones et al. (2012) Miller-Jones, J. C. A., Sivakoff, G. R., Altamirano, D., Coriat, M., Corbel, S., Dhawan, V. et al., 2012, MNRAS, 421, 468
- Mioduszewski et al. (2001) Mioduszewski, Amy J., Rupen, Michael P., Hjellming, Robert M., Pooley, Guy G. et al. 2001, ApJ, 553, 766
- Misra et al. (2017) Misra, R., Yadav, J. S., Verdhan Chauhan, J., Agrawal, P. C., Antia, H. M., Pahari, M., Chitnis, V. R. et al. 2016, ApJ, 835, 195
- Motta, Belloni & Homan (2009) Motta, S., Belloni, T. and Homan, J. 2009, MNRAS, 400, 1603
- Muno et al. (1999) Muno, M. P., Morgan, E. H., Remillard, R. A. 1999, ApJ, 527, 321
- Neilsen et al. (2014) Neilsen, J., Coriat, M., Fender, R., Lee, J. C., Ponti, G., Tzioumis, A. K., Edwards, P. G., Broderick, J. W. 2014, ApJ, 784, L5
- Neilsen et al. (2013) Neilsen, J. 2013, AdSpR, 52, 732
- Neilsen & Lee (2009) Neilsen, J., & Lee, J. C. 2009, Nature, 458, 481
- Pahari et al. (2017) Pahari, M., Antia, H. M., Yadav, J. S., Chauhan, J. V., Agrawal, P. C. et al. 2017, ApJ, 849, 16
- Pahari et al. (2018) Pahari, M., Yadav, J. S., Verdhan Chauhan, J., Rawat, D., Misra, R., Agrawal, P. C. et al. 2018, ApJL, 853, L11
- Pahari et al. (2015) Pahari, M., Misra, R., Dewangan, G. C., Pawar, P. 2015, ApJ, 814, 158
- Parmar et al. (1995) Parmar, A. N., Angelini, L. and White, N. E. 1995, ApJL, 452, L129
- Parmar et al. (1986) Parmar, A. N., Stella, L., White, N. E. 1986, ApJ, 304, 664
- Remillard & McClintock (2006) Remillard, R. A., McClintock, J. E., 2006, ARA&A, 44, 49
- Reynolds et al. (2012) Reynolds, C. S., Brenneman, L. W., Lohfink, A. M., Trippe, M. L., Miller, J. M., Fabian, A. C., Nowak, M. A. 2012, ApJ, 755, 88
- Różańska et al. (2014) Różańska, A., Madej, J., Bagińska, P., Hryniewicz, K., Handzlik, B. 2014, A&A, 562, 81
- Sale et al. (2014) Sale, S. E., Drew, J. E., Barentsen, G., Farnhill, H. J., Raddi, R., Barlow, M. J. et al. 2014, MNRAS, 443, 2907
- Salvesen et al. (2013) Salvesen, G., Miller, J. M., Reis, R. C., Begelman, M. C. 2013, MNRAS, 431, 3510
- Seifina et al. (2014) Seifina, E., Titarchuk, L., Shaposhnikov, N., 2014, ApJ, 789, 57
- Shafee, Narayan & McClintock (2008) Shafee, R., Narayan, R., & McClintock, J. E. 2008, ApJ, 676, 549
- Shakura & Sunyaev (1973) Shakura, N. I. & Sunyaev, R. A. 1973, A&A, 24, 337
- Shimura & Takahara (1995) Shimura, T. and Takahara, F., 1995, ApJ, 445, 780
- Singh et al. (2016) Singh, K. P., Stewart, G. C., Chandra, S., Mukerjee, K., Kotak, S., Beardmore, A. P., et al. 2016, SPIE, 9905
- Singh et al. (2017) Singh, K. P., Stewart, G. C., Westergaard, N. J., Bhattacharayya, S., Chandra, S., Chitnis, V. R., et al. 2017, JApA, 38, 29
- Steiner et al. (2010) Steiner, J. F. et al., 2010, ApJL, 718, L117
- Steiner et al. (2009) Steiner, J. F., Narayan, R., McClintock, J. E., Ebisawa, K. 2009, PASP, 121, 1279
- Titarchuk & Shaposhnikov (2010) Titarchuk, L. and Shaposhnikov, N. 2010, ApJ, 724, 1147
- Tomsick et al. (1998) Tomsick, J. A., Lapshov, I., Kaaret, P. 1998, ApJ, 494, 747
- Tomsick et al. (2014) Tomsick, J. A., Yamaoka, K., Corbel, S., Kalemci, E., Migliari, S., Kaaret, P., 2014, ApJ, 791, 70
- Verdhan Chauhan et al. (2017) Verdhan Chauhan, J., Yadav, J. S., Misra, R., Agrawal, P. C., Antia, H. M., Pahari, M. et al. 2017, ApJ, 841, 41
- Wang & Méndez (2016) Wang, Yanan and Méndez, M. 2016, MNRAS, 456, 1579
- Yadav et al. (2016b) Yadav, J. S., Agrawal, P. C., Antia, H. M. et al. 2016, proc. SPIE, 9905, 1
- Yadav et al. (2016a) Yadav, J. S., Misra, Ranjeev, Verdhan Chauhan, Jai, et al. 2016, ApJ, 833, 27