ISVHECRI 2018
Tests of hadronic interactions with measurements by Pierre Auger Observatory
Abstract
The hybrid design of the Pierre Auger Observatory allows for the measurement of a number of properties of extensive air showers initiated by ultra-high energy cosmic rays. By comparing these measurements to predictions from air shower simulations, it is possible to both infer the cosmic ray’s mass composition and test hadronic interactions beyond the energies reached by accelerators. In this paper, we will present a compilation of results of air shower measurements by Pierre Auger Observatory which are sensitive to the properties of hadronic interactions and can be used to constrain the hadronic interaction models. The inconsistencies found between the interpretation of different observables with regard to primary composition and between their measurements and simulations show that none of the currently used hadronic interaction models can provide a proper description of air showers and, in particular, of the muon production.
1 Introduction
The Pierre Auger Observatory ThePierreAuger:2015rma is designed to measure ultra-high energy cosmic rays () through the detection of extensive air showers (EAS). The two main parts of the observatory are the Fluorescence Detector (FD), composed of 27 telescopes grouped in 4 sites and the Surface Detector (SD), which consists of an array with 1660 water-Cherenkov detectors (WCDs) distributed over 3000 km2. The FD measurements allow the reconstruction of the longitudinal profile of EAS, whereas the SD can measure the spatial distribution of particles on the ground and their arrival times. The information obtained from both detectors can be used to reconstruct a number of EAS observables. By comparing the measurements of these observables to predictions from Monte Carlo simulations using hadronic interaction models, one can either infer the cosmic-ray’s mass composition or study the properties of hadronic interactions by testing the models. For each one of these goals, a different set of observables turns out to be more suitable.
The most reliable observable for mass composition inference is , the depth of maximum energy deposit. Lighter primaries penetrate deeper into the atmosphere than heavier ones, producing on average showers with larger values. It is well known that the is mostly driven by the properties of only the first interaction, which starts the dominant electromagnetic cascade producing most of the electron and positron contribution to the energy deposit profile. Although the exact relation between , the primary energy, and mass depends on the properties of hadronic interactions, the theoretical uncertainties on the predictions of by the most recent hadronic models are relatively small when compared to other observables (e.g. number of muons). The difference between the model predictions of is g/cm2 (which translates into a difference in of ) and is constant over energy PierogICRC2017 . Because of this, the cosmic-ray composition derived from the measurements is commonly used as a reference, allowing the hadronic models to be tested by comparing the composition interpretation from other observables with that using . The measurements by Auger can be found in Ref. Aab:2014kda ; Bellido:2017cgf .
The muonic component of EASs is particularly interesting in the context of testing hadronic interactions. Muons are mostly produced by the decay of charged mesons when their energies are low enough such that their decay length is comparable to the interaction length. Before reaching such low energies, a number of generations of hadron-air interactions is required. As a consequence, the muonic component is sensitive to the chain of hadronic interactions and, in particular, to their particle production properties. It is well known that the current hadronic models cannot provide a satisfactory description of the muon production in EAS. The most popular manifestation of this fact is the so-called muon deficit problem, i.e. the number of muons () predicted by EAS simulations is significantly smaller than that in measurements. This deficit has been observed by several experiments AbuZayyad:1999xa ; Dembinski:2017zkb ; Aab:2014pza ; Aab:2016hkv ; Abbasi:2018fkz ; Bellido:2018toz . Therefore, experimentally accessing the muonic component of EAS, through the measurements of as well as further observables sensitive to muons, is of extreme value in constraining hadronic models and possibly infer properties of hadronic interactions.
In this paper, we will present a selected compilation of measurements by the Pierre Auger Observatory which can be used to test hadronic interaction models. In Sec. 2, we present the results of the so-called Top-Down analysis, in which a set of hybrid events are compared in detail with simulations in a way that it is possible to disentangle the contributions from the electromagnetic and muonic components of EAS. In Secs. 3 and 4, we present the results of two analyses based on EAS observables which are purely muonic: the number of muons measured in highly inclined events (Sec. 3) and the muon production depth (Sec. 4). In Secs. 5 and 6, two analyses based on the parameter risetime () are presented: the measurements of the azimuthal asymmetry of risetime(Sec. 5) and the so-called -method (Sec. 6). Finally, in Sec. 7 we summarize the results.
2 Top-Down analysis
By using the experimental setup of Auger, the muon content of EAS can be directly measured in highly inclined events () by using the atmospheric attenuation to eliminate the electromagnetic component (see Sec. 3). However, it is not possible to isolate the muonic from the electromagnetic component at the detector level for vertical events (). To overcome this difficulty, an original analysis procedure was developed aiming to evaluate the muon content in hybrid events by means of a detailed comparison with Monte Carlo simulations. The full description of the analysis and the results can be found in Ref. Aab:2016hkv .
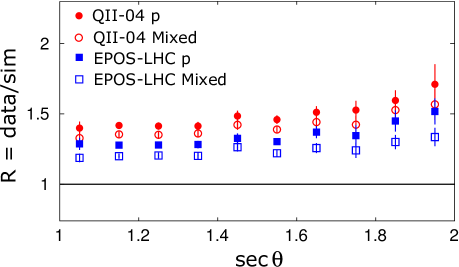
For a set of 411 high quality hybrid events with , the first analysis step was to find simulated events in which the longitudinal profile matches those measured by the FD. By construction, these simulated events have an and energy compatible with the corresponding measured event. The above procedure allows us to compare the SD signals from measured and simulated events without having to account for differences in the longitudinal development of the showers. The first step of this comparison can be seen in Fig. 1 (left), where we show the average ratio between the shower size parameter obtained from data and simulations as a function of the shower zenith angle . Apart from two different hadronic models, Epos LHC Pierog:2013ria and QGSJet II-04 Ostapchenko:2010vb , we also show two different composition assumptions: proton only and a mixed composition scenario obtained from the interpretation of the measurements by Auger. It can be seen that for any model and composition scenario, the ratio is greater than , which shows that the ground signal of measured events is at least 20% larger than the simulated ones with the same longitudinal development. Furthermore, an evolution of with zenith angle is observed, which will be important for the next step of the analysis.
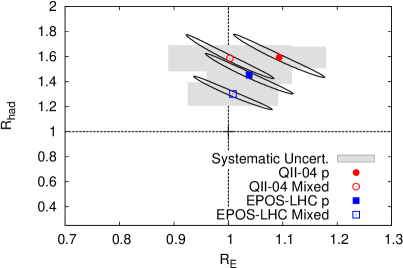
In a second step, the particle distributions in simulated events were rescaled in a way to make the data and simulations compatible in terms of the shower size . Given that the different components of the shower evolve differently with zenith angle and a large zenith angle range is covered by the present analysis, it becomes possible to separately rescale the electromagnetic component, represented by , and the hadronic component, represented by . While is directly related to the shower energy scale, is responsible for scaling the muon content, meaning that by increasing the in the shower would also increase by the same factor. A model derived from simulations was used to perform the rescaling and the results can be seen in Fig. 1 (right). To make the ground signal of simulations compatible with those observed in the data, an increase from 30% to 70% of is required, considering all the possible combinations of hadronic models and composition assumptions. On the other hand, it is observed that the energy scale factor is never required to increase by more than 10% and the case without rescaling () is covered by the systematic uncertainties in all cases.
The results described above represent a manifestation of the muon deficit problem. The best case scenario of the mixed composition assumption with Epos LHC as hadronic model still requires an increase of 30% on the predicted by simulations at energies . For the first time, the muon deficit was evaluated by disentangling the contribution of the muonic component from the energy scale.
3 Number of muons in highly inclined showers
An efficient way of measuring muons using the SD without contamination from the electromagnetic component is by using the atmosphere as a shield. Above a certain atmospheric depth (), the electromagnetic component is strongly attenuated while most muons still penetrate down to the ground. Such large atmospheric depths are reached by highly inclined events. In this analysis, events with zenith angle measured by both SD and FD are selected and their muon content is reconstructed. The full analysis description and results can be found in Ref. Aab:2014pza .
Because of the complicated dependencies of the muon density () with the zenith angle () and azimuthal angle () of an event and the axis distance of a station (), a template fit method was adopted to describe the distribution of muons on the ground of measured events. The templates were built using Monte Carlo simulations of proton primaries at using QGSJet II-03 Ostapchenko:2010vb as the hadronic model. The measured SD signals were then fitted by using the templates in which the normalization parameter () was left free. By applying the same fit to simulated events, the bias on was estimated. After correcting for the bias, an unbiased estimator for the template normalization was obtained. For any given zenith angle, can be recovered from . For example, corresponds to muons at the ground level above 0.3 GeV (muon energy threshold in the WCDs) for .
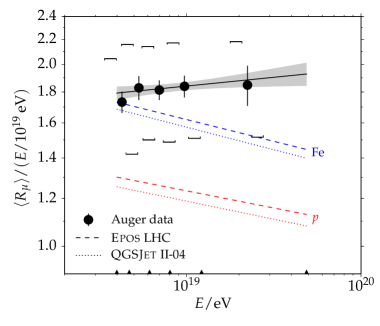
The average over energy bins as a function of energy is shown in Fig. 2 (left), where the energy was reconstructed independently of from the FD measurements. The predictions for proton and iron primaries using two hadronic models are also shown for comparison. The systematic uncertainties, depicted with square brackets, are dominated by the uncertainties on the energy scale.
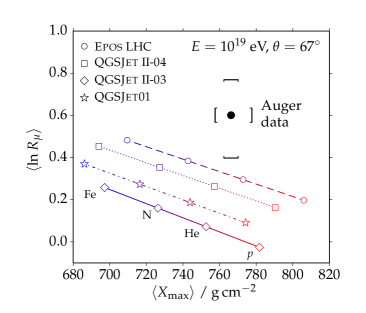
By comparing our measurements with predictions of simulations, we can observe that, even considering the lowest values of allowed by the systematic uncertainties, the muon content of inclined events would imply a very heavy composition interpretation. The compatibility of this interpretation with the composition scenario expected from the measurements is tested in Fig. 2 (right), where we show versus at . One can conclude that, by assuming the composition, the measured value of is significantly larger than that expected from the simulation, regardless of the hadronic model. This fact shows another manifestation of the muon-deficit problem, which is complementary to the result presented in Sec. 2 in terms of the event zenith angle.
4 Muon production depth
The time structure as measured by the SD contains a lot of information about the EAS development. The analyses presented in the next three sections make use of the time traces recorded by the WCDs to reconstruct EAS properties.
Since a muon propagates nearly linearly from its production point down to the ground, its arrival time can be mapped into their production depths by using simple geometrical considerations. In practice, this procedure requires SD stations with a large muon purity and a precise knowledge of the muon time delay. The former requirement is satisfied by selecting stations far from the shower axis in highly inclined showers, while a model based on simulations is used to correct for the muon time-delay.
After reconstructing the muon production depth for each event, the maximum of the profile () can be determined, the energy evolution of its moments can be evaluated, and compared to predictions by simulations. The carries the information about the depth of the first interaction, folded with the longitudinal development of the hadronic component of the EAS which is responsible for the muon production. It has been shown that is very sensitive to the properties of pion-air interactions Ostapchenko:2016bir ; Pierog:2015ifw .
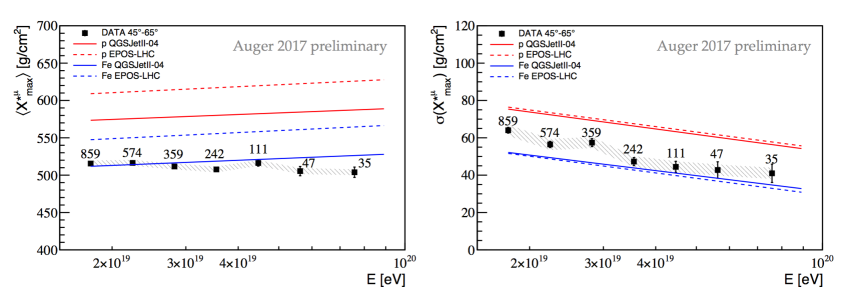
A first version of the muon production depth analysis was published in Ref. Aab:2014dua , and recently, an updated version has been released in Ref. AugerMPDICRC . Among other improvements, the updated analysis extends the zenith angle and the lateral distance range of the selected stations, increasing significantly the number of available events. With the resulting larger statistical power, it is possible to derive not only the , but also the . In Fig. 3, we show both and as a function of energy in comparison with the prediction from simulations of proton and iron primaries. Similarly to what can be seen in the results published in Ref. Aab:2014dua , the composition interpretation of the implies the presence of primaries as heavy as iron for QGSJet II-04 Ostapchenko:2004ss and even heavier for Epos LHC. This interpretation is clearly inconsistent with that obtained from the measurements, which means that the hadronic models cannot properly describe the longitudinal development of muon production yet.
5 Azimuthal asymmetry of the risetime
Both analyses presented in this and in the next section are based on the risetime parameter (). It is defined as the time of increase from 10% to 50% of the integrated signal of each WCD station. Given that muons on average arrive earlier at the detector than electrons, turns out to be sensitive to the relationship between these two components. This implies that, for example, increasing the relative number of muons arriving in a given station would result in a faster increase in the WCD signal and thus a smaller . Because of this, the parameter is suitable for composition inferences and tests of hadronic models.
Because is a station quantity with a very complicated dependence on parameters like shower zenith-angle, station azimuthal-angle and station lateral-distance, it is impractical to define one unique -based parameter for each event. Instead, the two analyses presented in this paper follow approaches in which these above mentioned dependencies are explored in order to obtain information about the EAS development. In this section, the azimuthal dependence of will be explored.
It is observed that the average as a function of the station azimuthal angle () presents a maximum at the point in which the shower front reaches the ground the earliest, where the relative contribution of the electromagnetic component to the signal is the largest. This point is defined as . The shape of as a function of can be well described by , where the factor is included to account for the almost linear dependence of on the distance from the shower. The degree of asymmetry of can be quantified by the asymmetry factor defined as . For larger asymmetry factors, the peak of at is more pronounced.
In nearly vertical events, the asymmetry factor is expected to vanish for symmetry reasons. The same behavior is expected for very inclined showers, in which the shower front is dominated by muons that are very weakly attenuated and consequently present very similar time structures for all azimuthal regions. In between these two extremes, the asymmetry factor presents a maximum. It is observed that the zenith angle which corresponds to this maximum () carries information about the relative amount of muons in EAS and consequently can be used as an observable sensitive to composition and hadronic interaction properties. The full description of the analysis and results can be found in Ref. Aab:2016enk .
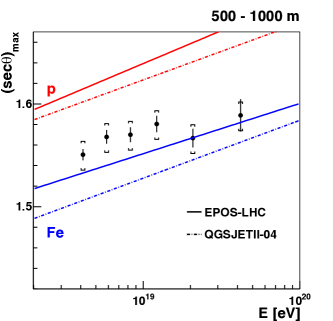
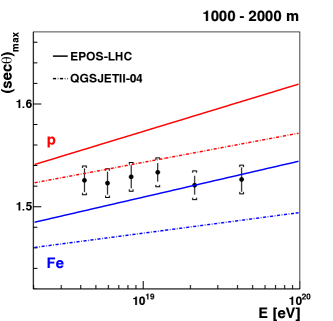
In Fig. 4, we show the energy evolution of derived in energy bins. The predictions from simulations are also shown for two hadronic interaction models for proton and iron primaries. The left (right) plot shows the results for the sub-dataset of stations with (). The composition interpretation of the measurements imply, in general, the presence of heavier primaries on average, when compared to the composition expected from the measurements (see Ref. Aab:2016enk ). The difference is of order of . The only case in which both observables are consistent is for QGSJet II-04 at . The inconsistency with the composition and between the two different axis distance ranges, for QGSJet II-04, are indications of a problem with the description of the asymmetry by the models. Since the is sensitive to the muon content of EAS, these problems can be related to the muon deficit.
6 The Delta method
The second analysis based on risetime to be presented in this paper makes use of the dependence of on the distance from the shower axis to derive a new event parameter . From the measured for each SD station within an event, the parameter is computed, where is obtained from a benchmark and is the uncertainty on . is defined as the average of over selected stations, .
Two intermediate steps are important for the derivation of : the definition of the benchmarks and the estimation of the uncertainties. First, the benchmark is defined as the average behavior of as a function of observed in data for a given reference primary energy. By construction, the vanishes at the reference energy. The benchmark curve was parametrized accounting for its dependence on the zenith angle. Secondly, the uncertainties are determined through a detailed study of the subsets of SD twins stations, which are pairs of stations located effectively at the same position, and pairs, which are stations within the same event at different positions but at approximately the same distance from the shower axis.
A detailed parametrization of was then performed by accounting for its dependences on , , and the station signal . The full description of the method and the results can be found in Ref. Aab:2017cgk .
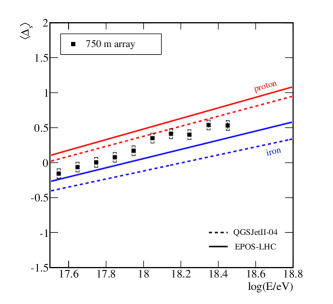
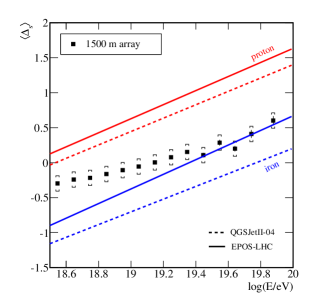
In Fig. 5, we show the in energy bins as a function of the primary energy together with the predictions by simulations with two hadronic models. The two plots show the results for the two SD arrays, with SD stations spaced by 750 m on the left and 1500 m on the right. The energy bins chosen for the definition of the benchmarks are and for the 750 and 1500 m array, respectively. The composition interpretation from the comparison of the measured with the predictions from simulations is not consistent with the one from the measurements (see Ref. Aab:2017cgk ).
Although strong similarities can be seen on the energy evolution of , a systematic difference of to is observed, where the composition derived from is heavier than the one from . These differences on are of the same order as the differences observed in the azimuthal asymmetry analysis (see Sec. 5). Thus, the method provides us with further evidence that the hadronic models cannot properly describe the parameter, assuming that the uncertainties on the predictions are relatively small. Again, this can be related to the muon deficit problem, since the is sensitive to both electromagnetic and muonic components.
It is worthwhile noting that, apart from testing the predictions of the hadronic models, the method can also be effectively used for composition inferences through a cross calibration procedure with the measured by the FD (see Ref. Aab:2017cgk for the composition results).
7 Summary
The experimental setup of the Pierre Auger Observatory offers great capability for testing hadronic interactions. While the calorimetric energy and the longitudinal development of the showers () can be measured by the FD, the SD provides the lateral distribution of the particles on the ground as well as the particle arrival time distributions. By combining measurements of both detectors, it is possible to reconstruct a number of properties of EAS that can be used to test the consistency of the EAS description with the simulations with hadronic interaction models.
We have presented here a selection of five analyses. In Secs. 2 and 3, the muon content of EAS was measured with two different approaches and using datasets with complementary zenith angle ranges. The muon deficit in simulations was observed in both cases. An increase of at least 30% on the number of muons in simulation predictions is required to make the muon content measurements consistent with the composition interpretation from the measurements.
In Sec. 4, the measured arrival time distributions of the particles at the ground were used to access the longitudinal development of the muonic component. The maximum of the muon production depth was reconstructed and, by comparing its moments to simulation predictions, it is observed that the hadronic models cannot provide a consistent description of the muon production profile and the .
In Secs. 5 and 6, two analyses based on the parameter were presented: the azimuthal asymmetry analysis and the method. The results from both analyses show again an inconsistency in the descriptions of these observables when using the as a reference. The discrepancy in this case is not as large as in the case of the pure muonic observables ( and ) and it might be also related to the deficit of muons in simulations.
More precise constraints on the hadronic models will be possible in the future with AugerPrime, the upgrade of the Pierre Auger Observatory Aab:2016vlz . By using dedicated muon detectors of two types (SSD and AMIGA), more information about the muonic component will be obtained and valuable experimental input will be provided for the study of hadronic interactions.
References
- (1) A. Aab et al. (Pierre Auger Collab.), Nucl. Instrum. Methods Phys.. A 798, 172 (2015), 1502.01323
- (2) T. Pierog, Proc. of 35th ICRC (2017)
- (3) A. Aab et al. (Pierre Auger Collab.), Phys. Rev. D 90, 122005 (2014), 1409.4809
- (4) J. Bellido (for the Pierre Auger Collab.), Proc. of 35th ICRC (2017), 1708.06592
- (5) T. Abu-Zayyad et al. (HiRes/MIA Collab.), Phys. Rev. Lett. 84, 4276 (2000), astro-ph/9911144
- (6) H. Dembinski (IceCube Collab.), EPJ Web Conf. 145, 01003 (2017)
- (7) A. Aab et al. (Pierre Auger Collab.), Phys. Rev. D 91, 032003 (2015), 1408.1421
- (8) A. Aab et al. (Pierre Auger Collab.), Phys. Rev. Lett. 117, 192001 (2016), 1610.08509
- (9) R.U. Abbasi et al. (Telescope Array Collab.), Phys. Rev. D 98, 022002 (2018), 1804.03877
- (10) J.A. Bellido et al., Phys. Rev. D 98, 023014 (2018), 1803.08662
- (11) T. Pierog et al., Phys. Rev. C 92, 034906 (2015), 1306.0121
- (12) S. Ostapchenko, Phys. Rev. D 83, 014018 (2011), 1010.1869
- (13) M. Mallamaci (for the Pierre Auger Collab.), Proc. of 35th ICRC (2017), 1708.06592
- (14) S. Ostapchenko, M. Bleicher, Phys. Rev. D 93, 051501 (2016), 1601.06567
- (15) T. Pierog et al., Proc. of the 34th ICRC (2015)
- (16) A. Aab et al. (Pierre Auger Collab.), Phys. Rev. D 90, 012012 (2014), 1407.5919
- (17) S. Ostapchenko, Nucl. Phys. Proc. Suppl. 151, 143 (2006), hep-ph/0412332
- (18) A. Aab et al. (Pierre Auger Collab.), Phys. Rev. D 93, 072006 (2016), 1604.00978
- (19) A. Aab et al. (Pierre Auger Collab.), Phys. Rev. D 96, 122003 (2017), 1710.07249
- (20) A. Aab et al. (Pierre Auger Collab.) (2016), 1604.03637