Mechanics of tissue competition: Interfaces stabilize coexistence
Abstract
Mechanical forces influence the dynamics of growing tissues. Computer simulations are employed to study the importance of interfacial effects in tissue competition. It was speculated that mechanical pressure determines the competition, where the determining quantity is the homeostatic pressure - the pressure where division and apoptosis balance; the tissue with the higher homeostatic pressure overwhelms the other. Surprisingly, a weaker tissue can persist in stable coexistence with a stronger tissue, if adhesion between them is small enough. An analytic continuum description can quantitatively describe the underlying mechanism and reproduce the resulting pressures and cell-number fractions. Computer simulations furthermore display a variety of coexisting structures, ranging from spherical inclusions to a bicontinuous state.
Mechanical forces influence the growth of cells and tissues in several ways Shraiman (2005); Wozniak and Chen (2009); Irvine and Shraiman (2017). This ranges from plants adapting their growth patterns to mechanical loads Jarvis et al. (2003); Coen et al. (2017), all the way to tumor growth responding to mechanical forces Kumar and Weaver (2009); Butcher et al. (2009); Taloni et al. (2015). Cells have been shown to differentiate according to substrate stiffness Engler et al. (2006), and divide according to mechanical stress and strain Nelson et al. (2005); Cheng et al. (2009); Fink et al. (2011); Uyttewaal et al. (2012); Streichan et al. (2014); LeGoff and Lecuit (2015); Eder et al. (2017). Spheroids of many cells, grown in elastic gels Helmlinger et al. (1997); Gordon et al. (2003); Kaufman et al. (2005) or shells Alessandri et al. (2013); Domejean et al. (2017), or even in suspension with osmotic stress Montel et al. (2011, 2012); Delarue et al. (2013); Taloni et al. (2014), show strong dependence of growth on the mechanical stress from the embedding medium.
Given the evidence of mechanical stress on growth, it seems clear that mechanics should also influence tissue competition, such as the competition between different mutants in the imaginal wing disk of drosophila Morata and Ripoll (1975); Diaz and Moreno (2005), or clonal expansion in multistep cancerogenesis Moolgavkar and Luebeck (2003); Meza and Chang (2015). Several theoretical studies suggested mechanics as the underlying mechanism for both, competition Shraiman (2005) and size determination Hufnagel et al. (2007) in the wing, and tumor growth Basan et al. (2009); Taloni et al. (2015).
Growth is a change of volume and the conjugate force to volume is pressure. It stands to reason that pressure should influence growth. A tissue grown in a finite compartment exerts a certain pressure onto its surrounding. When reaching a steady state - the homeostatic state - this is the homeostatic pressure . Under an external pressure below this value, the tissue grows; whereas it shrinks if the pressure is above it. This simple approach can be formulated as a linear expansion of the bulk growth rate around the homeostatic pressure Basan et al. (2009),
| (1) |
with the pressure response factor . This idea has been developed to understand mechanical tissue comepetition in general, and metastatic inefficiency in particular: It was argued that metastases need to reach a critical size, below which the Laplace pressure from the interfacial tension exeeds the homeostatic pressure difference, and the metastasis disappears Basan et al. (2009). To study the role of pressure on growth, experiments and computer simulations have been developed to explore this effect in cell culture and in silico Montel et al. (2011); Basan et al. (2011); Montel et al. (2012); Delarue et al. (2013); Podewitz et al. (2015, 2016). While confirming the general assumption - that mechanical pressure reduces growth - these experiments and simulations have led to another important revelation. Tissues preferentially divide at the surface, even to the extent that they die (on average) in the bulk and sustain a finite size only by surface growth. While consideration of nutrient transport may be neccessary for quantitative description of some experiments Jagiella et al. (2016), mechanics alone already suffice.
In this work, we study the role of interfacial effects on mechanical tissue competition by numerical simulations, in particular the effect of adhesive interactions between different tissues. We find that similar to free surfaces, cells divide preferentially at the low-adhesive interface. This interfacial growth in turn can stabilize coexistence of two tissues with different homeostatic pressures.
Agent-based modelling of tissue growth has been very successful in the recent years Van Liedekerke et al. (2015); Kobayashi et al. (2018). We follow the approach of Ref. Basan et al. (2011) and model growing and dividing cells by two point-like particles, which repel each other with a growth force . Once a critical distance is reached, cells divide, and two new particles are inserted, starting the process anew. Apoptosis is modeled by a constant rate of cell removal . Volume exclusion is maintained by a relatively soft repulsive force , while adhesion between cells is modeled by a constant attractive force between all cells in range . This model results in pressure-dependent growth, in reasonable agreement with experiments Montel et al. (2011); Basan et al. (2011); Montel et al. (2012); Delarue et al. (2013); Podewitz et al. (2015, 2016). For two competing tissues A and B, parameters for each tissue can be set independently. In this work, we only vary the growth strength and , the self adhesion strengths, , and the cross-adhesion strength . See SI for further details and parameters.
To our great surprise, very small cross-adhesion strengths between cells of different tissues (i.e. ) result in fundamentally different outcomes of the tissue competition than predicted previously Basan et al. (2009). Instead of one tissue overwhelming the other or the existence of a critical size threshold explained above, we observe stable coexistence in a variety of different structures depending on initial conditions (see Fig. LABEL:structures). Even for two identical tissues - just without cross-adhesion - a single A cell in a host of B grows into a stable spheroid occupying about a third of the volume. Similarly, a random 1:2 mixture of stronger A cells in a host of B can result in a stable 3:1 Schwarz-P bicontiuous structure.
In order to understand this puzzling behaviour and the underlying physical mechanisms, we turn to a simpler initial condition of a slab-like tissue arrangement and develop an appropriate analytic model.
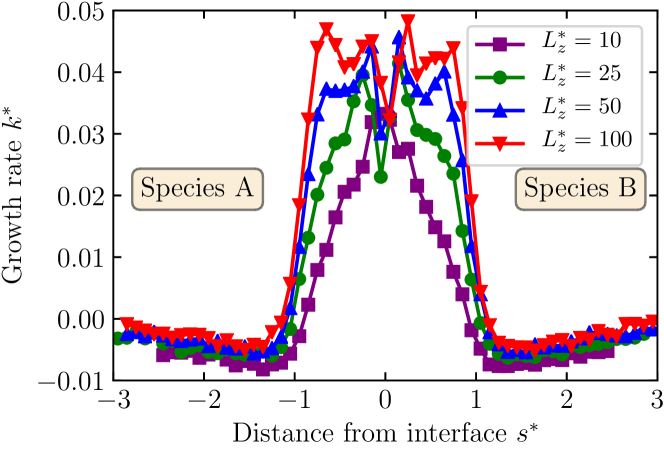
Cells are confined to a finite (periodic) compartment of size . All cells in the central half () are type B cells, all others type A. Large adhesion between cells of the same tissue and no adhesion between cells of different tissues leads to a large surface tension, stabilizing the flat interface. The division profile (see Fig. 2) reveals that cells divide more in a small region of width (about one or two cell layers) at the interface. In the bulk of the tissue, the net growth is negative due to an elevated pressure. These results motivate a two-rate growth model Montel et al. (2011); Basan et al. (2011); Montel et al. (2012); Delarue et al. (2013); Podewitz et al. (2015)
| (2) |
where is the cellular density, the Heavyside step function, the distance to the nearest interface and v the cell-velocity field. The additional growth at the interface is modeled as a growth enhancement near the interface (less than away).
Division and apoptosis events locally relax stress and thus lead to a liquidification of the tissue on longer timescales Ranft et al. (2010); Khalilgharibi et al. (2016); Matoz-Fernandez et al. (2017). Indeed, experiments on tissue rheology suggest liquid behaviour on long timescales Phillips and Steinberg (1978); Guevorkian et al. (2010); Gonzalez-Rodriguez et al. (2013), while some experiments on drosophila wing discs suggest that not all stress is relaxed by growth LeGoff et al. (2013); Mao et al. (2013); Pan et al. (2016). Our model tissue clearly behaves as a liquid Ranft et al. (2010). With the low velocities and no external forcing, we can thus assume a constant pressure across the system. This motivates expanding as in Eq. (1), and similarly . Under the assumption of constant density and with an integration over the system, the time evolution of the cell number fraction of type A cells reads
| (3) |
with the fraction of A type cells at the surface. Two identical tissues (without cross-adhesion) then develop two interfaces apart. Insertion of the linear expansions in Eq. (3) then yields the pressure
| (4) |
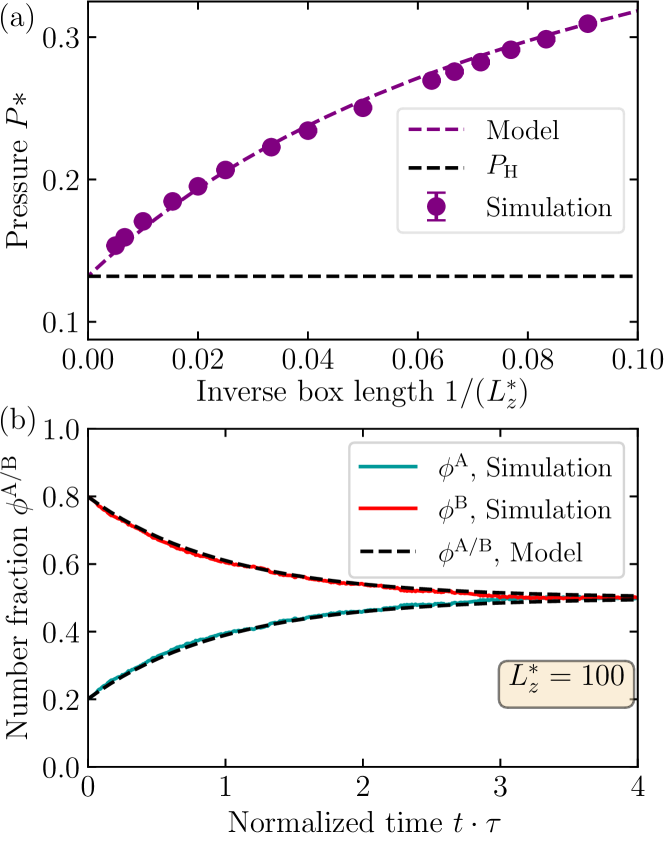
i.e. the additional growth at the interface elevates the pressure above the homeostatic pressure, which in turn causes the negative net growth rate in the bulk. We determine the bulk parameters from bulk simulations as in Ref. Podewitz et al. (2015), and the surface parameters by fitting Eq. (4) to a tissue with mirror boundary conditions in one direction (see SI). As shown in Ref. Podewitz et al. (2015), the homeostatic pressure grows approximately linearly with , and decreases linearly with . is essentially independent off , but decreases linearly with . The surface parameter is only weakly dependent on , but grows linearly with , while does not show a clear dependence on tissue parameter (see SI). Representatively, we show the pressure dependence on box length for two identical tissues without cross adhesion. With the parameters fixed, the theory reproduces the simulations without further parameter adjustment (see Fig. 3(a)).
For identical tissues, the steady-state solution to Eq. (3) is by symmetry. For the dynamics we obtain
| (5) |
with the initial number fraction . As shown in Fig. 3(b), Eq. (5) reproduces the simulation dynamics.
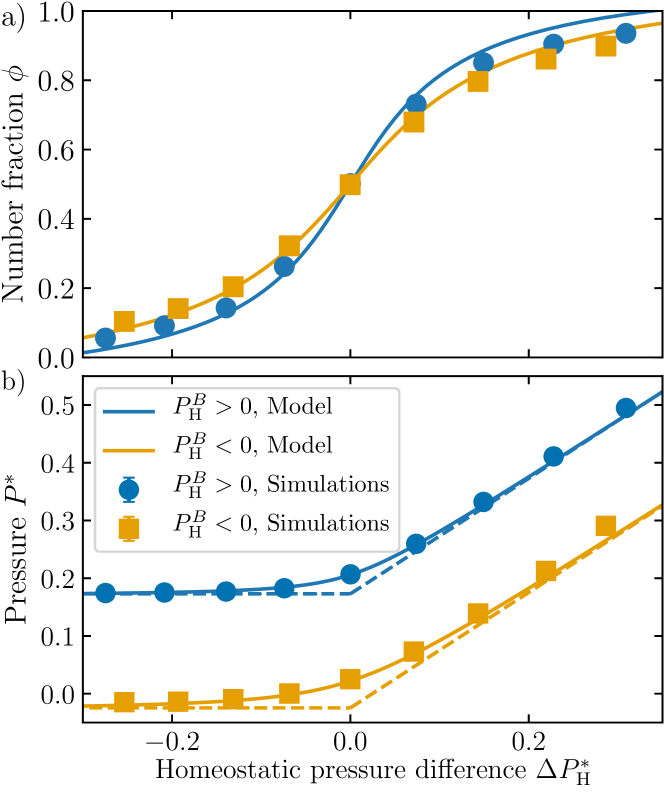
Next, we explore the competition between two different tissues with a planar interface. We balance the pressures on both sides of the interface and get
| (6) |
where and are the lengths occupied by tissue A and B. Note that inserting in Eq. (6) gives a lower bound for the pressure: The system pressure is always larger than the homeostatic pressure of the stronger tissue, plus a system-size-dependent constant. Indeed, this lower bound describes the pressure rather well. The stronger tissue occupies the larger part of the system, and thus . Thus the pressure is almost constant for , and grows almost linearly for (see Fig. 4). The weaker tissue suports the higher pressure by decreasing in size, and thus its apoptotic volume, sustained by surface growth. For the simulated tissues, the parameter , and only show small variations (see SI). We therefore assume them to be the same for both tissues in order to obtain
| (7) | ||||
Note that for , Eq. (7) reproduces as expected. Around , grows linearly with and then slows down (see Fig. 4). For large differences in homeostatic pressure, the model predicts two interfaces less than apart, thus violating its assumptions, and consequently fails to predict the simulation results properly. Equations (6) and (7) are able to reproduce simulation results fairly well without parameter adjustments (see Fig. 4) in a broad parameter regime. Note that this also holds true for negative homeostatic bulk pressures, where indeed the system pressure is positive, thanks to the surface growth (see Eq. (6)).
These results show that indeed the enhanced growth at the interface lies at the heart of the coexistence of tissues observed in our simulations. However, a flat interface is not the only stable structure for two competing tissues. Depending on initial conditions and parameters, a large range of other structures can be found (see Fig. LABEL:structures). These different structures result in different surface-to-volume ratios (and possibly other interfacial effects), changing the steady-state volume fractions and pressures. We present simulation results for these structures in Fig. 5.
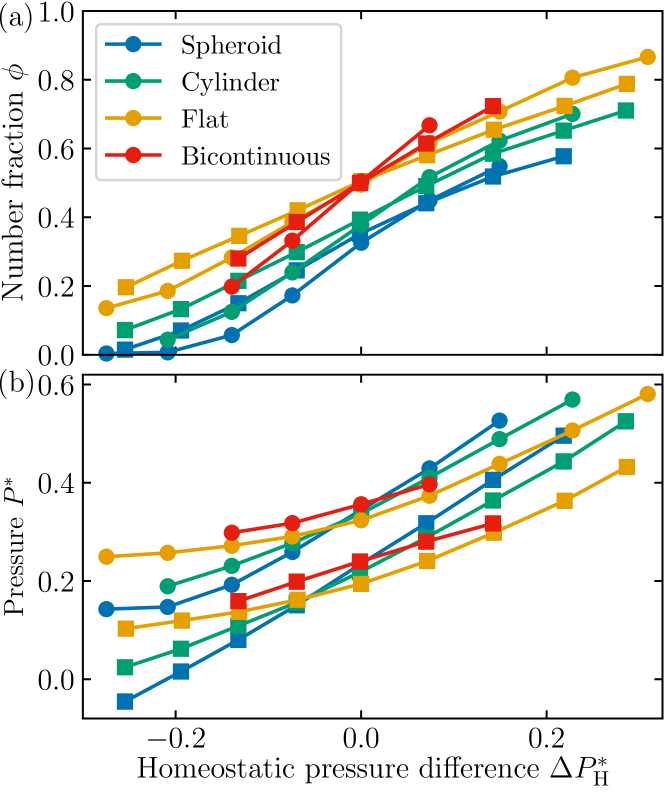
Compared to flat interfaces, the number fraction of tissues in spherical or cylindrical configuration is smaller, with spheroids being smaller than cylinders. Note that spheroids become unstable with growing homeostatic pressure difference. They then turn into cylinders, which again become unstable and turn into a slab-like structure, which probably becomes unstable as well. Vice versa, cylinders turn into spheroids if the difference in homeostatic pressure is very negative. The number fraction of the bicontinuous phase is roughly the same as for flat interfaces, but the bicontinuous phase is only stable in a small regime of homeostatic pressure differences. For larger differences in homeostatic pressure it turns into a perforated lamella phase of the weaker tissue inside the stronger tissue. In general, the number fraction of all structures changes sigmoidally with homeostatic pressure difference (see Fig. LABEL:structures).
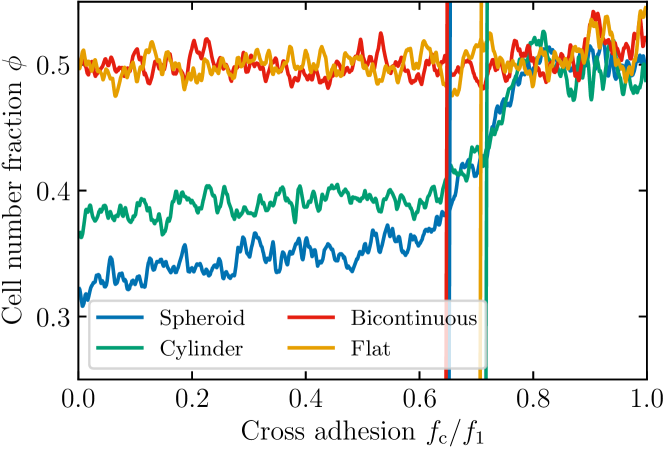
While all of these structures are very stable over time, the question arises how stable they are when the interfacial effects become smaller. We study this effect numerically, by observing the structures for two identical tissues formed under zero cross-adhesion and continuously increase the cross-adhesion to the value of self-adhesion (i.e. ). Figure 6 shows that all structures remain almost unchanged up to a cross-adhesion approximately two thirds of the self adhesion . For higher only a mixed, sponge-like state remains.
In summary, the interface between two tissues plays an important role in the competition between them. The enhanced growth at the interface can stabilize coexisting phases even when one tissue has a higher homeostatic pressure. The coexisting phase appears in a variety of different structures, ranging from a spherical inclusion over a flat interface to a bicontinous phase.
Interesting future directions are interfacial dynamics, roughness, and shapes, as previously explored for tissues on substrates and without additional interfacial growth Ranft et al. (2014); Podewitz et al. (2016); Williamson and Salbreux (2017). Vice versa, it would be interesting to add interfacial growth to tissues growing on substrates.
Finally, our results suggests a tentative explanation for tumor heterogeneity and the abundance of occult tumors: small symptom-free micro-tumors that are frequently found in the human body Bissell and Hines (2011). For the theyroid, it is indeed considered ’normal’ to find microscopic lesions Harach et al. (1985). Our results provide a mechanical explanation how coexsistence of different tissues can be stable by simple mechanical effects. For example, a mutation might downregulate cadherins - an important cellular adhesion protein - as it often happens in tumors Weinberg (2007). On the one hand, this might reduce survival signaling Alberts et al. (1994), but the lack of adhesion also favors our mechanism of coexistence, even for weaker tissue growth.
I Acknowledgements
The authors gratefully acknowledge the computing time granted through JARA-HPC on the supercomputer JURECA Jülich Supercomputing Centre (2018) at Forschungszentrum Jülich
References
- Shraiman (2005) B. I. Shraiman, Proc. Natl. Acad. Sci. U. S. A. 102, 3318 (2005).
- Wozniak and Chen (2009) M. A. Wozniak and C. S. Chen, Nat. Rev. Mol. Cell Biol. 10, 34 (2009).
- Irvine and Shraiman (2017) K. D. Irvine and B. I. Shraiman, Development 144, 4238 (2017).
- Jarvis et al. (2003) M. Jarvis, S. Briggs, and J. Knox, Plant Cell Environ. 26, 977 (2003).
- Coen et al. (2017) E. Coen, R. Kennaway, and C. Whitewoods, Development 144, 4203 (2017).
- Kumar and Weaver (2009) S. Kumar and V. M. Weaver, Cancer Metastasis Rev. 28, 113 (2009).
- Butcher et al. (2009) D. T. Butcher, T. Alliston, and V. M. Weaver, Nat. Rev. Cancer 9, 108 (2009).
- Taloni et al. (2015) A. Taloni, M. Ben Amar, S. Zapperi, and C. A. La Porta, Eur. Phys. J. Plus 130, 224 (2015).
- Engler et al. (2006) A. J. Engler, S. Sen, H. L. Sweeney, and D. E. Discher, Cell 126, 677 (2006).
- Nelson et al. (2005) C. M. Nelson, R. P. Jean, J. L. Tan, W. F. Liu, N. J. Sniadecki, A. A. Spector, and C. S. Chen, Proc. Natl. Acad. Sci. U.S.A. 102, 11594 (2005).
- Cheng et al. (2009) G. Cheng, J. Tse, R. K. Jain, and L. L. Munn, PLoS One 4, e4632 (2009).
- Fink et al. (2011) J. Fink, N. Carpi, T. Betz, A. Betard, M. Chebah, A. Azioune, M. Bornens, C. Sykes, L. Fetler, D. Cuvelier, and M. Piel, Nat. Cell Biol. 13, 771 (2011).
- Uyttewaal et al. (2012) M. Uyttewaal, A. Burian, K. Alim, B. Landrein, D. Borowska-Wykret, A. Dedieu, A. Peaucelle, M. Ludynia, J. Traas, A. Boudaoud, D. Kwiatkowska, and O. Hamant, Cell 149, 439 (2012).
- Streichan et al. (2014) S. J. Streichan, C. R. Hoerner, T. Schneidt, D. Holzer, and L. Hufnagel, Proc. Natl. Acad. Sci. U.S.A. 111, 5586 (2014).
- LeGoff and Lecuit (2015) L. LeGoff and T. Lecuit, Cold Spring Harbor Perspect. Biol. 8, a019232 (2015).
- Eder et al. (2017) D. Eder, C. Aegerter, and K. Basler, Mech. Dev. 144, 53 (2017).
- Helmlinger et al. (1997) G. Helmlinger, P. A. Netti, H. C. Lichtenbeld, R. J. Melder, and R. K. Jain, Nat. Biotechnol. 15, 778 (1997).
- Gordon et al. (2003) V. D. Gordon, M. T. Valentine, M. L. Gardel, D. Andor-Ardo, S. Dennison, A. A. Bogdanov, D. A. Weitz, and T. S. Deisboeck, Exp. Cell Res. 289, 58 (2003).
- Kaufman et al. (2005) L. J. Kaufman, C. P. Brangwynne, K. E. Kasza, E. Filippidi, V. D. Gordon, T. S. Deisboeck, and D. A. Weitz, Biophys. J. 89, 635 (2005).
- Alessandri et al. (2013) K. Alessandri, B. R. Sarangi, V. V. Gurchenkov, B. Sinha, T. R. Kiesling, L. Fetler, F. Rico, S. Scheuring, C. Lamaze, A. Simon, S. Geraldo, D. Vignjevic, H. Domejean, L. Rolland, A. Funfak, J. Bibette, N. Bremond, and P. Nassoy, Proc. Natl. Acad. Sci. U.S.A. 110, 14843 (2013).
- Domejean et al. (2017) H. Domejean, M. d. l. M. Saint Pierre, A. Funfak, N. Atrux-Tallau, K. Alessandri, P. Nassoy, J. Bibette, and N. Bremond, Lab. Chip 17, 110 (2017).
- Montel et al. (2011) F. Montel, M. Delarue, J. Elgeti, L. Malaquin, M. Basan, T. Risler, B. Cabane, D. Vignjevic, J. Prost, G. Cappello, and J. F. Joanny, Phys. Rev. Lett. 107, 188102 (2011).
- Montel et al. (2012) F. Montel, M. Delarue, J. Elgeti, D. Vignjevic, G. Cappello, and J. Prost, New J. Phys. 14, 055008 (2012).
- Delarue et al. (2013) M. Delarue, F. Montel, O. Caen, J. Elgeti, J.-M. Siaugue, D. Vignjevic, J. Prost, J.-F. Joanny, and G. Cappello, Phys. Rev. Lett. 110, 138103 (2013).
- Taloni et al. (2014) A. Taloni, A. A. Alemi, E. Ciusani, J. P. Sethna, S. Zapperi, and C. A. M. La Porta, PLoS One 9, e94229 (2014).
- Morata and Ripoll (1975) G. Morata and P. Ripoll, Dev. Biol. 42, 211 (1975).
- Diaz and Moreno (2005) B. Diaz and E. Moreno, Exp. Cell. Res. 306, 317 (2005).
- Moolgavkar and Luebeck (2003) S. H. Moolgavkar and E. G. Luebeck, Genes. Chromosomes Cancer 38, 302 (2003).
- Meza and Chang (2015) R. Meza and J. T. Chang, BMC Public Health 15, 789 (2015).
- Hufnagel et al. (2007) L. Hufnagel, A. A. Teleman, H. Rouault, S. M. Cohen, and B. I. Shraiman, Proc. Natl. Acad. Sci. U. S. A. 104, 3835 (2007).
- Basan et al. (2009) M. Basan, T. Risler, J.-F. Joanny, X. Sastre-Garau, and J. Prost, HFSP J 3, 265 (2009).
- Basan et al. (2011) M. Basan, J. Prost, J.-F. Joanny, and J. Elgeti, Phys. Biol. 8, 026014 (2011).
- Podewitz et al. (2015) N. Podewitz, M. Delarue, and J. Elgeti, Europhys. Lett. 109, 58005 (2015).
- Podewitz et al. (2016) N. Podewitz, F. Jülicher, G. Gompper, and J. Elgeti, New J. Phys. 18, 083020 (2016).
- Jagiella et al. (2016) N. Jagiella, B. Mueller, M. Mueller, I. E. Vignon-Clementel, and D. Drasdo, PLoS Comput. Biol. 12, 1 (2016).
- Van Liedekerke et al. (2015) P. Van Liedekerke, M. M. Palm, N. Jagiella, and D. Drasdo, Comput. Part. Mech. 2, 401 (2015).
- Kobayashi et al. (2018) Y. Kobayashi, Y. Yasugahira, H. Kitahata, M. Watanabe, K. Natsuga, and M. Nagayama, npj Comput. Mater. 4, 45 (2018).
- Ranft et al. (2010) J. Ranft, M. Basan, J. Elgeti, J.-F. Joanny, J. Prost, and F. Jülicher, Proc. Natl. Acad. Sci. U. S. A. 107, 20863 (2010).
- Khalilgharibi et al. (2016) N. Khalilgharibi, J. Fouchard, P. Recho, G. Charras, and A. Kabla, Curr. Opin. Cell Biol. 42, 113 (2016).
- Matoz-Fernandez et al. (2017) D. A. Matoz-Fernandez, E. Agoritsas, J.-L. Barrat, E. Bertin, and K. Martens, Phys. Rev. Lett. 118 (2017).
- Phillips and Steinberg (1978) H. Phillips and M. Steinberg, J. Cell Sci. 30, 1 (1978).
- Guevorkian et al. (2010) K. Guevorkian, M.-J. Colbert, M. Durth, S. Dufour, and F. Brochard-Wyart, Phys. Rev. Lett. 104, 218101 (2010).
- Gonzalez-Rodriguez et al. (2013) D. Gonzalez-Rodriguez, L. Bonnemay, J. Elgeti, S. Dufour, D. Cuvelier, and F. Brochard-Wyart, Soft Matter 9, 2282 (2013).
- LeGoff et al. (2013) L. LeGoff, H. Rouault, and T. Lecuit, Development 140, 4051 (2013).
- Mao et al. (2013) Y. Mao, A. L. Tournier, A. Hoppe, L. Kester, B. J. Thompson, and N. Tapon, The EMBO journal 32, 2790 (2013).
- Pan et al. (2016) Y. Pan, I. Heemskerk, C. Ibar, B. I. Shraiman, and K. D. Irvine, Proc. Natl. Acad. Sci. U.S.A. 113, E6974 (2016).
- Ranft et al. (2014) J. Ranft, M. Aliee, J. Prost, F. Jülicher, and J.-F. Joanny, New J. Phys. 16, 035002 (2014).
- Williamson and Salbreux (2017) J. J. Williamson and G. Salbreux, (2017).
- Bissell and Hines (2011) M. J. Bissell and W. C. Hines, Nat. Med. 17, 320 (2011).
- Harach et al. (1985) H. R. Harach, K. O. Franssila, and V. M. Wasenius, Cancer 56, 531 (1985).
- Weinberg (2007) R. A. Weinberg, The biology of cancer (Garland Publishing, Inc., 2007).
- Alberts et al. (1994) Alberts, Bray, Johnson, Lewis, Raff, Roberts, and Watson, Molecular Biology of the Cell, 3rd edition (Garland Publishing, Inc., 1994).
- Jülich Supercomputing Centre (2018) Jülich Supercomputing Centre, Journal of large-scale research facilities 4 (2018).