Nonlinear optics with full three-dimensional illumination
Abstract
We investigate the nonlinear optical process of third-harmonic generation in the thus far unexplored regime of focusing the pump light from a full solid angle, where the nonlinear process is dominantly driven by a standing dipole-wave. We elucidate the influence of the focal volume and the pump intensity on the number of frequency-tripled photons by varying the solid angle from which the pump light is focused, finding good agreement between the experiments and numerical calculations. As a consequence of focusing the pump light to volumes much smaller than a wavelength cubed the Gouy phase does not limit the yield of frequency-converted photons. This is in stark contrast to the paraxial regime. We believe that our findings are generic to many other nonlinear optical processes when the pump light is focused from a full solid angle.
I Introduction
The first multi-photon process was described by Göppert-Mayer when calculating the spontaneous decay of the state of the hydrogen atom Göppert-Mayer (1931). But it took until the invention of the laser and the first investigation of second-harmonic generation by Franken and coworkers in 1961 Franken et al. (1961) before the field of nonlinear optics took off. Since then most of the experiments have been performed in the paraxial regime with mildly focused Gaussian beams, cf. Fig. 1a. One can find only a few reports on experiments where the pump light driving the nonlinear process has been focused such that the paraxial approximation is not valid Yew and Sheppard (2007); Biss and Brown (2003); Reichenbach et al. (2014); Horneber et al. (2015); Wang et al. (2016). These investigations treated second-harmonic generation at an interface Yew and Sheppard (2007); Biss and Brown (2003) or measured the nonlinear optical response of nano particles Reichenbach et al. (2014); Horneber et al. (2015); Wang et al. (2016). In a wider sense, also multi-photon-excitation microscopy Zipfel et al. (2003) and stimulated-emission depletion microscopy (STED) Westphal and Hell (2005) can be considered as nonlinear optics under non-paraxial conditions when using microscope objectives with large enough numerical aperture (NA) as depicted in Fig. 1b. There is even one report on STED in a 4Pi-microscopy setup using two microscope objectives Dyba and Hell (2002), which however is still far away from full solid angle focusing. Investigations in isotropic nonlinear media under clearly non-paraxial conditions are lacking.
Here, we investigate the nonlinear response under close to full-solid-angle focusing, when the transmitted beam interferes with the incoming beam to form a standing wave (cf. Fig. 1c). Such a wave is a superposition of a converging (inward moving) and a diverging (outward moving) dipole wave Basset (1986); Cohen-Tannoudji et al. (1989). In this standing wave with a spherical phase front the wave vector of the pump naturally averages to zero, while the broad spread of wave vectors has implications on the phase matching of the nonlinear optical process, as we will discuss later. This is unlike the standing wave in a cavity, where the wave vectors are typically confined within a small cone. Furthermore, the focal volume within a standing dipole-wave is much smaller than a wavelength cubed Bokor and Davidson (2008); Gonoskov et al. (2012). This is a new experimental regime in which no nonlinear optics experiments have been conducted so far. We perform such an experiment in studying a paradigmatic process, third-harmonic generation (THG) in an isotropic homogeneous medium (argon gas).

To focus the pump light from a full solid angle we use a parabolic mirror (PM) with a focal length much shorter than its depth. The PM is illuminated with a mode that after reflection off the PM surface resembles the radiation pattern of a linear electric dipole Lindlein et al. (2007).
Under such conditions, several questions as posed below arise. In
order to address these questions, we briefly recall some essential
features of THG with Gaussian beams in the paraxial regime (see
e.g. Ref. Boyd (2008)): When the nonlinear medium is
longer than twice the Rayleigh length of the Gaussian beam and the
beam waist is located in the middle of the medium, the nonlinear
polarization induced in the interaction region before the beam waist
is 180 degree out of phase with the one generated in the diverging
beam behind the beam waist due to the Gouy phase. Under conditions of
nominal phase matching this results in destructive interference of the
light fields generated in these two distinct half spaces. One can
only compensate for the Gouy phase when choosing a nonlinear medium
with a positive phase mismatch. Hence, in normally dispersive media
such as noble gases driven far from resonance, where the phase
mismatch is always negative, THG by four-wave mixing (FWM)
∗∗∗∗\ast\ast∗∗∗∗\ast\astBy THG through FWM,
we mean the process
. is not expected to occur (see e.g. section 2.10.3 in
Ref. Boyd (2008)). Thus, the generation of
frequency-tripled photons can occur only as the result of higher-order
processes, and accordingly the observed power dependence is not of
third order (see e.g. Refs.
Ganeev et al. (2006, 2000); Marcus et al. (1999); Malcuit et al. (1990); L’Huillier et al. (1988); Ganeev et al. (1986); Vaičaitis et al. (2009, 2013)).
When focusing from a full solid angle with a dipole-like radiation pattern, the full width at half maximum of the spatial intensity distribution in the focus is on the order of the wavelength of the pump light or smaller. Consequently, the field amplitude of the pump light varies from practically zero to its maximum value within a wavelength and strictly violates the slowly-varying-amplitude approximation that is inherent to the paraxial approximation. Phase matching in the paraxial regime is equivalent to velocity matching such that the phase relation between pump, signal and idler is preserved. In the regime with light propagating in all directions this concept no longer makes sense. It will even turn out that over the relevant length scale of the focal pump field distribution the phase of the pump varies so weakly that it practically can be neglected.
Therefore, one can ask the general questions: “What determines the efficiency of the nonlinear coupling in this extreme case?”, “Which predictions of the paraxial approximation are still valid in the regime of extreme focusing” and “If one observes THG under this experimental condition, how will the third-harmonic signal scale with pump power and with the solid angle used for focusing?”
In this paper, we give answers to these questions. In Sec. II we describe our experimental apparatus and present the experimental results. As we will show, one indeed observes the generation of frequency-tripled photons when focusing from a large fraction of the full solid angle. Based on our observations, we identify six-wave mixing (SWM) as the underlying process, somewhat resembling other experiments in the paraxial regime Ganeev et al. (2000); Vaičaitis et al. (2009, 2013). Guided by this finding we compare our experimental observations to numerical simulations. In the last section, we discuss our results and draw some further conclusions.
II Experiment
II.1 Experimental setup
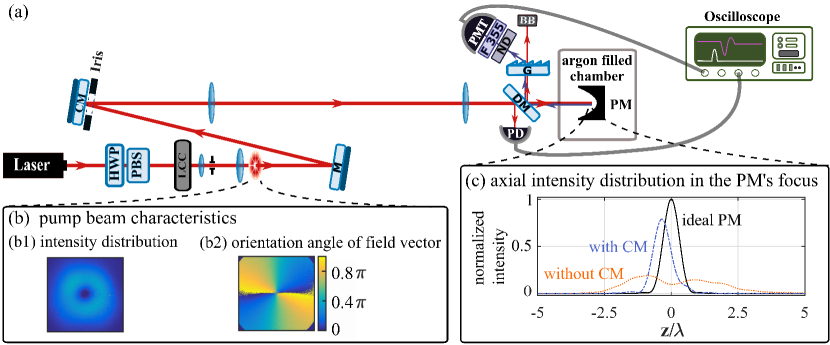
Figure 2 shows a simplified scheme of our experimental setup. A pulsed Nd:YAG laser is used as the light source for the fundamental beam. This laser has a wavelength of 1064 nm, a pulse duration of 2 ns, a repetition rate of 50 Hz and a pulse energy of up to 1 mJ. The beam power is adjusted by means of a half-wave-plate and a polarizing beam-splitter. The pump beam is transformed to a radially polarized doughnut beam by passing the fundamental Gaussian beam through a liquid-crystal polarization-converter (ARCoptix, RADPOL). Unwanted modes present in the beam leaving the polarization-converter are rejected by means of a spatial filter. Fig. 2b shows the intensity distribution and the orientation-angle of the local polarization vector of the resulting beam, both determined by a spatially resolved measurement of the Stokes parameters Schaefer et al. (2007). This mode has an overlap with the optimum mode for generating a linear dipole-wave in excess of 90%.
The pump beam is aligned to the PM by using two mirrors such that the beam propagates along the optical axis of the PM. The PM is made of aluminum and manufactured by single-point precision diamond-turning (Kugler GmbH, Germany). The focal length is and the diameter of the exit PM’s pupil is 20 mm. In addition, the PM exhibits a bore hole of 1.5 mm diameter at its vertex. The PM is placed inside a vacuum chamber which is first evacuated to the order of mbar and then filled with argon gas. The PM exhibits deviations from a perfect parabolic shape, introducing significant aberrations. The aberrations are characterized by interferometric measurements Leuchs et al. (2008). Based on the results of these measurements, a compensation mirror (CM) was manufactured which nominally imprints a wavefront modulation onto the incident beam that is conjugate to the one imprinted by the aberrations of the PM. The actual wavefront imprinted by the CM is also determined by interferometry. The CM serves as one of the alignment mirrors mentioned above (cf. Fig. 2a). In order to avoid changes to the imprinted wavefront occurring upon propagation, the electric field distribution emerging from the CM is imaged 1:1 onto the entrance aperture of the PM by means of a telescope.
We have assessed the impact of the PM’s aberrations and the degree of aberration compensation by the CM by simulating the focal intensity distribution for various cases exploiting all available interferometric data; see Fig.2c. In comparison to an aberration-free mirror, the PM alone exhibits a Strehl ratio of only 19%, i.e., the maximum intensity in the focal region is about five times below that observed for diffraction-limited focusing. However, the simulations predict that by using the CM the Strehl ratio can be improved to 79%. This imperfect compensation is due to the fact that the CM does not apply exactly the targeted phase distribution.
In the experiments presented below, we investigate the generation of TH photons using different solid angles for focusing. This variation is achieved by aperturing the pump beam with an iris of adjustable size. The iris is positioned close to the CM and is thus likewise imaged onto the PM aperture with the same telescope that is used for imaging the CM. By using the relation Lindlein et al. (2007) one can compute the effective half-opening angle for a given iris radius . is then used for calculating the solid angle used for focusing.
Because a strongly focused, radially polarized doughnut beam produces an electric field distribution that closely resembles that of a linear dipole oscillating along the optical axis of the focusing device Quabis et al. (2000), here we define the solid angle as the one obtained when weighted with the angular intensity emission pattern of a linear dipole: . Using this definition, has an upper limit of when and Sondermann et al. (2008). The specific geometry of our PM corresponds to = 20∘ and 134∘. Therefore, the maximum weighted solid angle covered by our PM is .
Frequency-tripled photons generated in the focal region are collimated by the PM and afterwards reflected by a dichroic mirror (DM). The same DM directs a small fraction of the incident pump pulses onto a photodiode (PD). The PD signal serves as a trigger for detecting the frequency-tripled beam. To suppress any remaining pump light in the detection path for the frequency-tripled photons, a grating (G) separates this light from the frequency-tripled beam. The pump beam is finally dumped at a beam block (BB). The frequency-tripled beam is detected by a photomultiplier tube (PMT, Hamamatsu R11540) after passing through a 355 nm laser line filter and neutral density (ND) filters. The PMT cannot distinguish between pulses with different photon numbers. It rather responds nonlinearly to pulses with more than one photon. Therefore, the ND filters are chosen such that they attenuate the frequency-tripled beam to an average photon number per pulse smaller than unity. In all experiments, the detected average photon-number per pulse is obtained from a series of about 2500-3000 laser pulses focused by the PM. Accounting for the attenuation factors of the used ND filters and other optical losses (in total ), we finally calculate the average number of frequency-tripled photons generated in the focal region of the PM.
II.2 Experimental results
At first, we check whether the generation of frequency-tripled photons under strongly non-paraxial conditions is observed at all. We monitor the number of photons detected at a wavelength of 355 nm while varying the diameter of the iris limiting the beam size from 7 mm to 20 mm. These diameters correspond to solid angles . The smallest solid angle investigated here corresponds to a half-opening angle of 80∘ or a NA of 0.98, respectively. Hence, all measurements are carried out under strongly non-paraxial conditions. For each iris diameter, the laser power is adjusted such that the power transmitted through the iris is the same.
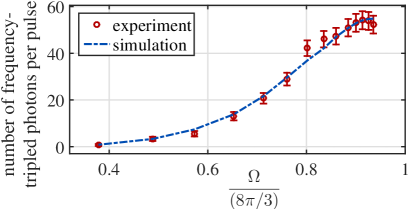
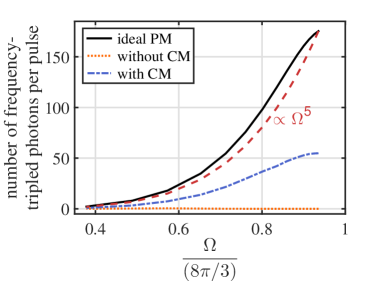
As is evident from Fig. 3, we indeed observe the generation of frequency-tripled photons. As one increases the solid angle used for focusing, one observes a higher yield of frequency-tripled photons. The number of frequency-tripled photons per pulse is affected by an interplay between the focal intensity and the focal volume as the main nonlinear interaction region, as discussed below. To investigate the generation of frequency-tripled photons in more detail and to unveil the mechanism of the frequency conversion, we measure the number of generated photons as a function of the peak power of the fundamental beam. Fig. 4 shows the results for two cases of focusing from and from of the full solid angle. A linear fit to the data in a double-logarithmic representation produces a line with a slope of approximately 5 in both cases. Thus, the number of the generated frequency-tripled photons scales with the fifth power of the optical power of the fundamental beam.
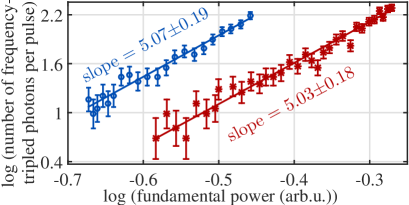
This result answers one of the questions posed above: Under strongly non-paraxial conditions, frequency-tripled photons are not generated by a simple FWM process. In the paraxial regime, dependences of the frequency-tripled photon number on the pump power with orders ranging from 3.5 to 5 have been reported Ganeev et al. (2006, 2000); Marcus et al. (1999); Malcuit et al. (1990); L’Huillier et al. (1988); Ganeev et al. (1986); Vaičaitis et al. (2009, 2013). Possible explanations for this fifth-order dependence include a SWM process Ganeev et al. (2000); Vaičaitis et al. (2009, 2013) and FWM with phase matching achieved by by a Kerr effect Ganeev et al. (1986); Malcuit et al. (1990); Ganeev et al. (2006). However, our investigations exclude THG by FWM with phase matching enabled by the Kerr effect. As explained in detail in Appendix A, this conclusion results from the fact that for argon gas and the pump beam powers used in our experiment a positive phase mismatch cannot be achieved via the Kerr effect.
Therefore, as done elsewhere for several experiments in the paraxial regime Ganeev et al. (2000); Vaičaitis et al. (2009, 2013), we attribute the generation of frequency-tripled photons in our experiments to SWM: The argon atoms absorb four photons at frequency and emit two photons, one of them with frequency and the other one with frequency . Unlike for THG with focused light, frequency-tripled generation through SWM is possible for both positive and negative phase mismatch Kutzner and Zacharias (1998). In either case, in SWM one can compensate for the phase mismatch by suitable off-axis wave vectors (see also Ref. Vaičaitis et al. (2009)). When focusing from large fractions of the solid angle, a broad spread of such wave vectors is readily provided.
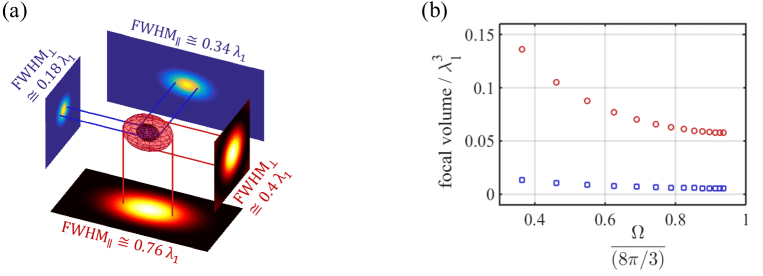
Having identified the dependence of the THG on pump power, we now discuss the dependence of THG on solid angle in more detail: The intensity in the focus of the PM is proportional to the solid angle Sondermann et al. (2008). Therefore, for a SWM process as found here one would expect the TH signal to scale with . However, the experimental data underlying Fig. 3 reveal a slightly weaker dependence (). This dependence results from the fact that with increasing solid angle the focal volume decreases (see simulations in Fig. B.2 of App. B). The decrease of focal volume is weaker than the increase of the peak intensity in the focal region, resulting in the observed increase of TH photons when focusing from a larger solid angle.
Building upon these arguments, we simulate frequency-tripled photon generation, modeling the response of the medium with a fifth-order susceptibility. The detail of our theoretical simulation is explained in App. B.
In Fig. 3 we directly compare the simulation results to the experimental data. To within the experimental uncertainties we find a good qualitative agreement between simulation and experiment. By fitting the simulation results to the experiment we obtain as the only fit parameter. This value is of the same order of magnitude as the value reported for the case of fifth harmonic generation in Ref. Li et al. (1989) and therefore appears to be reasonable. The main uncertainty of the fitting procedure is given by the accuracy of the pump power measurements, which is about 5%. Furthermore, in implementing our model numerically we made several approximations, cf. App. C, which might influence the uncertainty of the value obtained for . Nevertheless, we conclude that our model yields a good agreement with the experimental results.
III Discussion and conclusions
In the introduction of this paper we have raised several questions on potential differences between harmonic generation in the paraxial regime and when focusing the pump light from full solid angle.
Indeed, also in the latter case one observes the generation of frequency-tripled photons in an isotropic medium with normal dispersion. As in the paraxial regime, one does not observe a third-order dependence of the frequency-converted photons on pump power as expected for a FWM process. Rather, we have found a fifth-order dependence which hints at SWM as the underlying process.
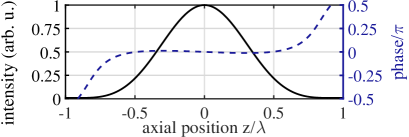
What is the origin of the suppression of the FWM contribution to THG when focusing from a full solid angle? The tempting answer might be that the Gouy phase has the same detrimental effects as in the paraxial regime. And indeed, the standing spherical waves that are generated by focusing from a full solid angle exhibit the Gouy phase, i.e. a phase shift relative to a running spherical wave that emerges from the focus Tyc (2012). But being defined in such a way, the Gouy phase does not reflect the total phase at a certain position in the focal region. As our simulations reveal, the spatial variation of the phase of the pump field in the relevant focal region is not strong enough to result in a complete suppression of a FWM signal. As shown in Fig. 5, the intensity distribution of the pump light decays more quickly towards zero than the phase of the pump field changes by . This is clearly different from what is found for a focused Gaussian beam in the paraxial regime, for which a phase distribution as the one displayed in Fig. 5 can only be found when choosing an unphysical beam waist. The latter would correspond to a lateral width-at-half-maximum that is smaller than the minimal one obtainable in free space Gonoskov et al. (2012).
Another possible reason for the suppression of FWM is found when discussing wave vector diagrams (e.g. Refs. Vaičaitis et al. (2009); Boyd (2008)): For a FWM process in a normally dispersive medium, there is no combination of three wave vectors of the fundamental beam that results in a wave vector of the TH light. The wave vector mismatch is smallest for collinear wave vectors. In the experiment performed here, the strong focusing of the fundamental beam induces a large spread of the directions of the corresponding wave vectors. This large spread results in larger wave vector mismatches than in the paraxial regime. Hence the FWM process is suppressed even more strongly. Contrarily, for the SWM process focusing from full solid angle provides many possible combinations in which five wave vectors of the fundamental beam can be matched to a wave vector of the TH light. We thus conclude that SWM is the lowest-order process that can generate frequency-tripled photons in the case of very tight focusing.
Although we investigated the influence of full-solid-angle focusing on a specific nonlinear optical process, our findings – especially the ones about the role of the Gouy phase – are valid for all nonlinear optical processes, in particular to those of higher order. Furthermore, collecting the generated photons over a full solid angle minimizes losses and facilitates the investigation of the spatial properties of many phenomena in nonlinear optics.
Acknowledgments
The authors thank K. Mantel for the characterization of the compensation mirror and M. Bader for discussions. GL acknowledges financial support from the European Research Council (ERC) via the Advanced Grant ’PACART’. RWB acknowledges support through the Natural Sciences and Engineering Research Council of Canada and the Canada Research Chairs program.
References
- Göppert-Mayer (1931) M. Göppert-Mayer, Annalen der Physik 401, 273 (1931).
- Franken et al. (1961) P. A. Franken, A. E. Hill, C. W. Peters, and G. Weinreich, Phys. Rev. Lett. 7, 118 (1961).
- Yew and Sheppard (2007) E. Yew and C. Sheppard, Optics Communications 275, 453 (2007).
- Biss and Brown (2003) D. P. Biss and T. G. Brown, Opt. Lett. 28, 923 (2003).
- Reichenbach et al. (2014) P. Reichenbach, A. Horneber, D. A. Gollmer, A. Hille, J. Mihaljevic, C. Schäfer, D. P. Kern, A. J. Meixner, D. Zhang, M. Fleischer, et al., Optics express 22, 15484 (2014).
- Horneber et al. (2015) A. Horneber, K. Braun, J. Rogalski, P. Leiderer, A. J. Meixner, and D. Zhang, Physical Chemistry Chemical Physics 17, 21288 (2015).
- Wang et al. (2016) X. Wang, X. Zhuang, F. Wackenhut, Y. Li, A. Pan, and A. J. Meixner, Laser & Photonics Reviews 10, 835 (2016).
- Zipfel et al. (2003) W. R. Zipfel, R. M. Williams, and W. W. Webb, Nature Biotechnology 21, 1369 (2003).
- Westphal and Hell (2005) V. Westphal and S. W. Hell, Phys. Rev. Lett. 94, 143903 (2005).
- Dyba and Hell (2002) M. Dyba and S. W. Hell, Physical Review Letters 88, 163901 (2002).
- Basset (1986) I. M. Basset, Journal of Modern Optics 33, 279 (1986).
- Cohen-Tannoudji et al. (1989) C. Cohen-Tannoudji, J. Dupont-Roc, and G. Grynberg, Photons and atoms (J. Wiley and Sons, 1989).
- Bokor and Davidson (2008) N. Bokor and N. Davidson, Opt. Commun. 281, 5499 (2008).
- Gonoskov et al. (2012) I. Gonoskov, A. Aiello, S. Heugel, and G. Leuchs, Phys. Rev. A 86, 053836 (2012).
- Lindlein et al. (2007) N. Lindlein, R. Maiwald, H. Konermann, M. Sondermann, U. Peschel, and G. Leuchs, Laser Physics 17, 927 (2007).
- Boyd (2008) R. W. Boyd, Nonlinear optics, 3rd (Academic press, 2008).
- Ganeev et al. (2006) R. A. Ganeev, M. Suzuki, M. Baba, H. Kuroda, and I. A. Kulagin, Applied Optics 45, 748 (2006).
- Ganeev et al. (2000) R. Ganeev, S. R. Kamalov, M. Kodirov, M. Malikov, A. Ryasnyansky, R. Tugushev, S. U. Umidullaev, and T. Usmanov, Optics Communications 184, 305 (2000).
- Marcus et al. (1999) G. Marcus, A. Zigler, and Z. Henis, JOSA B 16, 792 (1999).
- Malcuit et al. (1990) M. S. Malcuit, R. W. Boyd, W. V. Davis, and K. Rzaewski, Physical Review A 41, 3822 (1990).
- L’Huillier et al. (1988) A. L’Huillier, L. Lompre, M. Ferray, X. Li, G. Mainfray, and C. Manus, EPL (Europhysics Letters) 5, 601 (1988).
- Ganeev et al. (1986) R. Ganeev, V. Gorbushin, I. Kulagin, and T. Usmanov, Applied Physics B: Lasers and Optics 41, 69 (1986).
- Vaičaitis et al. (2009) V. Vaičaitis, V. Jarutis, and D. Pentaris, Physical Review Letters 103, 103901 (2009).
- Vaičaitis et al. (2013) V. Vaičaitis, V. Jarutis, K. Steponkevičius, and A. Stabinis, Physical Review A 87, 063825 (2013).
- Schaefer et al. (2007) B. Schaefer, E. Collett, R. Smyth, D. Barrett, and B. Fraher, American Journal of Physics 75, 163 (2007).
- Leuchs et al. (2008) G. Leuchs, K. Mantel, A. Berger, H. Konermann, M. Sondermann, U. Peschel, N. Lindlein, and J. Schwider, Applied optics 47, 5570 (2008).
- Quabis et al. (2000) S. Quabis, R. Dorn, M. Eberler, O. Glöckl, and G. Leuchs, Opt. Commun. 179, 1 (2000).
- Sondermann et al. (2008) M. Sondermann, N. Lindlein, and G. Leuchs, arXiv preprint arXiv:0811.2098 (2008).
- Kutzner and Zacharias (1998) J. Kutzner and H. Zacharias, Applied Physics B: Lasers and Optics 66, 571 (1998).
- Li et al. (1989) X. F. Li, A. L’Huillier, M. Ferray, L. A. Lompré, and G. Mainfray, Phys. Rev. A 39, 5751 (1989).
- Tyc (2012) T. Tyc, Opt. Lett. 37, 924 (2012).
- Polyanskiy (2018) M. N. Polyanskiy, “Refractive index database,” https://refractiveindex.info (2018), [Accessed on 2018-08-23].
- Jackson (1999) J. D. Jackson, Classical Electrodynamics, 3rd ed. (Wiley, New York, 1999).
- Richards and Wolf (1959) B. Richards and E. Wolf, in Proceedings of the Royal Society of London A, Vol. 253 (The Royal Society, 1959) pp. 358–379.
- Alber et al. (2017) L. Alber, M. Fischer, M. Bader, K. Mantel, M. Sondermann, and G. Leuchs, Journal of the European Optical Society-Rapid Publications 13, 14 (2017), arXiv:1609.06884 .
Appendix A Influence of four-wave mixing and Kerr effect
It is well known that THG by FWM with light focused such that the beam waist lies in the middle of the interaction region is possible only if the phase mismatch, , is positive Boyd (2008). Here, is the wave number of the fundamental beam and is the wave number of the TH beam. In normal dispersive media (such as argon driven by 1064 nm light), with increasing frequency the refractive index increases and is negative, where is the wavelength of the fundamental beam and and are the linear refractive indices for the fundamental beam and TH beam, respectively. Thus, THG by FWM is not possible in the normal dispersive media.
If THG is influenced by the Kerr effect, the phase mismatch will become a function of intensity and nonlinear refractive indices as
| (1) |
with and denoting the nonlinear refractive indices for fundamental and TH beam. is the intensity of the fundamental beam. The nonlinear refractive index for a single intense fundamental beam with angular frequency is given by Boyd (2008)
| (2) |
where is the vacuum permittivity, is the speed of light in vacuum and is the third-order nonlinear susceptibility. The nonlinear refractive index for a weak frequency-tripled beam with angular frequency in a medium influenced by an intense fundamental beam with angular frequency is Boyd (2008)
| (3) |
Since the detuning of the pump as well as of the TH wave with respect to the lowest excited state of argon has the same sign, and have the same sign, too. Obviously, then the same holds true for and .
From Eq. (2) and Eq. (3) we conclude that
| (4) |
According to Eq. (1), to get a positive and hence the possibility of THG for focused light, two conditions should be fulfilled. The first condition is
| (5) |
and the second condition reads
| (6) |
We cannot check the first condition quantitatively, because, to the best of our knowledge, the value of for a strong beam at 1064 nm and a weak beam at 355 nm has not been reported. If is sufficiently smaller than such that the first condition is not fulfilled, then THG by FWM will not be possible. However, assuming that is greater than and knowing that , the first condition given by Eq. 5 is fulfilled. With this assumption, we check the second condition, setting which is the case at which the intensity needed to achieve the condition given by Eq. 6 is minimum.
Considering the linear refractive indices of argon at 1064 nm and 355 nm Polyanskiy (2018), we calculate . For the fundamental beam at 1064 nm, the third-order nonlinear susceptibility of argon gas is Li et al. (1989). The maximum intensity which we reach just before the breakdown threshold in argon gas is about . Our experimental measurements are always done below the breakdown threshold. Setting to the intensity at the breakdown threshold and using Eq. (2) to calculate the nonlinear refractive index, we conclude that which is more than an order of magnitude smaller than . The difference would be even more pronounced when , since then would be even smaller. Therefore, even assuming most favorable conditions Eq. 6 cannot be fulfilled. Thus we conclude that the generation of frequency-tripled photons in our experiment is not the result of THG by FWM, even when phase matching is influenced by the Kerr effect.
Appendix B Theoretical considerations
In what follows, we model the generation of frequency-tripled photons in the focus of a parabolic mirror.
The electric field of the incident focused beam induces a nonlinear polarization in the focal region of the PM. The contribution of the nonlinear polarization relevant for generating frequency-tripled photons is . In section II.2 we have argued that SWM is the responsible process for the generation of photons with frequency . Hence, we write
| (7) | ||||
where the factor 5 is the degeneracy factor, is the fifth-order nonlinear susceptibility and is the electric field of the focused fundamental beam. is the position of the geometrical focus of the PM.
Because is a dipole-moment density, the dipole moment oscillating at that is induced in a volume element is given by
| (8) |
In our simulations we associate with the volume of a unit cell of the simulation grid. The light emitted by each dipole is collected by the parabolic mirror and propagates towards the detector. The detected signal is given by the interference of all these fields, with the amplitude of the field emerging from being proportional to . We anticipate this interference process by introducing an effective dipole moment
| (9) |
where the are real weighting factors that account for the projection onto a detection mode (see App. C for a discussion on the influence of the spatial separation of the dipole moments onto the overall signal).
The total power that is radiated at frequency by the dipole moment amounts to (Jackson, 1999, Eq. 9.24)
| (10) |
The medium is excited with pulses of Gaussian envelope of FWHM . Accounting for the observed 5-order dependence of the THG photons on excitation power, the duration of the THG pulse is . Therefore, the number of frequency-tripled photons per pulse becomes
| (11) |
where is the energy of a frequency-tripled photon. Combining Eqs. (8) to (11) we arrive at
| (12) |
The complex electric field in the focal region of the PM is calculated by using the Debye integral method Richards and Wolf (1959). By integrating over complex fields we explicitly account for the spatial variation of the phase of . In our calculations we take into account the measured aberrations of our PM, the measured phase-front induced by the CM as well as the field distribution of the radially polarized doughnut mode. All aberrations are modeled as relative phases of the electric field distribution incident onto the PM. The pulse energy and duration are the same as in the experiment underlying Fig. 3.
For the nonlinear susceptibility there is – to the best of our knowledge – no value reported in literature that was obtained in a comparable experimental setting, i.e. the generation of the TH of 1064 nm light by SWM. Ref. Li et al. (1989) reports for generating the fifth harmonic of 1064 nm light, whereas some values have been determined for SWM processes involving (deep) ultraviolet light, see Ref. Kutzner and Zacharias (1998) and references therein. Therefore, we here use as a fit parameter with which we quantitatively match the outcome of the simulations to the experimental results.
Fig. B.1 shows the result of simulating the generation of frequency-tripled photons as a function of the solid angle used for focusing. We consider three cases, as shown in Fig B.1.
In the first case, we model a PM without any aberrations, i.e. at the diffraction limit. The number of photons at frequency grows monotonically with increasing solid angle. This result can intuitively be understood from the fact that the focal intensity of the pump beam scales linearly with the solid angle Sondermann et al. (2008). One would thus expect the conversion efficiency of an -th order process to scale with solid angle as . However, our simulation results do not show this dependence. We attribute this different result to the complicated spatial distribution of in the focal region: for increasing solid angle, the maximum intensity of the pump field in the focal region grows with . However, the focal volume shrinks when increasing the solid angle (see simulations in Fig. B.2). Also the spatial distribution of the phase of changes upon varying . All these effects result in the behavior observed in the simulation.
As a second case, we model the PM used in the experiments without any aberration compensation, the number of generated frequency-tripled photons is very low at each investigated solid angle, cf. Fig. B.1. The maximum of photons per pulse occurs at a solid angle of . That is, the steady increase of the photon number for increasing is no longer observed. The latter observation can be explained by the spatial distribution of the aberrations over the surface of the PM. Similar effects are also observed for other parabolic mirrors Alber et al. (2017). Such aberrations appear to be typical for deep parabolic mirrors, and seem to represent the current state of the art.
Finally, as a third case we calculate the number of frequency-tripled photons for the case of compensating the aberrations of the PM with a CM, cf. Sec. II. This case is used to fit the simulations to the experimental results with as the only fit parameter. The simulation yields a steady increase of the photon number with increasing solid angle. Despite some saturation behavior at solid angle fractions beyond 90%, the results for the combination PM+CM shows qualitative similarities with the diffraction-limited case. However, the absolute photon numbers are considerably smaller than in the diffraction limited case. This latter observation is readily explained by the still non-optimum aberration compensation, which is expressed through a Strehl ratio of 79%. In the case of a nonlinear optical process as investigated here, the influence of a non-unit Strehl ratio should exponentiate to the order of the nonlinear process. For the largest solid angle used for focusing and for a fifth-order process, the simulation results approximately exhibit this behavior.
Appendix C Collecting third-harmonic signals from spatially separated dipoles
In typical nonlinear optics experiments the light generated in a wave-mixing process is collected from an extended spatial region. This necessitates the account of the relative phases of the electric fields generated at different positions when calculating the total power that is generated in the nonlinear process. There are two contributions to the relative phases. One stems from the relative phase of the local pump field, which determines the phase of the nonlinear polarization. This contribution is directly included in our simulations, cf. Eq. 12. The second contribution is determined by the optical path-length difference (OPD) from the different source dipoles in the nonlinear medium to the point of detection. We now discuss how to account for this contribution in our particular scenario.
Whereas the OPD is readily defined in an experiment in which the detection occurs only under a small solid angle, the situation is more complicated when collecting light over the full solid angle. For two sources separated by a distance the OPD to a point of observation lying on a circle with radius is given by
| (13) |
with the angle to some reference direction. Thus, there is no unique OPD that is valid along all of the directions defined by the wave vectors of the dipolar emission of two separated sources. Moreover, the OPD is zero when averaging over .
However, when collecting light over the entire solid angle with a deep PM as in this work, the position of the light source determines the phase front of the mode that is reflected off the parabolic surface. These phase fronts can be expressed in terms of misalignment functionals, which in general have to be calculated numerically by ray tracing Leuchs et al. (2008). For the experimental scenario treated here, we can make some simplifying assumptions that lead to analytic expressions.
First, the focused pump field is predominantly polarized parallel to the optical axis of the PM. Thus the nonlinear polarization and consequently all induced dipole moments oscillating at are oriented along this direction. Since the extent of the focus is on the order of a wavelength or even smaller, we assume that the intensity distribution of the emission of all these dipoles is the same as the one for a dipole located at the geometric focus of the mirror. After collimation by the PM and ignoring an overall amplitude factor this intensity distribution reads Lindlein et al. (2007)
| (14) |
with the PM focal length and the distance of a point in the aperture plane of the PM to the optical axis.
Second, the simulations of the focal intensity distribution of the pump light (cf. Sec. B) reveal that the electric field is effectively concentrated in a narrow region along the optical axis of the PM. Since we observe that the generation of frequency-tripled photons is proportional to the fifth order of the pump power, we examine the distribution of . We find that the half-width at half-maximum of this distribution in lateral direction is about for using the full mirror. In the axial direction the width is slightly larger. For somewhat smaller solid angles, as was the case in our measurements, the focal field distribution elongates along the optical axis while the lateral extent is practically constant. We therefore infer that the phase fronts of the TH light collected by the PM are mainly influenced by the axial position of the emitters and that phase front distortions due to lateral displacements can be neglected. Identifying in Eq. 13 with the emission angle of the dipole radiation pattern, the optical path-length difference of the emission from a dipole after collimation by the PM can be written as
| (15) |
where is the axial displacement of the induced dipole from the PM focus.
For calculating the interference of the fields emitted by all dipoles in the focal region, we project each field distribution on a detection mode. We take the detection mode to be the field distribution that is emitted by the largest dipole moment. This dipole is located where the amplitude of the pump field is maximum, the corresponding axial coordinate is . Then, the overlap of the emission from dipole with the detection mode reads
| (16) |
with the integration performed over the entire aperture of the PM. This is the factor employed in the calculation of the number of frequency-tripled photons in Eq. 12 in the main part.