The origin of the vanadium dioxide transition entropy
Abstract
The reversible metal-insulator transition in VO2 at K has been closely scrutinized yet its thermodynamic origin remains ambiguous. We discuss the origin of the transition entropy by calculating the electron and phonon contributions at using density functional theory. The vibration frequencies are obtained from harmonic phonon calculations, with the soft modes that are imaginary at zero temperature renormalized to real values at using experimental information from diffuse x-ray scattering at high-symmetry wavevectors. Gaussian Process Regression is used to infer the transformed frequencies for wavevectors across the whole Brillouin zone, and in turn compute the finite temperature phonon partition function to predict transition thermodynamics. Using this method, we predict the phase transition in VO2 is driven five to one by phonon entropy over electronic entropy, and predict a total transition entropy that accounts for % of the calorimetric value.
The first-order phase transition in VO2 occurs at a temperature of , and is coupled to defect concentration,Manning2004a ; Netsianda2008 ; Tan2012 ; Piccirillo2008 ; Jin1998 ; Warwick2014 strain field,Tselev2010 ; Merced2013 ; Transition1970 , electric field and optical fluence.OCallahan2015a ; Chudnovskiy2002 ; Cavalleri2001 The transition has been studied since Klemm and Grimm in the 1930’s,Klemm1939 Cook in the 40’s,Cook1947a and in detail by Morin in 1959.Morin1959 Fundamental questions on the nature of the transition have been debated for decades,E1975 ; Paquet1980 ; Eguchi2008 ; Wentzcovitch1994 and continue to be researched.Zheng2015 ; Biermann2005 ; Wall2018 The transition occurs most notedly in temperature so understanding the thermodynamic origin is a point of basic importance.
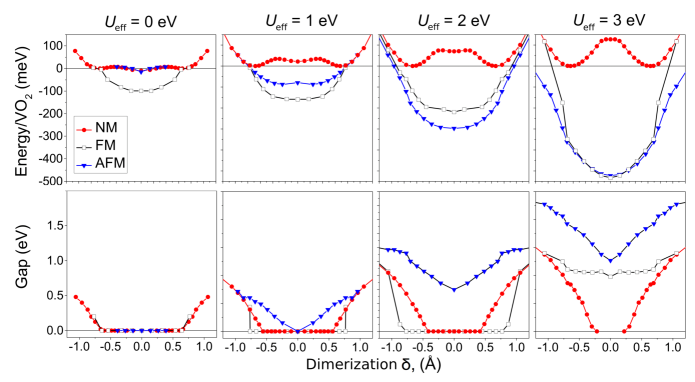
In this study we use density functional theory (DFT) to predict the origin of the VO2 transition entropy. The applicability of DFT to describe the transition metal oxide class of solids depends sensitively on technical details.grau2013examining ; Xiao2014 We use non-spin-polarized calculations based on the PBE exchange correlation functional,Perdew1996 with on-site Coulomb correction eV.Dudarev1998 As shown in Fig. 1, this approach leads to agreement with experiment on the following important points:
-
1.
Electronic structure – the high-symmetry metallic R phase is appropriately gapless. Band gap is opened smoothly with V-V dimerization, resulting in a semiconducting monoclinic (M1) phase.
-
2.
Transition enthalpy – the low-temperature M1 phase is energetically favored over the high-temperature R phase.energyNote
-
3.
Mechanical stability – the low-symmetry M1 phase is stable against distortion and the high-symmetry R phase is unstable in K DFT simulation.
Including spin polarization is shown in Fig. 1 to lower the DFT energy of R-VO2 with respect to the non-magnetic solution, destroying agreement with experiment for the points listed above. The problems related with spin polarization in the DFT description of VO2 have been discussed before,Grau-Crespo2012 and have been resolved fully only in the context of Quantum Monte Carlo simulations,Zheng2015 which are too computationally expensive to use to investigate lattice dynamics. We therefore take the pragmatic approach employed by other authors of using non-magnetic calculations,Eyert2011 on the basis on agreement with experiment.
For the M1 phase, the Born-Oppenheimer surface is convex about equilibrium coordinates. The harmonic approximation to the interatomic potential is appropriate for small displacements, and is expected to be adequate for M1-VO2 up to . On the other hand the high-symmetry R phase has negative second-order force constants which qualitatively invalidate free energy predictions at the harmonic level. Approaches to remedy this that include anharmonic effects have become more accessible thanks to recent developments,Duff2015 ; Hickel2011 ; Hellman2013 ; Zhou2014 ; Prentice2017 ; Monserrat2013 enabling the description of systems with light atoms, at ultra-high temperatures, or near phase transitions, yet widespread application of first principles anharmonic thermodynamics remains limited due to computational cost and complexity. In this work we present a simple, experimentally-motivated approach to compute the thermodynamics of temperature-stabilised imaginary modes in VO2. The method is low-cost and applicable generally to the DFT thermodynamics of high-temperature phases that are unstable at zero temperature.
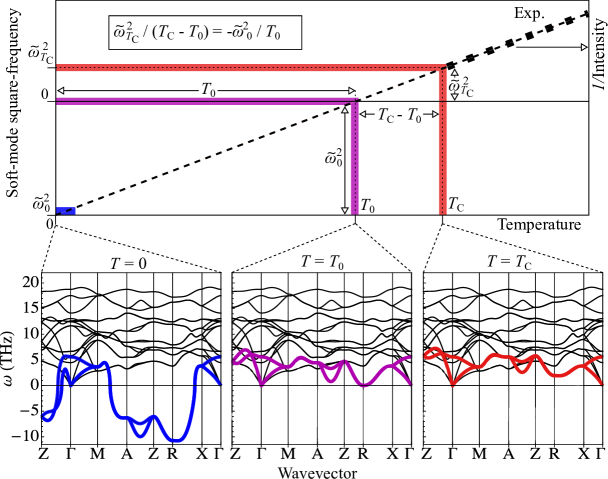
In the soft mode theory of Cochran and in Landau phenomenological approaches,Cochran1959 ; Cochran1961 ; Cochran1981 ; Landau1980 a square-root temperature dependence is identified for transition parameters. The squared-frequency of a mode that softens near the transition at wavevector is expected to decrease linearly with temperature towards a first-order solid-state transition:CochranFRS1973
| (1) |
In VO2 this proportionality has been observed in experimental measurements.Terauchi1978 For example, Cohen and Terauchi report a linear temperature response from diffuse x-ray scattering measurements at with which is represented in the left axis in Fig. 2. The temperature , when , has a value of , and corresponds to the classical second-order transition temperature. Along with the first-order transition temperature , Eqn. 1 relates the phonon frequency at 0 K, , to the frequency at the transition temperature as
| (2) |
Here the shifted frequency is equal to the harmonic frequency that is calculated with DFT. The application of the transformation of imaginary harmonic DFT frequencies at K to real frequencies at is shown in Fig. 2. The method gives values for the temperature-stabilised frequencies at negligible additional cost to standard harmonic DFT calculations, provided the coefficients and are known, which is commonly the case as shown by the experimental data reviewed by Cochran and Cowley.CochranFRS1973 ; Landau1980
To implement the frequency shifts for R-VO2, the transition modes which are shown in Fig. 2 to be imaginary at and in , are renormalized to following the prescription described in the previous paragraph. At other R-VO2 wavevetors (see Brillouin zone geometry, Fig. 3, Appendix), the frequencies do not soften to imaginary harmonic frequencies. For example, in Fig. 2 the , , and wavevectors in have real harmonic frequencies at K. The frequencies in that do not soften are modelled using the DFT harmonic frequencies .
In order to make thermodynamic predictions for a high-temperature phase we need to sample the transformed modes finely across the Brillouin zone, not only at the limited high-symmetry -points in the and regions described. To obtain , the partial knowledge we already have of the frequencies transformed to is found to be sufficient data for machine learning techniques to interpolate to arbitrary phonon wavevectors. is inferred at all irreducible Brillouin zone wavevectors using Gaussian Process Regression (GPR),rasmussen2006gaussian enabling the partition function of the R-VO2 vibrational system to be specified at . GPR accuracy benchmarks and technical details are provided in Appendix IV.
To understand the source of entropy driving the transition, we compute at . is the DFT harmonic vibrational entropy of M1-VO2, and for R-VO2 the entropy is calculated as with consecutive terms from electrons, the harmonic phonon entropy, and the soft-mode phonon entropy from the two experimentally-renormalized transition modes. Thermodynamic calculation details are provided in Appendix III.
The total transition entropy we predict for VO2 is kB/VO2. The commonly referenced calorimetric value is kB/VO2.Ber1969 Our predicted value of kB/VO2 accounts for 95 % of the calorimetric value. The predicted value is composed of the contributions and kB/VO2. The source of entropy driving the transition is therefore phonons over electrons at a ratio of almost five to one.
In Table 1 our entropy predictions are compared to 13 historically reported values from the literature. The values range widely, from to kB/VO2 and to kB/VO2. Among the range of predictions, our conclusions align most closely with those of Budai et al.,Budai2014a with which we agree that the transition thermodynamics are mostly due to phonons. One difference is that Budai et al.Budai2014a compute a phonon entropy of kB/VO2 compared to kB/VO2 here. Their value is based on eV calculations, whereas this work uses eV DFT, to ensure a qualitatively correct description of the electron band gap, transition enthalpy, and R-point lattice instability. (Note, the sensitivity of is less than 1 % per 0.1 eV of about the appropriate value of eV, but the eV description has qualitatively incorrect features.) A second difference with the results of Budai et al.Budai2014a concerns their reported ’best’ predictions, which use a phonon entropy estimate from scattering measurements, which is kB/VO2, compared to our value of kB/VO2. Consequently the error with respect to the total calorimetric valueBer1969 of kB/VO2 is kB/VO2 here, rather than kB/VO2.Budai2014a
A controversial point that merits discussion is the possibility of a spin contribution to the transition entropy. Quantum Monte Carlo calculations have predicted that the R phase, which in nature only exists above , would be spin ordered at K.Zheng2015 On this basis Xia and Chen suggest a spin contribution to the transition entropy.Xia2017a Accounting for a coincident spin disordering at in our predictions increases the entropy value by kB/VO2 to kB/VO2, which exceeds the experimental value of kB/VO2. If a spin contribution to the transition entropy exists, must be considerably lower for to remain consistent with . Considering the neutron scattering measurements by Budai et al. we are inclined to believe this is unlikely.Budai2014a The neutron measured phonon density of states (DOS) can be used to estimate a phonon entropy of kB/VO2 (Table 1), which is similar to our predicted value of kB/VO2, and insufficiently small to accommodate the full spin term. We therefore consider that a fully disordered Heisenberg spin contribution to the transition unlikely. In order to confirm or refute inferences based on our experimentally-renormalized DFT thermodynamics and the neutron scattering measurements of Budai et al.Budai2014a , we propose a simple experiment to measure in the presence of a strong magnetic field. If there is a spin contribution to the entropy, it should vanish in the presence of the magnetic field, which will bring the value of significantly up. If there is no magnetic entropy involved in the transition, should not change or change very little in the presence of the field.
| Source | Method | Entropy contributions | |||
|---|---|---|---|---|---|
| Klemm and Grimm,Klemm1939 1939 | Calorimetry measurements | - | - | - | 1.2 |
| CookCook1947a , 1947 | Calorimetry measurements | - | - | - | 1.50 |
| KawakuboKawakubo1965 , 1964 | Calorimetry measurements | - | - | - | 1.1 |
| RyderBer1969 , 1969 | Calorimetry measurements | - | - | - | ∗ |
| Berglund et al.Ber1969 , 1969 | Analysis of Ryder’s heat capacity measurements | 1.25 | 0.25 | - | ∗ |
| PaulPaul1970 , 1970 | Parabolic band model calc. | - | 0.15 | - | - |
| HearnSearcha , 1972 | 1D model calc. | 1.17 | 0.01 | - | 1.18 |
| Chandrasekhar et al.Chandrasekhar1973 , 1973 | Scanning calorimetry measurements | - | - | - | 1.65 |
| Zylbersztejn and MottE1975 , 1975 | Analysis of magnetic susceptibility measurements | 1.02 | 0.58 | - | 1.6 (1.51)† |
| Pintchovski et al.Pintchovski1978 , 1978 | Calorimetry and electrical resistivity measurements | 0.9 | 0.6 | - | - |
| Maurer et al.Maurer1999 , 1999 | Debye model fitted to sound velocity measurement | 1.35 | - | - | - |
| Budai et al.Budai2014a , 2014 | IXS phonon measurements and DFT electron calc. | 0.27 | - | ||
| Budai et al.Budai2014a , 2014 | DFT ( eV) MD and DFT electron calc. | 0.27 | - | ||
| Xia and ChenXia2017a , 2017 | Compressed sensing DFT phonon and electron calc. | 0.64 | 0.25 | 0.69 | 1.58 |
| This work | Exp.-renormalized DFT phonon and electrons calc. | 1.17 | 0.25 | - | 1.42 |
Conclusion
We have described the source of entropy driving the VO2 metal-insulator transition. Our thermodynamic predictions suggest the transition is driven by phonons over electrons at a ratio of , and that the computed entropy accounts for 95 % of the calorimetric entropy value. In order to make our predictions we have performed DFT harmonic phonon calculations, in conjunction with an experimentally-motivated soft-mode renormalization scheme based on data from x-ray scattering measurements. The scheme has predicted values of soft-mode frequencies at the transition temperature for high-symmetry points in the Brillouin zone of R-VO2. The machine learning interpolation method Gaussian Process Regression was used to infer the soft-mode frequencies across the full Brillouin zone based on the input of frequencies at partial high-symmetry wavevectors. A simple procedure has been proposed to experimentally confirm or refute claims of a spin disorder contribution to the transition entropy.
Acknowledgements.
R.G.C. and T.A.M. acknowledge funding from the UK’s Engineering and Physical Sciences Research Council EPSRC (EP/J001775/1). Via the UK’s HPC Materials Chemistry Consortium, which is funded by EPSRC (EP/L000202), this work made use of ARCHER, the UK’s national high-performance computing services. The research reported in this publication was supported by funding from King Abdullah University of Science and Technology (KAUST). T.A.M is grateful for computational support from the UK Materials and Molecular Modelling Hub, which is partially funded by EPSRC (EP/P020194), for which access was obtained via the UKCP consortium and funded by EPSRC grant ref EP/P022561/1.
References
References
- [1] T. D. Manning and I. P. Parkin. Atmospheric pressure chemical vapour deposition of tungsten doped vanadium (IV) oxide from VOCl3, water and WCl6. J. Mater. Chem, 14:2554, 2004.
- [2] M. Netsianda, P. E. Ngoepe, C. R. A. Catlow, and S. M. Woodley. The displacive phase transition of vanadium dioxide and the effect of doping with tungsten. Chem. Mat., 20:1764, 2008.
- [3] X. Tan, T. Yao, R. Long, Z. Sun, Y. Feng, H. Cheng, X. Yuan, W. Zhang, Q. Liu, C. Wu, Y. Xie, and S. Wei. Unraveling metal insulator transition mechanism of VO2 triggered by tungsten doping. Sci. Rep., 2:466, 2012.
- [4] C. Piccirillo, R. Binions, and I. P. Parkin. Synthesis and characterisation of W doped VO2 by Aerosol Assisted Chemical Vapour Deposition. Thin Solid Films, 516:1992, 2008.
- [5] P. Jin, S. Nakao, and S. Tanemura. Tungsten doping into vanadium dioxide thermochromic films by high-energy ion implantation and thermal annealing. Thin Solid Films, 324:151, 1998.
- [6] M. E. A. Warwick and R. Binions. Advances in thermochromic vanadium dioxide films. J. Mater. Chem. A, 2:3275, 2014.
- [7] A. Tselev, I. A. Lukyanchuk, I. N. Ivanov, J. D. Budai, J. Z. Tischler, E. Strelcov, A. Kolmakov, and S. V. Kalinin. Symmetry relationship and strain induced transitions between insulating M1 and M2 and metallic R phases of vanadium dioxide. Nano Lett., 10:4409, 2010.
- [8] E. Merced, X. Tan, and N. Sepúlveda. Strain energy density of VO2 based microactuators. Sens. Actu. A, 196:30, 2013.
- [9] J. R. Brews. Symmetry Considerations and the Vanadium Dioxide Phase Transition. Phys. Rev. B, 1:2557–, 1970.
- [10] B. T. O’ Callahan, A. C. Jones, J. Hyung Park, D. H. Cobden, J. M. Atkin, and M. B. Raschke. Inhomogeneity of the ultrafast insulator-to-metal transition dynamics of VO2. Nat. Comm., 6:6849, 2015.
- [11] F. Chudnovskiy, S. Luryi, and B. Spivak. Switching device based on first-order metal-insulator transition induced by external electric field. Wiley Interscience, 2002.
- [12] A. Cavalleri, C. S. Tóth, C. Siders, J. Squier, F. Ráksi, P. Forget, and J. Kieffer. Femtosecond Structural Dynamics in VO2 during an Ultrafast Solid-Solid Phase Transition. Phys. Rev. Lett., 87:237401, 2001.
- [13] W. Klemm and L. Grimm. Über die Wärmetönung bei der paramagnetischen Curie-Temperature des Vanadindioxyds. Naturwiss., 27:787, 1939.
- [14] O. A. Cook. High-Temperature Heat Contents of V2O3, V2O, and V2O5. J. Amer. Cer. Soc., 69:331–333, 1947.
- [15] F. J. Morin. Oxides which show a metal to insulator transition at the Néel temperature. Phys. Rev. Lett., 3:34, 1959.
- [16] A. Zylbersztejn and N. F. Mott. Metal insulator transition in vanadium dioxide. Phys. Rev. B, 11:4383, 1975.
- [17] D. Paquet and P. Leroux-Hugon. Electron correlations and electron-lattice interactions in the metal-insulator, ferroelastic transition in VO2: A thermodynamical study. Phys. Rev. B, 22:5284, 1980.
- [18] R. Eguchi, M. Taguchi, M. Matsunami, K. Horiba, K. Yamamoto, Y. Ishida, A. Chainani, Y. Takata, M. Yabashi, D. Miwa, Y. Nishino, K. Tamasaku, T. Ishikawa, Y. Senba, H. Ohashi, Y. Muraoka, Z. Hiroi, and S. Shin. Photoemission evidence for a Mott-Hubbard metal insulator transition in VO2. Phys. Rev. B, 78:075115, 2008.
- [19] R. M. Wentzcovitch, W. W. Schulz, and P. B. Allen. VO2: Peierls or Mott-Hubbard? A view from band theory. Phys. Rev. Lett., 72:3389, 1994.
- [20] H. Zheng and L. K. Wagner. Computation of the Correlated Metal-Insulator Transition in Vanadium Dioxide from First Principles. Phys. Rev. Lett., 114:176401, 2015.
- [21] S. Biermann, A. Poteryaev, A. Liechtenstein, and A. Georges. Dynamical Singlets and Correlation-Assisted Peierls Transition in VO2. Phys. Rev. Lett., 94:026404, 2005.
- [22] S. Wall, S. Yang, L. Vidas, M. Chollet, J. M. Glownia, M. Kozina, T. Katayama, T. Henighan, M. Jiang, T. A. Miller, D. A. Reis, L. A. Boatner, O. Delaire, and M. Trigo. Ultrafast disordering of vanadium dimers in photoexcited VO2. Science, 576:572, 2018.
- [23] R. Grau-Crespo, T. A. Mellan, H. Wang, and U. Schwingenschlögl. Examining the density functional theory description of VO2 above and below the metal-insulator transition. In APS Meeting, 2013.
- [24] B. Xiao, J. Sun, A. Ruzsinszky, and J. P. Perdew. Testing the Jacob’s ladder of density functionals for electronic structure and magnetism of rutile VO2. Phys. Rev. B, 90:085134, 2014.
- [25] J. P. Perdew, K. Burke, and M. Ernzerhof. Generalized Gradient Approximation Made Simple. Phys. Rev. Lett., 77:3865, 1996.
- [26] S. L. Dudarev, G. A. Botton, S.Y. Savrasov, C. J. Humphreys, and A. P. Sutton. Electron-energy-loss spectra and the structural stability of nickel oxide: An LSDA+U study. Phys. Rev. B, 57:1505, 1998.
- [27] The on-site Coulomb interaction could be tuned arbitrarily to reproduce the experimental latent heat of transition of 44 meV/VO2, but such tuning is beyond the scope of this paper.
- [28] R. Grau-Crespo, H. Wang, and U. Schwingenschlögl. Why the Heyd Scuseria Ernzerhof hybrid functional description of VO2 phases is not correct. Phys. Rev. B, 86:081101, 2012.
- [29] V. Eyert. VO2: a novel view from band theory. Phys. Rev. Lett, 107:016401, 2011.
- [30] A. I. Duff, T. Davey, D. Korbmacher, A. Glensk, B. Grabowski, J. Neugebauer, and M. W. Finnis. Improved method of calculating ab initio high-temperature thermodynamic properties with application to ZrC. Phys. Rev. B, 91:214311, 2015.
- [31] T. Hickel, B. Grabowski, and J. Neugebauer. Advancing DFT to finite temperatures: Methods and applications in steel design. Psi-k Scientific Highlight of the month, pages 22–50, 2011.
- [32] O. Hellman, P. Steneteg, I. A. Abrikosov, and S. I. Simak. Temperature dependent effective potential method for accurate free energy calculations of solids. Phys. Rev. B, 87:104111, 2013.
- [33] F. Zhou, W. Nielson, Y. Xia, and V. Ozolin. Lattice anharmonicity and thermal conductivity from compressive sensing of first-principles calculations. Phys. Rev. Lett., 113:185501, 2014.
- [34] J. C. A. Prentice and R. J. Needs. Using forces to accelerate first-principles anharmonic vibrational calculations. Phys. Rev. Mat., 1:023801, 2017.
- [35] B. Monserrat, N. D. Drummond, and R. J. Needs. Anharmonic vibrational properties in periodic systems: energy, electron-phonon coupling, and stress. Phys. Rev. B, 87:144302, 2013.
- [36] H. Terauchi and J. Cohen. Diffuse x-ray scattering due to the lattice instability near the metal-semiconductor transition in VO2. Phys. Rev. B, 17:2494, 1978.
- [37] W. Cochran. Crystal stability and the theory of ferroelectricity. Phys. Rev. Lett., 3:412, 1959.
- [38] W. Cochran. Crystal stability and the theory of ferroelectricity part II . Piezoelectric crystals. Adv. Phys., 10:401–420, 1961.
- [39] W. Cochran. Soft modes, a personal perspective. Ferroelectrics, 35:3, 1981.
- [40] R. A. Cowley. Structural phase transitions. Adv. Phys., 29:1, 1980.
- [41] W. Cochran FRS. The Dynamics of Atoms in Crystals. Edward Arnolds Limited, London, first edition, 1973.
- [42] C. E. Rasmussen and C. K. I. Williams. Gaussian processes for machine learning. 2006. The MIT Press, Cambridge, MA, USA, 2006.
- [43] C. N. Berglund and H. J. Guggenheim. Electronic Properties of VO2 near the Semiconductor-Metal Transition. Phys. Rev., 185:1022, 1969.
- [44] J. D. Budai, J. Hong, M. E. Manley, E. D. Specht, C. W. Li, J. Z. Tischler, D. L. Abernathy, A. H. Said, B. M. Leu, L. A. Boatner, Robert J. McQueeney, and O. Delaire. Metallization of vanadium dioxide driven by large phonon entropy. Nature, 515:535, 2014.
- [45] Y. Xia and M. K. Y. Chan. Renormalized Lattice Dynamics and Thermal Transport in VO2. arXiv, 1711.02819, 2017.
- [46] T. Kawakubo. Crystal Distortion and Electric and Magnetic Transition in VO2. J. Phys. Soc. Jap., 20:516, 1965.
- [47] W. Paul. The present position of theory and experiment for VO2. Mat. Res. Bull., 5:691, 1970.
- [48] C. J. Hearn. Phonon softening and the metal-insulator transition in VO2. J. Phys. C: Sol. Stat. Phys., 5:1317, 1972.
- [49] G. V. Chandrashekhar, H. L. C. Barros, and J. M. Honig. Heat capacity of VO2 single crystals. Mat. Res. Bull., 8:369, 1973.
- [50] F. Pintchovski, W. S. Glaunsinger, and A. Navrotsky. Experimental study of the electronic and lattice contributions to the VO2 transition. J. Phys. Chem. Solids, 39:941, 1978.
- [51] D. Maurer, A. Leue, R. Heichele, and V. Müller. Elastic behavior near the metal-insulator transition of VO2. Phys. Rev. B, 60:249, 1999.
- [52] G. Kresse and J. Furthmüller. Efficient iterative schemes for ab initio total energy calculations using a planewave basis set. Phys. Rev. B, 54:11169, 1996.
- [53] G. Kresse and J. Furthmüller. Efficiency of ab-initio total energy calculations for metals and semiconductors using a plane-wave basis set. Comp. Mat. Sci., 6:15, 1996.
- [54] P. E. Blöchl. Projector augmented-wave method. Phys. Rev. B, 50:17953, 1994.
- [55] G. Kresse and D. Joubert. From ultrasoft pseudopotentials to the projector augmented-wave method. Phys. Rev. B, 59:1758, 1999.
- [56] L. Chaput, A. Togo, I. Tanaka, and G. Hug. Phonon-phonon interactions in transition metals. Phys. Rev. B, 84:094302, 2011.
Appendix
I DFT calculations
Periodic DFT calculations were performed with the Vienna Ab-initio Simulation Package (VASP),[52, 53] using the generalized gradient approximation (GGA) in the form of the Perdew-Burke-Ernzerhof exchange-correlation functional (PBE).[25] The projected augmented wave method was used to describe the interaction between the valence electrons and the core states, which were kept frozen at the atomic references (up to p in V and s in O).[54, 55] Plane waves were cutoff at a kinetic energy of 520 eV, and -points were sampled at a density of divisions per rutile unit cell. Force and energy convergence thresholds were set to eV/Å and eV respectively.
The Coulomb interaction between vanadium d electrons was corrected with an effective on-site term, .[26] The effect of and magnetic ordering was considered for phase enthalpy and band gap. NM eV calculations reproduce the basic characteristics well known from experiment, including instability of the high-symmetry rutile phase at low temperature, and electronic band gap phase opening with V-V dimerization.
II Phonon calculations
Phonons were computed from second-order force constants using the PHONOPY code.[56] The M1 and R phases employ and supercells respectively. Phonon thermodynamics functions were satisfactorily converged at a sampling density equivalent to -point mesh for the rutile conventional unit cell.
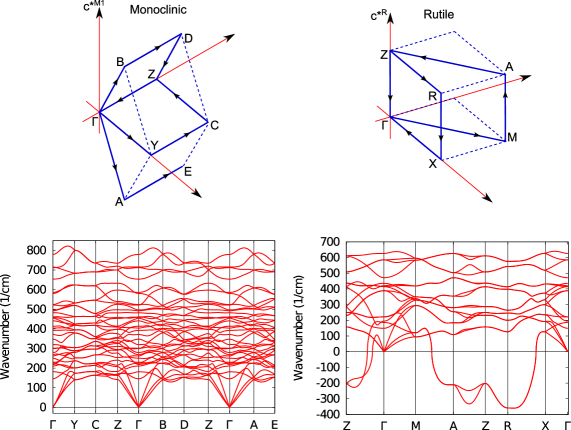
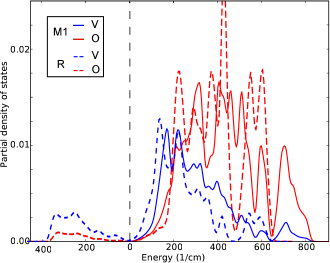
Harmonic DFT phonon dispersion is shown in Fig. 3. The Brillouin zones for M1 and R unit cells are sampled between high symmetry points in reciprocal space. The path for R-VO2 follows the sequence which corresponds to . The path for M1-VO2 is which corresponds to . The phonon densities of states for the M1 and R phases are shown projected by atomic species in Fig. 4. The eigenvectors of the imaginary transition modes are shown to project primarily onto the motion of vanadium atoms.
III Thermodynamics
The phonon entropy difference between the M1 and the R phases is estimated from the harmonic free energy
where is
and partition function is computed using the harmonic geometric series expression
with .
For the M1 phase, entropy is calculated from the standard DFT harmonic frequencies, . For the R phase the same expression is applied to the real harmonic DFT frequencies that don’t soften at the transition, and the two shifted frequencies , for the two imaginary harmonic modes subject to the experimental renormalization to real effective frequencies.
The R phase is metallic. As we are only interested in thermal electron excitations at moderate temperatures we assume , and that electronic entropy of the R phase can be given in terms of partial one-electron occupancies as
The total entropy of M1-VO2 is , and the total entropy for R-VO2 is . is the vibration contribution from the phonon modes that are harmonic at low temperature. is from the dispersion two bands that soften at the transition and is based on the frequencies transformed to .
IV Gaussian Process Regression
Supervised learning has been used to interpolate phonon frequencies using the non-parametric multi-variate Bayesian method Gaussian Process Regression (GPR).[42] GPR models can provide an appropriate alternative to Fourier interpolation, which is otherwise the method of choice when the full dynamical matrix is known. Without knowledge of the dynamical matrix at the transition, GPR models can be used to directly interpolate frequencies in q space from limited experimental data points.
In this work have used GPR for the -space interpolation of the two renormalized soft modes in R-VO2. The mode frequencies at are determined from experiment at limited high-symmetry wavevectors. GPR can be used to predict how varies across the full Brillouin zone, making possible thermodynamic calculations for the high-temperature phase from limited high-temperature data points. To show that the GPR approach is appropriate to predict the full surface from limited data points, we benchmark the accuracy of GPR interpolation on an analytic model.
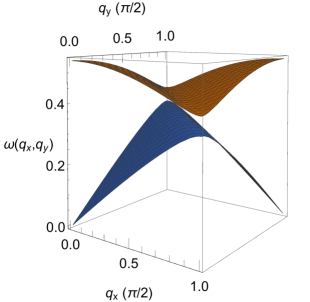
Consider a vanadium-oxygen analytic model with the following dispersion relation
which is shown in Fig. 5. The test system includes features such as optic and acoustic-type dispersion, with frequencies that are non-linear in wavevector in more than one dimension and that have stationary points of inflection. The system is therefore expected to provide meaningful accuracy benchmarks, while also being simple enough to clearly illustrate the method.
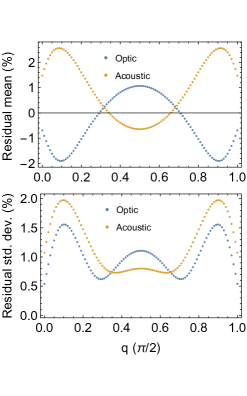
In the test system is sampled by a mesh over . GPR training data is a 1D scan of the mesh of at the line-paths at and at . Root mean square (RMS) residual errors of the interpolated system compared to the true system are % for the acoustic band and % for the optic, with percentages calculated with respect to the maximum frequency value of at . Typically we also know frequency gradients at zone boundaries. For a more realistic test model, derivatives at boundaries are included in the training set. This lowers RMS residual errors across to % and % for the acoustic and optic bands respectively.
In the GPR applied in this work, for the soft modes in R-VO2, an analogous interpolation is made for the two transition bands in . Errors of % for the interpolated R-VO2 soft modes correspond to errors of approximately % or 0.01 kB/VO2 in the transition entropy difference, which is satisfactory within the scope of this work and in context of other sources of error.
To interpolate the R-VO2 soft modes we have used a GPR with a non-deterministic radial basis function kernel of the form
with Bayesian maximum posterior hyper-parameters. Training data includes line-paths between high-symmetry points in the and planes, as well as zone boundary band velocities. GPR training data for soft modes in the plane consists of renormalized harmonic frequencies. These are sampled at 100-points/line for each edge in the cycle . For the plane, in which the transition-mode bands do not soften at the transition, training data consists of 100-points/line samples of the edges in the graph for harmonic frequencies.