Submillimetre dust polarisation and opacity in the HD163296 protoplanetary ring system
Abstract
We present ALMA images of the sub-mm continuum polarisation and spectral index of the protoplanetary ringed disk HD163296. The polarisation fraction at 870 is measured to be 0.9 in the central core and generally increases with radius along the disk major axis. It peaks in the gaps between the dust rings, and the largest value (4) is found between rings 1 and 2. The polarisation vectors are aligned with the disk minor axis in the central core, but become more azimuthal in the gaps, twisting by up to in the gap between rings 1 and 2. These general characteristics are consistent with a model of self-scattered radiation in the ringed structure, without requiring an additional dust alignment mechanism. The 870/1300 dust spectral index exhibits minima in the centre and the inner rings, suggesting these regions have high optical depths. However, further refinement of the dust or the disk model at higher resolution is needed to reproduce simultaneously the observed degree of polarisation and the low spectral index.
keywords:
radio continuum : planetary systems1 Introduction
Images of protoplanetary disks, now being routinely obtained on spatial scales of tens of au, are showing that dust frequently lies in concentric rings (e.g., ALMA Partnership et al., 2015). Polarised emission at mm wavelengths is a way to further constrain both the disk physics and dust properties. Originally regarded as a tracer of non-spherical magnetically-aligned grains, it was later recognized that self-scattering of mm radiation can be important; the polarisation could then inform us about disk geometry, optical depths, and dust geometry (Kataoka et al., 2016a; Yang et al., 2017). In the disk mid-plane, collisions with the gas can suppress magnetic field alignment, although non-spherical grains may still be aligned with the dominant local radiation field through radiative torque (Tazaki et al., 2017). The spatial structure of polarised emission is critical to distinguish these mechanisms, but this requires well-resolved images.
The near-face-on transition disk HD142527 showed predominantly radial polarisation vectors consistent with self-scattering, with some outer regions of azimuthal orientation, possibly from radiatively-aligned grains (Kataoka et al., 2016b). At 3 mm, the more inclined multi-ringed disk of HL Tau showed azimuthal polarisation vectors consistent with radiative alignment (Kataoka et al., 2017). However, at 870 the vectors are more parallel and aligned along the minor axis, suggesting that scattering may dominate. Intermediate wavelengths (1.3 mm) show a mixture of the two components (Stephens et al., 2017). The extended full disk IM Lup also shows vectors aligned more with the minor axis, and was interpreted as scattered emission (Hull et al., 2018). Inclined younger Class 0/I disks also tend to show polarisation vectors aligned with the minor axis (Cox et al., 2018; Lee et al., 2018; Harris et al., 2018). The target for the present study, HD163296, is a well-studied isolated Herbig Ae star, with a bright, extended disk. Lying at a distance of 105pc111Sizes and luminosities in this paper have been revised based on the GAIA DR2 parallax, it is classified as spectral type A2Ve, of age 5Myr (Montesinos et al., 2009). In CO gas, the disk extends to 450au, but appears only half this size when observed in mm dust (de Gregorio-Monsalvo et al., 2013). Detailed fits indicated that the dust lies in rings (Zhang et al., 2016), subsequently confirmed by higher resolution mm observations which showed three concentric structures (Isella et al., 2016). The innermost of these is traced in near-infrared scattered light (Monnier et al., 2017; Muro-Arena et al., 2018). Early sub-mm observations found an upper limit of 1% to the polarisation fraction in a 1 arcsec beam (Hughes et al., 2009). Pinte et al. (2018) and Teague et al. (2018) have also recently found dynamical evidence of massive planets in the system.
In this paper, we present ALMA observations of polarised dust emission of HD163296 at 870m with a resolution of 0.2 - sufficient to resolve the rings. We also combine the intensity images with archival band 6 data to obtain spectral index maps. The results are compared with a self-scattering model including the gaps and rings.
2 Observations
The observations were conducted in sessions on two nights: 23 Jul and 13 Aug 2016, with two consecutive executions of the scheduling block on each night and 35-37 antennas in the array. The polarisation calibrator (J1751+0939) was observed every 30 minutes; J1742-2527 was used as a complex gain calibrator and observed every 7 minutes. J1733-1304 was used as a flux calibrator with assumed fluxes of 1.52 and 1.67 Jy at 343.5 GHz on the two observing nights; J1924-2914 was the bandpass calibrator. Checks showed that the independently calibrated fluxes of both the bandpass and polarisation calibrators agreed with the measured values at that time from the ALMA online calibrator database to better than 5%. The total time on-source was 2 hours, although some 15 minutes of data were flagged in the second session while the target transited close to the zenith.
The system was set up to observe continuum in band 7 at a mean frequency of 343.5GHz, with spectral windows at 336.494, 338.432, 348.494 and 350.494GHz, each having 31.25MHz channel spacing and 2GHz nominal bandwidth, with a total usable bandwidth of 7.5GHz.
The calibrated data from the ALMA pipeline was examined, further flagging applied, and the individual executions were used to create self-calibrated solutions for the antenna phase and amplitude. The polarisation was then calibrated for each day separately, and the self-cal solutions applied. The two sessions were combined and imaged using clean in CASA (McMullin et al., 2007), producing separate images of Stokes I, Q, U and V. These were combined and debiased to give the polarised percentage , where is the noise in the Stokes Q and U images, and the total intensity. To maximise the signal/noise, natural uv weighting was applied, giving a beam of 0.21x0.19 at 81, and resulting in a final rms of 50Jy in the Stokes images.
To obtain the spectral index, we used the total intensity band 7 visibilities together with ALMA archive data taken in 2015 Aug in band 6 (originally published by Isella et al., 2016). Data were combined using the multi-frequency synthesis method (Rau & Cornwell, 2011), which takes into account differences in the detailed uv coverage (although both datasets have a similar resolution, which minimises such effects). A differential pointing offset of -11, -73 mas was measured (and corrected for). This may be partly due to the published stellar proper motion of -8, -39 mas, and partly from ALMA astrometric errors (typically 1/10 of the beam, or 20mas). The resultant combined total intensity and spectral index images were obtained using clean with Briggs robustness=0.5 uv weighting, to give a slightly higher resolution (0.18x0.17), and an rms of 55Jy at an effective central frequency of 291 GHz.
3 Results
3.1 Polarisation
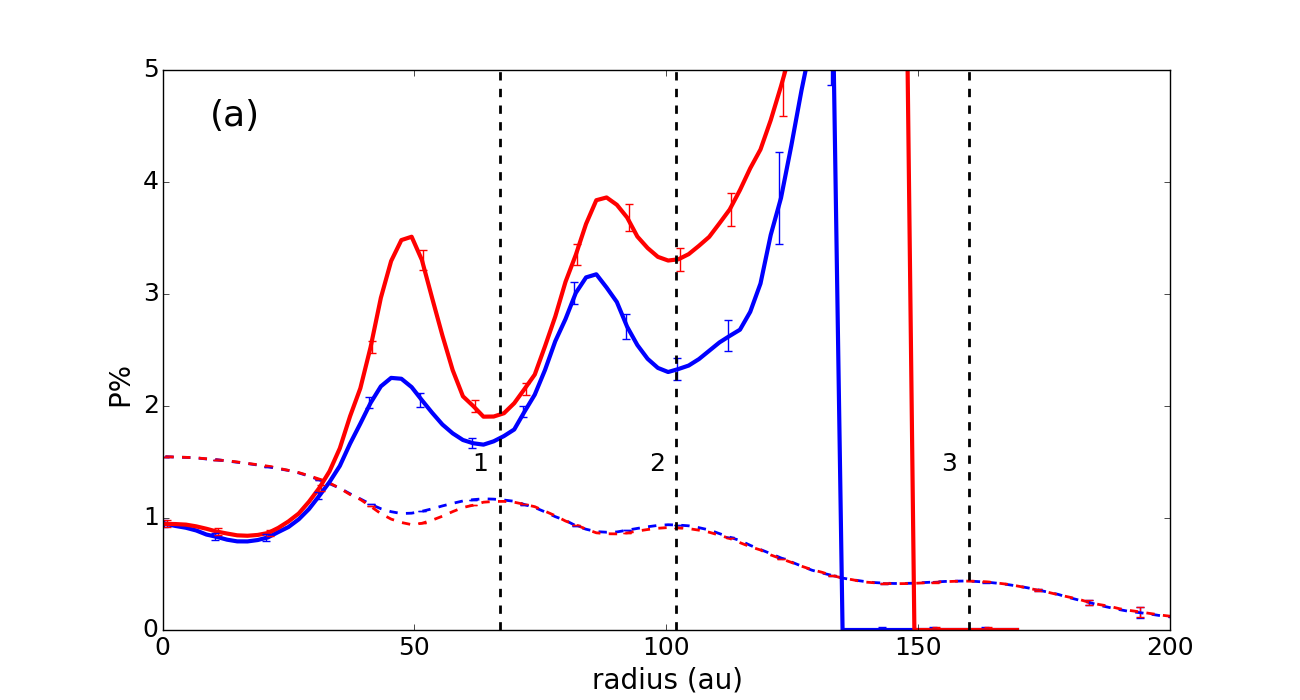
Images of the total intensity and polarisation are shown in Fig.1. These are derived from the individual Stokes datasets (see supplemental online data). The locations of the total intensity rings at radii of 67, 102 and 160 au are illustrated by the three superimposed circles inclined at 45 to the line-of-sight. The percentage polarisation (Fig.1b) ranges from 0.9% in the centre, and increases up to 4% at the edges along the major axis; beyond this the signal/noise of the polarised intensity drops below 5 (see Fig.1c), making the fractional polarisation uncertain. In the gaps between rings along the major axis, particularly between ring 1 and 2, the polarised intensity is relatively high compared with the total intensity, resulting in the regions of high fractional polarisation (shown by lighter shading in Fig.1b). This anticorrelation of polarisation fraction and intensity is illustrated further in the major axis cross-cut in the upper panel of Fig.2. Note that along the minor axis, the polarised flux is comparatively weak and only marginally detected beyond ring 1 (Fig.1c).
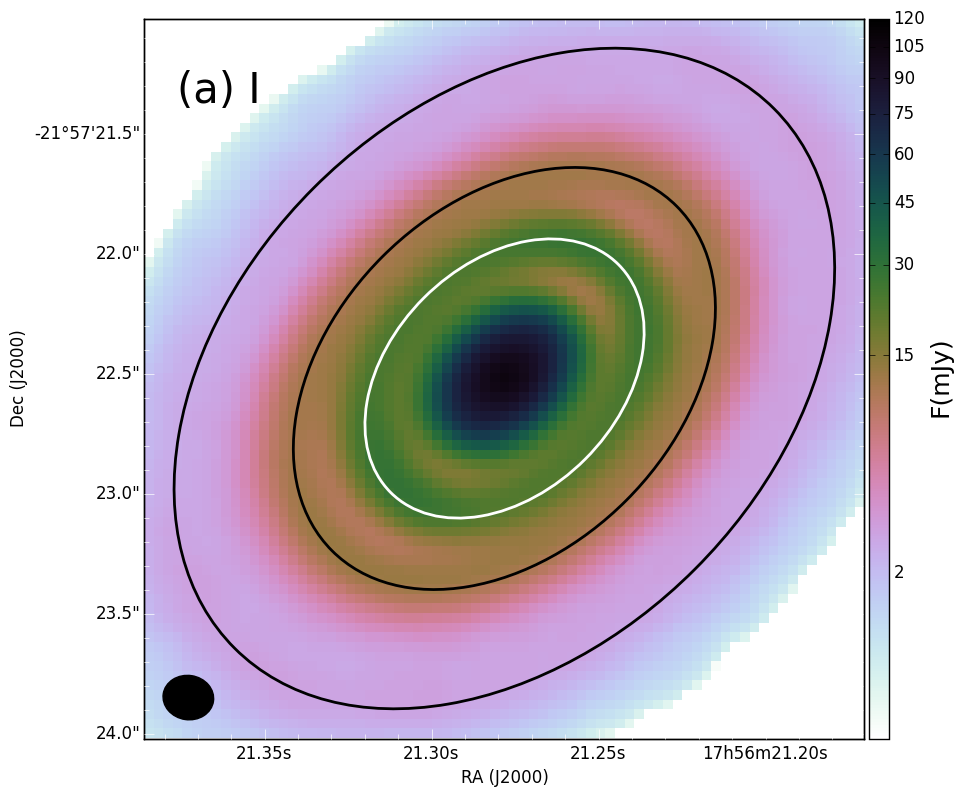
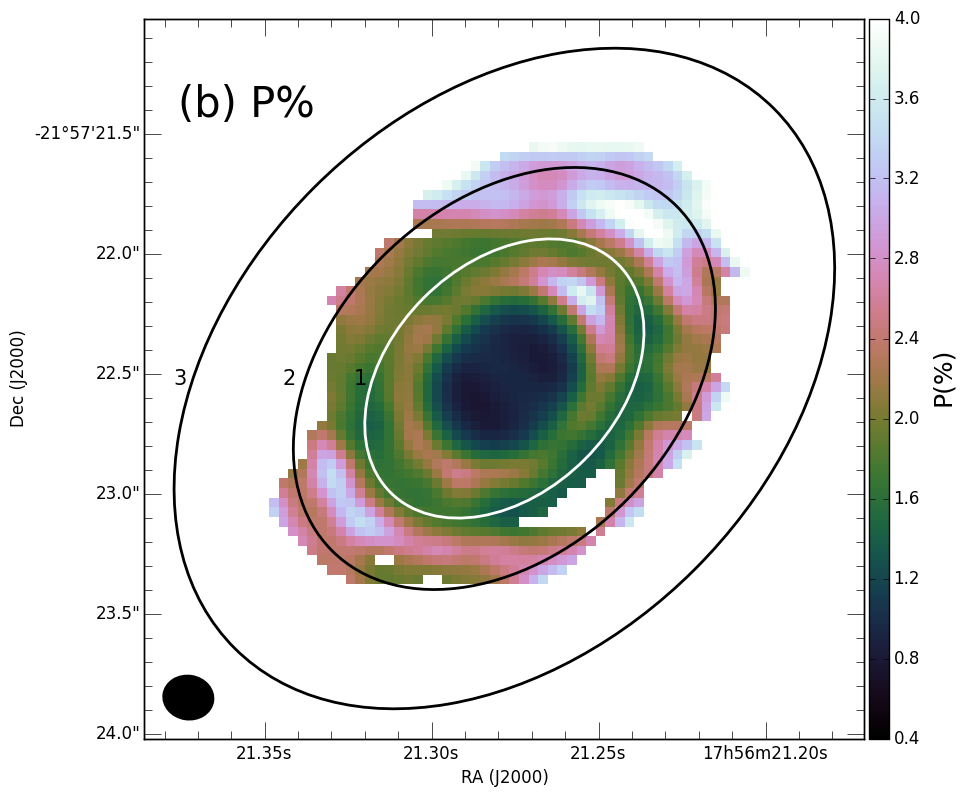
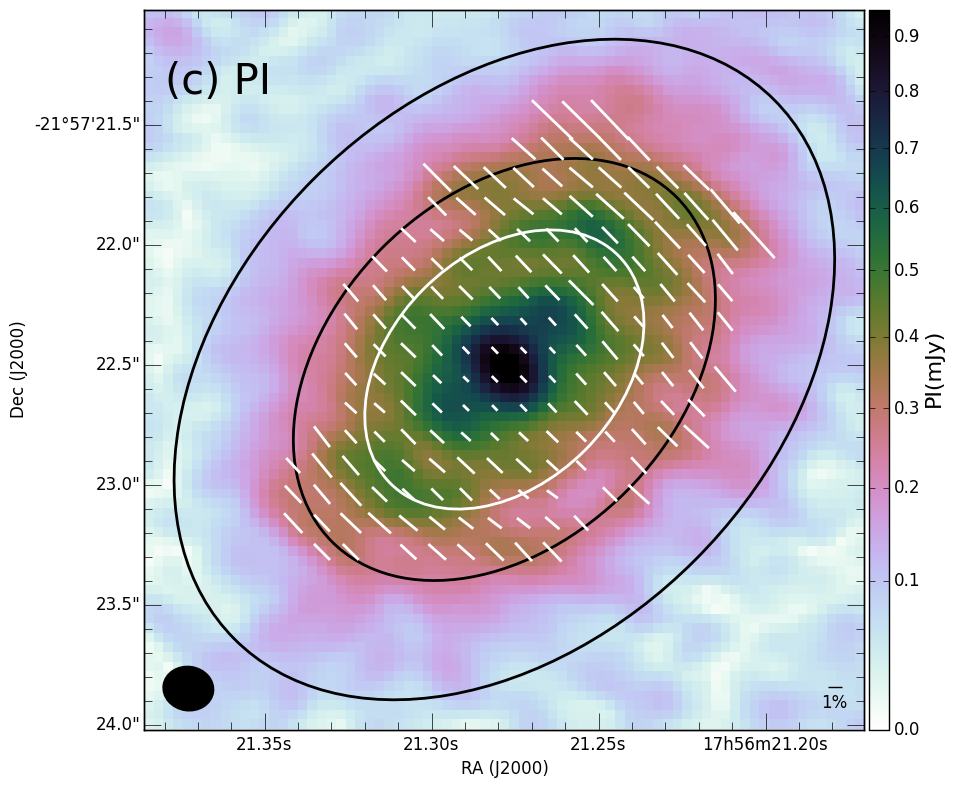
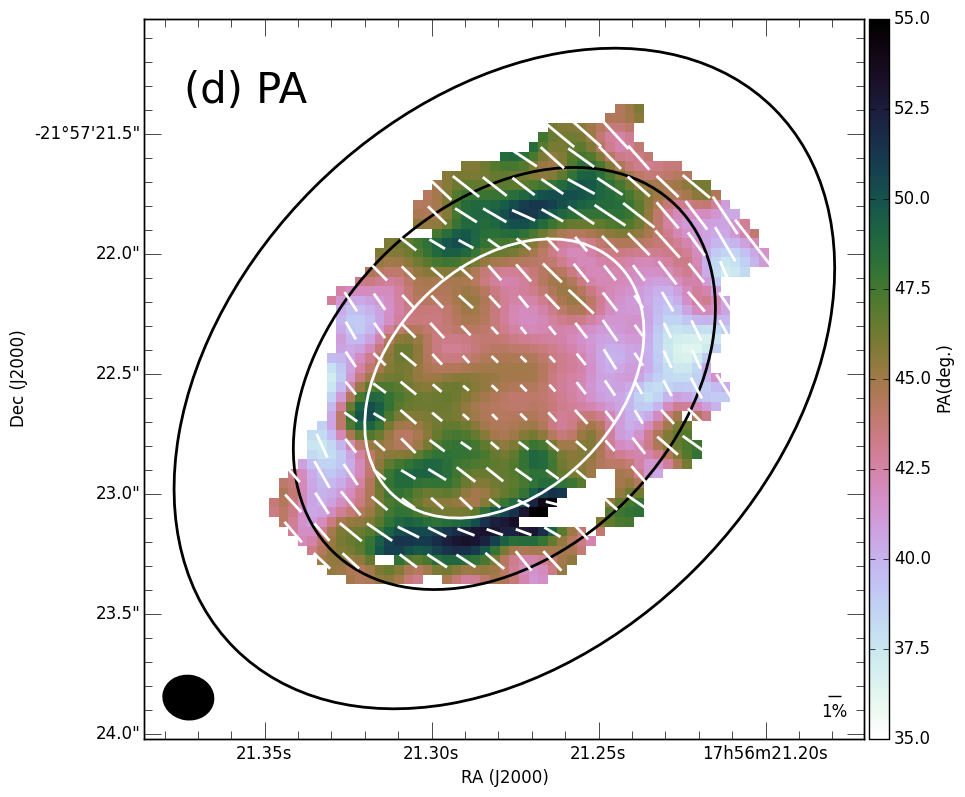
Fig.1c-d show a relatively constant polarisation angle in the central bright region, with a median of 44.1 over the inner 30 au - closely aligned with the disk minor axis. However, there is a twist of up to in the vectors at larger radii, most significant in the intensity gap between ring 1 and 2 (where the fractional polarisation peaks). Here the vectors are more azimuthally aligned; this is more clearly illustrated when the offset in the angle relative to the central polarisation is magnified (see Fig.1d). This azimuthal twist can also be seen at smaller and larger radii in Fig.1d, albeit with a lower magnitude.
3.2 Spectral index
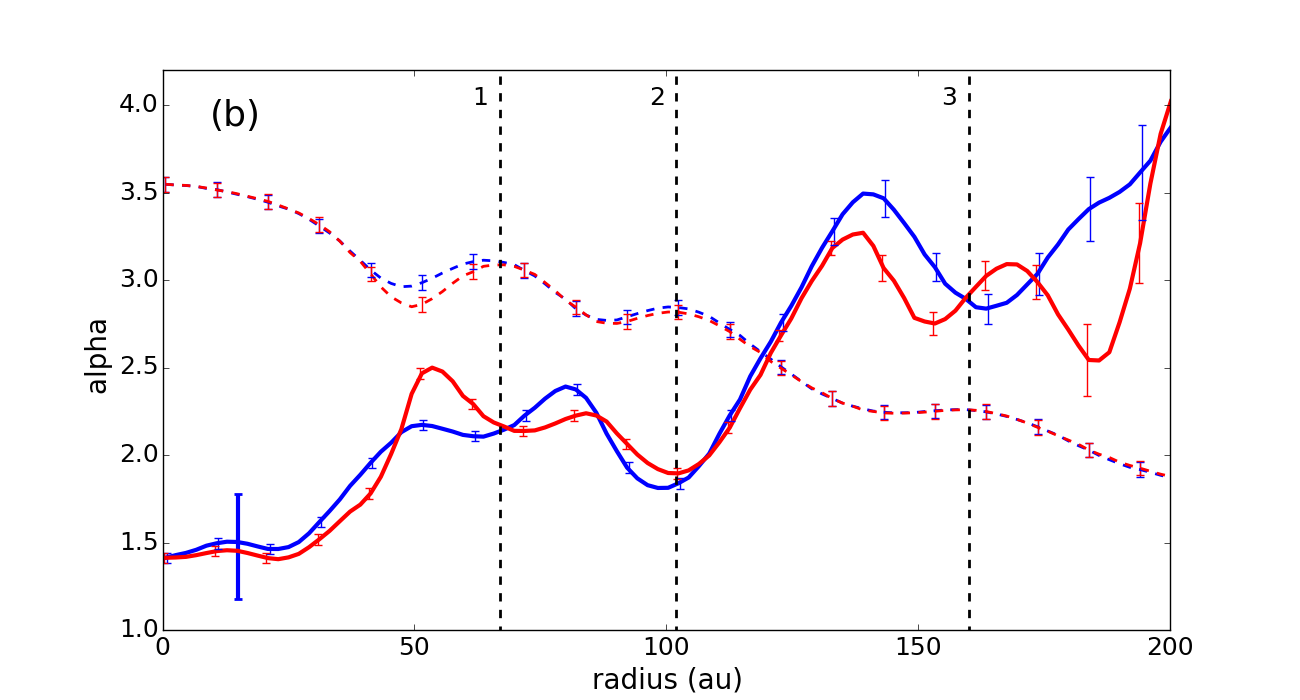
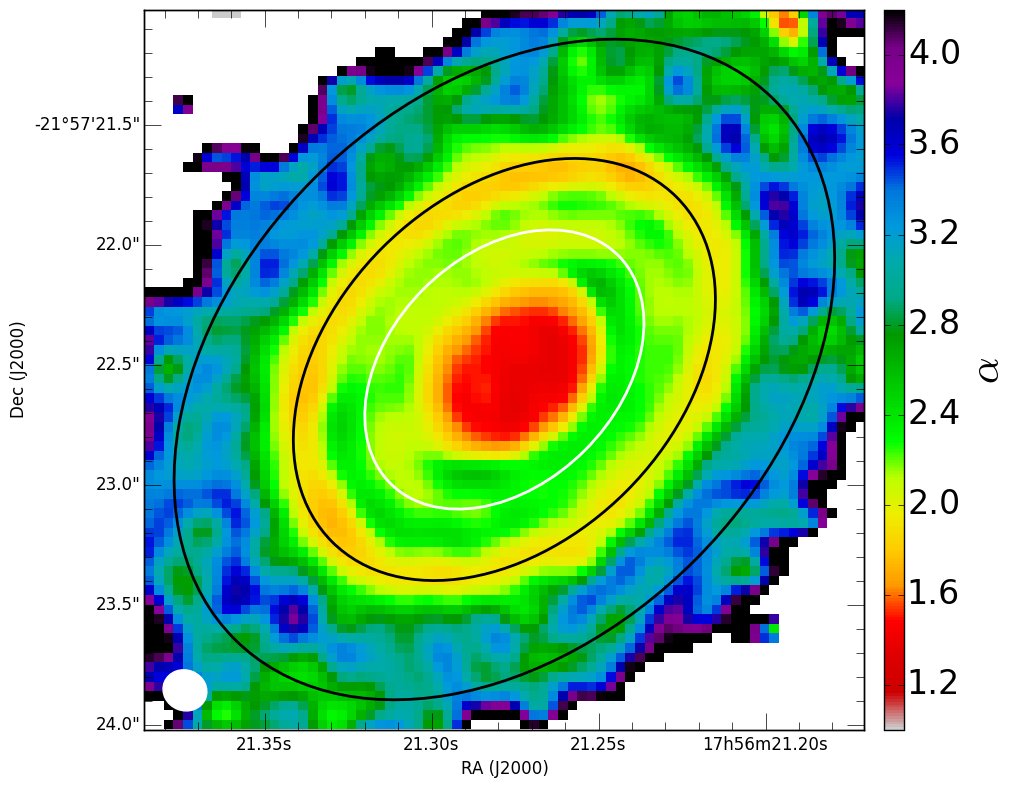
The combined band 6+7 image of the spectral index, , is shown in Fig.3, with a cut along the major axis in Fig.2b. The increase in with radius is consistent with Guidi et al. (2016), but now we can resolve dips in at the ring peaks. These could be due to a local decrease in the dust emissivity slope , or high optical depths in the rings. As their radial width is not resolved, the ring brightness temperature only provides a lower limit to the optical depth, so we cannot discriminate between these possibilities. The rings in HL Tau (ALMA Partnership et al., 2015) and TW Hya (Huang et al., 2018) also show lower , which was associated with high optical depths.
In the central peak of HD163296, is apparently as low as 1.4 - below that of isothermal black body emission in the Rayleigh-Jeans limit (2.0). Contribution from nonthermal emission is considered negligible at these wavelengths (Isella et al., 2007). The relative flux calibrations across each of the images are accurate to , so the profile of in Fig.2b is well-determined. However, there may be an offset that depends on the absolute flux calibration in the two bands. A conservative calibration error is 7%, which would correspond to a spectral index offset of 0.3, illustrated by the large errorbar in Fig.2b. So while the relative shape of in Fig.2b is accurate, the range could change by .
The total disk fluxes are 1.68Jy at band 7 and 0.70Jy at band 6, giving of . This is in reasonable agreement with that measured by Pinilla et al. (2014) (2.7), but suggests an overall offset in , marginally consistent with the formal flux uncertainty. Another possibility could be a decrease in luminosity in the interval between the band 6 and 7 observations. Alternatively a hot core surrounded by cool optically thick dust may also reduce , as proposed for some Class 0 objects (Li et al., 2017). Interestingly, TW Hya also showed in the centre, marginally inconsistent with the calibration accuracy (Huang et al., 2018).
4 Discussion and modeling
The mm-wave polarisation vectors in the central region of HD163296 are aligned within 1.5 of the disk minor axis. This alignment is similar to that seen in IM Lup (Hull et al., 2018), HL Tau at 870m (Stephens et al., 2017) and CW Tau (Bacciotti et al., 2018), and is consistent with self-scattering in an inclined disk (Kataoka et al., 2016a; Yang et al., 2016b). Emission from non-spherical grains aligned either by magnetic or non-isotropic radiation fields can also give measurable mm polarisation, but for inclined disks like HD163296, they do not predict the same vector orientation along the minor axis in the centre (Yang et al., 2016b, 2017). At larger radii and in the gaps between the rings in HD163296, the polarisation fraction increases and the vectors become more azimuthal. Can this also be explained by self-scattering alone?
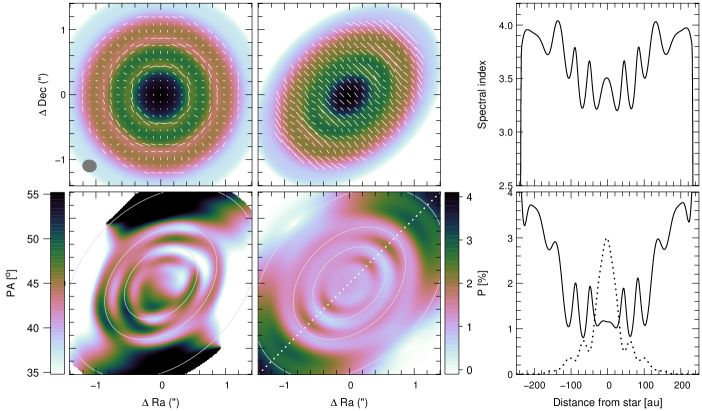
To simulate scattering in a ringed system, we use the radiative transfer code mcfost (Pinte et al., 2006; Pinte et al., 2009), building a disk density model by inverting the intensity image with uniform clean weighting into a surface density profile. We assume a passive disk with a 28 central stellar heating source and a Gaussian scale height of 10 au at 100 au (de Gregorio-Monsalvo et al., 2013). Details are outlined in Pinte et al. (2016) for HL Tau. Spherically symmetric dust grains are used, where the only source of polarisation is scattering (multiple scattering is included). The corresponding Stokes Q and U maps are computed, and then convolved to the observed resolution (Fig. 4).
Polarization by scattering can reproduce the general features observed in the ALMA data. In particular:
-
•
The polarisation is larger along the major axis, i.e., where the scattering angle is closer to 90∘.
-
•
The fractional polarisation is anti-correlated with the intensity, with larger polarization inside the gaps (darker areas in Fig.4, lower centre panel) (Kataoka et al., 2016a).
-
•
The polarization vectors are aligned more with the disk minor axis in the central region and the intensity rings.
-
•
The polarization angle displays a twist in the gaps, becoming more azimuthal (Fig.4, left centre panel).
The twist in polarisation angle in the gaps reflects the change in the scattering geometry and is more easily understood by looking at the same model viewed pole-on (Fig. 4, top left). In the rings, the radiation field is mostly azimuthal, producing a radial polarisation, while in the gaps, the radiation field is mostly radial, originating from the surrounding rings, resulting in an azimuthal polarisation pattern (e.g., Kataoka et al., 2015; Kataoka et al., 2016a; Yang et al., 2016b). The disks around CW Tau (Bacciotti et al., 2018) and GGD27 (Girart et al., 2018) do not (yet) have resolved rings, but both show polarisation alignment along the minor axis in the centre, with a more azimuthal orientation at larger radii. This was interpreted as a change in scattering geometry as the disks become optically thin further out. HD163296 has the same basic geometry, except there are multiple transitions between the optically thicker rings and optically thin gaps.
The polarised intensity is strongly dependent on the chosen grain model, and is affected by a combination of the dust albedo, scattering phase function and polarizability phase function. We calculate dust optical properties using a distribution of hollow spheres (DHS) with a maximum void fraction of 0.8. The model presented in Fig. 4 corresponds to compact astrosilicates (Draine, 2003), with a maximum grain size a 100m, typical of that required to maximise the polarisation (e.g., Kataoka et al., 2015; Kataoka et al., 2016a). This gives 3.5 (larger in the optically-thinner gaps, top right of Fig.4), marginally consistent with HD163296 beyond a radius of . The low at smaller radii may be explained by large (mm-sized) grains, but this is inconsistent with amax from the polarisation (Yang et al., 2016a). This dichotomy may be explained if the inner rings are optically thick but radially unresolved. Alternatively amax may depend on the vertical (or radial) location, with the 100m grains on the surface (or in the gaps) and the mm dust in the midplane (or in the rings). In either case, the scattering geometry would not significantly change. Further dust modeling, together with observations with higher resolution and longer wavelengths may be able to reconcile the low with the observed high polarisation fraction.
Acknowledgements
This paper makes use of the following ALMA data: ADS/JAO.ALMA#2015.0.00616.S and #2013.0.00601.S. ALMA is a partnership of ESO (representing its member states), NSF (USA) and NINS (Japan), together with NRC (Canada), MOST and ASIAA (Taiwan), and KASI (Republic of Korea), in cooperation with the Republic of Chile. The Joint ALMA Observatory is operated by ESO, AUI/NRAO and NAOJ. NRAO is a facility of the NSF operated under cooperative agreement by AUI. CP acknowledges funding from the Australian Research Council via FT170100040 and DP18010423. FM acknowledges funding from ANR of France via contract ANR-16-CE31-0013. Thanks to Satoshi Ohashi for spotting an error in an earlier version of this paper.
References
- ALMA Partnership et al. (2015) ALMA Partnership et al., 2015, ApJ, 808, L3
- Bacciotti et al. (2018) Bacciotti F., et al., 2018, preprint, (arXiv:1809.02559)
- Cox et al. (2018) Cox E. G., Harris R. J., Looney L. W., Li Z.-Y., Yang H., Tobin J. J., Stephens I., 2018, ApJ, 855, 92
- Draine (2003) Draine B. T., 2003, ARA&A, 41, 241
- Girart et al. (2018) Girart J. M., et al., 2018, ApJ, 856, L27
- Guidi et al. (2016) Guidi G., et al., 2016, A&A, 588, A112
- Harris et al. (2018) Harris R. J., et al., 2018, ApJ, 861, 91
- Huang et al. (2018) Huang J., et al., 2018, ApJ, 852, 122
- Hughes et al. (2009) Hughes A. M., Wilner D. J., Cho J., Marrone D. P., Lazarian A., Andrews S. M., Rao R., 2009, ApJ, 704, 1204
- Hull et al. (2018) Hull C. L. H., et al., 2018, ApJ, 860, 82
- Isella et al. (2007) Isella A., Testi L., Natta A., Neri R., Wilner D., Qi C., 2007, A&A, 469, 213
- Isella et al. (2016) Isella A., et al., 2016, Phys. Rev. Lett., 117, 251101
- Kataoka et al. (2015) Kataoka A., et al., 2015, ApJ, 809, 78
- Kataoka et al. (2016a) Kataoka A., Muto T., Momose M., Tsukagoshi T., Dullemond C. P., 2016a, ApJ, 820, 54
- Kataoka et al. (2016b) Kataoka A., et al., 2016b, ApJ, 831, L12
- Kataoka et al. (2017) Kataoka A., Tsukagoshi T., Pohl A., Muto T., Nagai H., Stephens I. W., Tomisaka K., Momose M., 2017, ApJ, 844, L5
- Lee et al. (2018) Lee C.-F., Li Z.-Y., Ching T.-C., Lai S.-P., Yang H., 2018, ApJ, 854, 56
- Li et al. (2017) Li J. I., Liu H. B., Hasegawa Y., Hirano N., 2017, ApJ, 840, 72
- McMullin et al. (2007) McMullin J. P., Waters B., Schiebel D., Young W., Golap K., 2007, in Shaw R. A., Hill F., Bell D. J., eds, ASP Conf. Ser. Vol. 376, ADASS XVI. p. 127
- Monnier et al. (2017) Monnier J. D., et al., 2017, ApJ, 838, 20
- Montesinos et al. (2009) Montesinos B., Eiroa C., Mora A., Merín B., 2009, A&A, 495, 901
- Muro-Arena et al. (2018) Muro-Arena G. A., et al., 2018, A&A, 614, A24
- Pinilla et al. (2014) Pinilla P., et al., 2014, A&A, 564, A51
- Pinte et al. (2006) Pinte C., Ménard F., Duchêne G., Bastien P., 2006, A&A, 459, 797
- Pinte et al. (2009) Pinte C., Harries T. J., Min M., Watson A. M., Dullemond C. P., Woitke P., Ménard F., Durán-Rojas M. C., 2009, A&A, 498, 967
- Pinte et al. (2016) Pinte C., Dent W. R. F., Ménard F., Hales A., Hill T., Cortes P., de Gregorio-Monsalvo I., 2016, ApJ, 816, 25
- Pinte et al. (2018) Pinte C., et al., 2018, ApJ, 860, L13
- Rau & Cornwell (2011) Rau U., Cornwell T. J., 2011, A&A, 532, A71
- Stephens et al. (2017) Stephens I. W., et al., 2017, ApJ, 851, 55
- Tazaki et al. (2017) Tazaki R., Lazarian A., Nomura H., 2017, ApJ, 839, 56
- Teague et al. (2018) Teague R., Bae J., Bergin E. A., Birnstiel T., Foreman-Mackey D., 2018, ApJ, 860, L12
- Yang et al. (2016a) Yang H., Li Z.-Y., Looney L., Stephens I., 2016a, MNRAS, 456, 2794
- Yang et al. (2016b) Yang H., Li Z.-Y., Looney L. W., Cox E. G., Tobin J., Stephens I. W., Segura-Cox D. M., Harris R. J., 2016b, MNRAS, 460, 4109
- Yang et al. (2017) Yang H., Li Z.-Y., Looney L. W., Girart J. M., Stephens I. W., 2017, MNRAS, 472, 373
- Zhang et al. (2016) Zhang K., Bergin E. A., Blake G. A., Cleeves L. I., Hogerheijde M., Salinas V., Schwarz K. R., 2016, ApJ, 818, L16
- de Gregorio-Monsalvo et al. (2013) de Gregorio-Monsalvo I., et al., 2013, A&A, 557, A133