The ATLAS All-Sky Stellar Reference Catalog
Abstract
The Asteroid Terrestrial-impact Last Alert System (ATLAS) observes most of the sky every night in search of dangerous asteroids. Its data are also used to search for photometric variability, where sensitivity to variability is limited by photometric accuracy. Since each exposure spans 7.6∘ corner to corner, variations in atmospheric transparency in excess of 0.01 mag are common, and 0.01 mag photometry cannot be achieved by using a constant flat field calibration image. We therefore have assembled an all-sky reference catalog of approximately one billion stars to from a variety of sources to calibrate each exposure’s astrometry and photometry. Gaia DR2 is the source of astrometry for this ATLAS Refcat2. The sources of , , , photometry include Pan-STARRS DR1, the ATLAS Pathfinder photometry project, ATLAS re-flattened APASS data, SkyMapper DR1, APASS DR9, the Tycho-2 catalog, and the Yale Bright Star Catalog. We have attempted to make this catalog at least 99% complete to , including the brightest stars in the sky. We believe that the systematic errors are no larger than 5 millimag RMS, although errors are as large as 20 millimag in small patches near the galactic plane.
1 INTRODUCTION
The Asteroid Terrestrial-impact Last Alert System has been funded by NASA to find dangerous asteroids that might threaten the Earth (Tonry et al., 2018). Henceforth known as the ATLAS project, it requires extremely accurate photometry and astrometry for a number of reasons.
-
•
Good astrometry is critical for determining precise minor planet orbits. ATLAS achieves a positional accuracy of RMS per star relative to a fit to a frame or a astrometric reference for , so without an absolute astrometric reference catalog (such as Gaia) that is substantially better than that we cannot provide the Minor Planet Center (MPC) with measurements of asteroid positions that exploit the full potential of our system for precise astrometry. Such homogeneous, precise measurements will ultimately aid the detection and measurement of non-gravitational forces on asteroid orbits, e.g. the Yarkovsky effect.
- •
-
•
We detect asteroids by subtracting a static “wallpaper” image of the sky, and that subtraction does not reach photon limited performance unless the astrometry is precise to at least 0.05 pixels and the photometry to at least 0.03 mag.
-
•
As a byproduct of the asteroid search ATLAS also produces light curves for every other detected object in the sky, whose value for a myriad of scientific studies depends on the quality of the photometry. There is rich discovery space for time-domain studies of stars, galaxies and transients: ATLAS data are already contributing through the first release of a 4.7 million variable star catalog. (Heinze et al., 2018).
-
•
A particular challenge for calibrating wide-field images is patchy, very thin clouds, common across the 30 square degree field-of-view in ATLAS. We address this challenge by identifying stars in each frame and deriving a “cloud correction” by comparing them to an accurate reference catalog. Such patchy obscuration has been detected before when hyper-calibration of large, well calibrated data has been achieved (e.g. the contrail effect visible when Pan-STARRS and the Sloan Digital Sky Survey data were combined by Finkbeiner et al., 2016).
An all-sky photometric catalog with the accuracy required by ATLAS is not currently available. While the ESA/Gaia mission (Data Release 2, DR2, overview description Gaia Collaboration et al., 2018) is expected to provide the groundwork for such a catalog at an unprecedented level of precision, it will not support ATLAS bandpasses until the release of low-resolution spectra expected in their DR3 by the year 2021. Since ATLAS needs a precise reference catalog now, the purpose of this work is to construct it from a variety of existing sources, and we expect this catalog to be beneficial to other projects as well. This paper is part of a series that describe the ATLAS project and its various components and data products, the first two being the system definition paper (Tonry et al., 2018) and the first variable star data release (Heinze et al., 2018).
There are many sources of optical photometry, none of which provides the perfect reference source for ATLAS observations, which currently range from the north celestial pole to Dec ∘, include the Galactic plane and extend as bright as . ATLAS has also started on two additional units in South Africa and Chile. Contemporary surveys most often employ -filter systems, similar to bandpasses used in the Sloan Digital Sky Survey (SDSS; Fukugita et al., 1996, 2011) and Pan-STARRS (Tonry et al., 2012; Chambers et al., 2016; Flewelling et al., 2016). Hence, it seems natural to construct a reference catalog with photometry and then apply mild color transformations when using it to calibrate observations using different filter sets. We initially started calibrating ATLAS data with Gaia Data Release 1 (DR1; Gaia Collaboration et al., 2016), Pan-STARRS Data Release 1 (DR1; Magnier et al., 2016c; Chambers et al., 2016), and APASS Data Release 9 (DR9; Henden et al., 2016), but a number of issues cause problems. Gaia DR1 has holes in its coverage, Pan-STARRS DR1 is not accurate brighter than and does not extend south of Dec , and APASS DR9 photometry is not reliable at the 0.05 mag level. To exploit ATLAS data optimally, we therefore require a new all-sky reference catalog that meets our own strict requirements.
We spent a year collecting images with a small ATLAS Pathfinder Telescope on Mauna Loa in order to obtain photometry for stars brighter than the magnitude limit of Pan-STARRS and to push our photometric reference south of Dec ∘. In addition, the AAVSO/APASS team very generously sent us a nearly complete set of images covering the sky from the south pole to Dec which we re-flattened, re-photometered, and re-combined into a new southern sky catalog.
Gaia DR2 is a truly beautiful product. The completeness is excellent; few stars brighter than are missing. The astrometry (and proper motions and parallaxes) are superb, of course. In addition, Gaia DR2 offers and photometry which appears to be extremely uniform and accurate. Another important, recent data source is the SkyMapper Data Release 1 (DR1, Wolf et al., 2018) which provides for most of the southern sky. Although its photometry is currently tied to APASS DR9, it goes considerably deeper and is more accurate. Of course, 2MASS (Skrutskie et al., 2006) is a well calibrated all-sky resource as are the Tycho-2 catalog (Høg et al., 2000) and the Yale Bright Star Catalog (Hoffleit, 1964).
In this paper we present a compilation of these sources to produce an all-sky catalog of stellar photometry that we believe is accurate and virtually complete to . The catalog data are based on our new observations, our re-reductions, and the extant catalog data, synthesizing all the photometry into a best estimate of for each star on the Pan-STARRS bandpasses.
We will describe our Pathfinder observations and reductions, our APASS re-reductions, the procedure we followed for each catalog to bring it onto the Pan-STARRS -bandpass system, and the production of the final catalog. We call this final data product ATLAS Refcat2. The precise content of Refcat2 is described in Appendix A.
2 External sources of photometry
2.1 2MASS
The 2 Micron All Sky Survey (2MASS, Skrutskie et al., 2006) covered the entire sky in infrared bandpasses. The systematic errors in astrometry are no larger than 0.05″ and in photometry no larger than 0.02 magnitude, but the infrared magnitudes are not directly convertible to at the level required here. These magnitudes are very useful in combination with the Gaia photometry to distinguish stellar color from reddening, however. We downloaded the 2MASS data from IPAC111http://irsa.ipac.caltech.edu/2MASS/download/allsky.
2.2 APASS Data Release 9
The AAVSO has released a catalog of stellar photometry for about 50 million stars over the entire sky, from the AAVSO Photometric All Sky Survey (APASS DR9; Henden et al., 2016). The astrometry is tied to UCAC3 (Zacharias et al., 2010), with an accuracy better than 0.1″, and its photometry includes across the range . Their cameras are Apogee U16m with a 4k KAF16803 detector and Astrodon , , , , , , and -filters. The KAF16803 detector has lower quantum efficiency than our ATLAS Pathfinder CCID20 CCDs (see Section 3.1), but APASS used 180/90/90 sec exposures in , so the depths are comparable.
As described below, we corrected for substantial, systematic photometric offsets in this published DR9 dataset. Because APASS carried out a flattening correction, photometry, and detection combination for DR9 that is independent of the work performed here, we consider it to be a quasi-independent source of photometry and we added it into the sources of magnitudes, once these offsets were corrected on a square degree basis.
2.3 Pan-STARRS
The Pan-STARRS1 Telescope (Chambers et al., 2016) surveyed the sky north of Dec ∘ many times in filters between 2010 and 2014. The Pan-STARRS bandpasses have been well characterized (Tonry et al., 2012). These data have been homogenized using an “ubercal” procedure (Padmanabhan et al., 2008; Schlafly et al., 2012) and tied to the Space Telescope Science Institute’s “Calspec” stars (Bohlin et al., 2001; Bohlin, 2007, 2014). The Pan-STARRS1 data processing (Magnier et al., 2016a; Waters et al., 2016; Magnier et al., 2016b) and calibration (Magnier et al., 2016c) provide accurate photometry ( mag) and astrometry ( milliarcsec), but only for stars fainter than ; brighter stars are saturated.
We used the Pan-STARRS DR1 catalog database (Flewelling et al., 2016), by running a query that checks that the object has a stack magnitude less than 19 in any of ,,, or , and that bestDetection=1 and primaryDetection=1 in the StackObjectThin tables, and reports back the mean positions (RA/Dec) and mean PSF (point spread function) magnitudes in from the ObjectThin and MeanObject tables. This query was chosen to restrict the objects to those that are bright enough for ATLAS as well as to select objects that have been seen multiple times by Pan-STARRS and for which the Pan-STARRS stack photometry (measurement from the co-add of all images) succeeded. We use the Pan-STARRS mean photometry (mean of measurements from all images) because it is has had ubercal corrections applied (see Schlafly et al., 2012; Magnier et al., 2016c) whereas the corresponding stack photometry has not. However to maximize the probability that an object is a real star (and not a spurious detection, transient source or a moving object), it is useful to check that it exists and that certain flags are set in the stack table. In Appendix B we provide an example of the query, should others wish to select a similar set of Pan-STARRS1 data from the MAST archive222http://mastweb.stsci.edu/ps1casjobs/.
2.4 SkyMapper
In Dec 2017, SkyMapper published a slight revision to their first data release, DR1.1333http://skymapper.anu.edu.au/data-release, comprising 285 million sources (Wolf et al., 2018). DR1.1 employs 2MASS and a selection of APASS stars to set observation zeropoints (the number that converts flux reported by photometry routines to calibrated magnitude) and determine magnitudes. We found that photometric errors in APASS DR9 had left a substantial imprint on SkyMapper photometry, so we corrected the SkyMapper photometry on each square degree, as described below. We caution that the point-source photometry in DR1.1 is derived from 1D-growth curves and thus is only reliable for isolated sources that have no neighbors within .
2.5 Tycho-2 and bright stars
The ESA Hipparcos satellite (van Leeuwen, 2007) surveyed the entire sky to determine parallaxes of bright stars, and it included the Tycho photometry instrument. The Tycho-2 catalog it produced contains almost all the stars in the sky brighter than (Høg et al., 2000). Its astrometry is superb and its photometry is quite homogeneous over the entire sky, albeit subject to crowding problems in the galactic plane. Tycho had two filters and , similar to Johnson and , so cannot be compared directly with photometry without significant color transformations.
The 2MASS team performed a match between Tycho-2 and 2MASS, providing photometry for about 2.5 million stars. Pickles & Depagne (2010) then used this 2MASS match to determine a best-fitting stellar spectral energy distribution (SED) from their compendium of SEDs, and published synthetic photometry for each of the Tycho-2 stars.
The Tycho-2 catalog becomes quite incomplete for , so we augmented it with the Yale Bright Star Catalog (BSC) (Hoffleit, 1964; Hoffleit & Warren, 1995). magnitudes were estimated from the , , and and colors when available. These estimates are not particularly accurate, but they ensure the completeness of the final Refcat2. We shifted Tycho-2 and BSC coordinates to epoch 2015.5 according to the Tycho-2 proper motions and merged the two, with preference to Tycho-2 for stars listed by both.
2.6 Gaia
The Gaia Collaboration published a first data release in 2016, (DR1 Gaia Collaboration et al., 2016) and issued a greatly improved second data release DR2 on 25 Apr 2018 (Gaia Collaboration et al., 2018). DR2 has three substantial improvements relative to DR1: it closes holes in the sky, it provides Gaia “” and “” magnitudes for stars brighter than , and it provides proper motions and parallaxes for many stars. The star coordinates in DR2 are all epoch 2015.5. This is a revolutionary dataset, not only because of the unprecedented depth and accuracy of the astrometry, but also because of the accuracy of the photometry. Comparison of DR1 magnitudes against Pan-STARRS clearly showed the Gaia scan patterns, indicating photometry errors at the magnitude level. DR2 does not show Gaia scan patterns relative to Pan-STARRS at the magnitude level or better, and of course there is every expectation that the Gaia photometry can be homogeneous over the entire sky. As we discuss later (Section 4.2), we do observe a small difference between Gaia DR2 photometry and ground-based photometry that correlates with star density.
3 New sources of photometry data and our processing
In addition to extant catalogs, our reference catalog also includes a new photometric information over much of the sky from our own ATLAS Pathfinder observations as well as from a re-processing of APASS images.
3.1 ATLAS Pathfinder Hardware and Survey
The ATLAS Pathfinder Telescope is a Takahashi Epsilon-180 astrograph that has a 5 degree diameter field of view, an aperture of 180mm and a focal length of 500mm. It is equipped with an FLI PDF focuser and an FLI filter changer. The filter changer has Astrodon444http://www.astrodon.com/sloan.html 50mm SDSS Gen-2 , , and -band filters inserted. These filters have very square bandpasses with half-transmission points of 401–550nm (-filter), 562–695nm (-filter), and 695–844nm (-filter). This is followed by a Uniblitz 45mm shutter and a custom CCD camera. The CCD camera has two 2k4k Lincoln Lab CCID20 CCDs with 15 um pixels, for a plate scale of 6.2 arcsec/pixel. The Takahashi illuminates a circle of diameter 3000 pixels, so the field of view is about 19 square degrees. These CCDs are back-illuminated and 45 um thick so their quantum efficiency and uniformity is excellent.
The telescope was used on Mauna Loa in the ATLAS Ash dome at the NOAA observatory at an elevation 11,000 feet for approximately 2 years, prior to the installation of the ATLAS 0.5 m telescope. We observed between MJD 57396 (2016-01-09) and 57782 (2017-01-29), initially collecting images in a single filter on a given night, applying dithers and letting some time elapse between observations. In March 2016 (MJD 57449) we switched to a mode of collecting three consecutive images in at each pointing, covering about 1/5 of the visible sky on a given night. We normally observed in five Declination bands between and . All exposure times were 30 sec, and the Takahashi vignettes about 40% of the light at the edge of the field of view.
The Takahashi telescope produces a focal surface that curls up at the edge of the field of view, and at f/2.8 there is a distinct non-uniformity of focus. In addition the detectors are slightly tilted with respect to the focal surface. At its best the Takahashi makes images of about 1.2 pixels, but we deliberately chose a focus that produces images of about 1.7 pixels full width at half maximum (FWHM) over the entire field of view. There is a distinct variation in the shape of the images as a function of position, but the overall FWHM is reasonably constant for all filters over the entire field of view. However, prior to running DoPhot we elected to convolve images with a Gaussian of 2 pixels FWHM. This costs about a half magnitude in sensitivity but significantly improves the photometric accuracy over the field.
Among the Pathfinder data, “good nights” were identified as those with a scatter in zeropoint (magnitude that provides 1 count per second) less than 0.03 mag (4/3 the quartile range) as a function of airmass over the majority of the night, and “good observations” were selected. A total of 362 nights altogether and 232,558 exposures in yielded 213 nights that were at least partly photometric, with a total of 165,294 exposures. After fairly stringent cuts on quality control metrics 159,397 exposures survived to provide stellar photometry. Our sky coverage of these exposures is displayed in Figure 1. Each image produces a table of about 30,000 stars with astrometric accuracy of about 0.2″ relative to Gaia DR1 and photometric accuracy of about 0.05 mag relative to Pan-STARRS at , , and . The Pathfinder observations saturate at approximately .
3.2 Photometric processing of ATLAS Pathfinder data
The basic ATLAS pipeline (Tonry et al., 2018) was used to reduce the ATLAS Pathfinder data. The stages involve bias subtraction, division by a flatfield, and identifying many stars to determine pixel positions and fluxes. A subset of these stars are matched to sky positions using code from astrometry.net (Lang et al., 2010) to obtain an initial astrometric solution. All stars are then matched to the first generation ATLAS reference catalog555ATLAS project internal version Refcat1 based on Gaia DR1, Pan-STARRS, and APASS DR9 to derive an accurate astrometric solution expressed as WCS coefficients and a photometric zeropoint. Refcat1 has estimates of star magnitudes on the Pan-STARRS , , and filter system (Tonry et al., 2012), and these magnitudes are converted to the Pathfinder observational bandpasses (see Table 2 below).
The flatfield is initially a night time sky flat image, derived from the median of all images in a given filter for a night, but then the stars from images that overlap the Pan-STARRS catalog are compared with Pan-STARRS magnitudes, a low order spline fit to the differences is multiplied into the flatfield to make a “photo-flat” or “star flat”, and the data from the night are re-reduced with this new flatfield. As described below, the purpose of the photo-flat is to correct intra-exposure photometric variations, not to get the final zeropoint for the exposure correct; the zeropoint evaluation follows a completely different procedure. This photo-flat serves for a lunation.
Finally we run a version of DoPhot (Schechter et al., 1993) that was modified by Alonso-Garcia (Alonso-Garcia et al., 2012) to accept floating point data and to cope with a varying point spread function. We also had to make a number of modifications to DoPhot as well to get the variable PSF to work properly and also to be able to introduce an external variance image. DoPhot processes an image iteratively. At any point it maintains a catalog of all stars it has detected, and it subtracts its model of those stars from the image before detecting and measuring new stars or remeasuring old stars in the catalog. In this way DoPhot does a very creditable job of dealing with high star densities and blended images.
DoPhot calculates two different fluxes for most stars: an “aperture magnitude” which is the sum of the flux within a large aperture (″) radius, and a “fit magnitude” which is the flux derived from the integral of the DoPhot PSF function. The former includes almost all the light from a star but is noisy, the latter has systematic errors when the DoPhot PSF model does not match the actual star profile. All stars have a “fit magnitude”, but only the bright stars have an “aperture magnitude”. By examining the difference between aperture and fit magnitudes for the bright stars, the fit magnitudes for faint stars can be converted to aperture magnitudes. The result is that we can produce low noise instrumental magnitudes for each star that are referred to large aperture fluxes.
3.3 APASS re-reduction
The APASS project kindly provided ATLAS with 258,312 images of the southern sky on a 3TB external drive. They were taken at the APASS facility at the Cerro Tololo Inter-American Observatory in Chile, primarily (237,498 images) in , , , , and filters over a span of MJD 55507 (2010-11-07) to 56725 (2014-03-09). They cover nearly the entire sky with Dec ∘, with few gaps (the southern “crack in the sky” that stretches between to is not covered by these images). The APASS system has a 2.92.9∘ field of view with 2.6″ pixels, and exposure times were varied so as to extend the dynamic range to brighter stars.
We reduced all APASS exposures through the ATLAS pipeline, including the match with ATLAS reference catalog Refcat1. Because the APASS observing strategy on each night brought the telescope well north of Dec ∘, virtually every night overlapped the Pan-STARRS catalog well enough to provide a photo-flat correction to the APASS flatfield. This was not a trivial modification, amounting to a peak-to-peak of 0.2 magnitude over a typical image and an RMS of about 0.05 mag. There was also a dramatic, steady decrease in zeropoint by 0.7 mag in all filters over this 3.3 year span. We found that the Pan-STARRS flatfield comparison was very consistent in a given filter from night to night, and on the few nights when APASS did not venture north of ∘ we used the photo-flat correction from the closest night that did. The astrometric errors are typically 0.07″ in each coordinate at , and the typical photometric errors in the long exposures are 0.05 mag at , , , , and .
As with the Pathfinder data, “good nights” and “good observations” were identified from the scatter in zeropoint as a function of airmass, and quality control metrics. 692 nights altogether yielded 542 nights that we deem were photometric, with a total of 178,094 exposures of which 154,406 in , , , , and provided stellar photometry. The APASS sky coverage is displayed in the right panel of Figure 1. (There is also an APASS-north survey which we did not use.)
It is important that readers and users note the following. Hereafter the “APASS” catalog will be used to mean the APASS data that has been reprocessed by ATLAS, and the “APASS DR9” catalog will refer to the magnitudes published by the APASS project. These share many of the same data files but the processing is completely different. As detailed below, this re-reduction of APASS made the intra-CCD photometry about a factor of 3 better than what was published in APASS DR9, the re-processed photometry is about 2 magnitudes deeper, and even after we correct APASS DR9 into agreement with Gaia and Pan-STARRS this re-reduced APASS catalog is distinctly more homogeneous across the sky.
4 Zeropoints
Table 1 shows catalog comparison with Pan-STARRS in the same equatorial band between ∘ and ∘ Dec, collecting median differences of star magnitudes over each coordinate square degree and then examining the statistics between these square degrees. Color terms from Table 2 have been applied to each catalog’s magnitudes to bring them into agreement with Pan-STARRS.
Note that APASS DR9 has substantial offsets with respect to Pan-STARRS (53 millimag in for example), and substantial RMS values of 11–17 millimag. Similarly, SkyMapper DR1.1 is better corrected in terms of zeropoint and was distinctly tighter (RMS of 6–10 millimag), but the large scale differences between APASS and Pan-STARRS are echoed in SkyMapper DR1.
| Survey | ZP | ||||||||
|---|---|---|---|---|---|---|---|---|---|
| APASS DR9 | — | 53 | 11 | -13 | 12 | -34 | 17 | ||
| SkyMapper DR1.1 | — | -5 | 10 | -18 | 10 | -9 | 6 | 10 | 8 |
| APASS | diff | 0 | 17 | 0 | 10 | 0 | 12 | ||
| APASS | secz | 0 | 13 | 0 | 7 | 0 | 11 | ||
| APASS | GMP | 0 | 2 | 0 | 1 | -1 | 2 | ||
| Pathfinder | GMP | -1 | 1 | -0 | 1 | -1 | 2 | ||
| SkyMapper | GMP | -2 | 2 | -3 | 2 | -2 | 2 | 0 | 1 |
| APASS DR9 | GMP | -3 | 2 | -2 | 2 | 1 | 2 |
We regard an RMS of 10 millimag as unacceptable for our reference catalog because it is a systematic error that would be impressed on every observation that used it, and because fluctuations of many times the RMS occur around the sky. Although a given ATLAS exposure averages 30 such square degrees, these fluctuations tend to be spatially correlated and we could potentially incur photometry errors of as much as 3 times the RMS of the reference catalog. While it is straightforward to alter APASS DR9 or SkyMapper on a square degree by square degree basis to agree with Pan-STARRS, this does not help us for the southern sky.
4.1 Combining detections
Initial attempts to assemble the Pathfinder and APASS detections into a consistent set of photometry over the sky were only successful at the 10 millimag level — not good enough for our purposes. The reference catalog, photo-flats, and dithers did a good job of making photometry consistent ( millimag) within a given exposure, and averaging many detections could then in principle bring the photometry to the accuracy we need.
However, determination of zeropoints for the exposures to make a combination whose systematic error was below 10 millimag proved to be difficult. We used a combination of three methods to determine zeropoints for exposures: 1) set the zeropoint directly by comparison with external authority, 2) set the zeropoint by regression against airmass on photometric nights, and 3) set the zeropoint by intercomparison of overlapping exposures (the ubercal approach; Padmanabhan et al., 2008; Schlafly et al., 2012).
Although Pan-STARRS is an excellent external authority and is the basis for the photo-flats, it does not exist south of Dec ∘. Gaia is available all-sky, but provides only very broad bands and it is a priori not clear how well they constrain the narrower Pan-STARRS passbands. It turned out to be challenging to determine zeropoints from airmass regression for two reasons. We were simply reluctant to severely restrict the list of workable nights in search of truly photometric nights; we did not feel that we would have enough exposures remaining to cover the sky. The second reason is that zeropoint for an exposure actually depends on more than airmass. Since the zeropoint is the conversion between summed flux and magnitude it depends on the details of photometry algorithm, not just the aperture and detector QE and gain. In particular, the pixel size of 6.2″ (Pathfinder) or 2.6″ (APASS) means that variations in star density cause very substantial shifts in the zeropoint, and PSF size and shape are additional factors. The zeropoint for images derived by comparison with Pan-STARRS (0.26″ pixels) during a night depends markedly on galactic latitude and photometry algorithm and parameters as well as the expected dependency on airmass.
We wrote an elaborate program to simultaneously solve for as many as zeropoints based on inter-exposure differences (the third method) in addition to absolute zeropoints provided by an external authority (first method) and by airmass regression (second method). This procedure worked very well. With external zeropoints weighted lightly the resulting error in star magnitudes (judged by comparison with Pan-STARRS in the belt with ) are very smooth but have large scale variations as might be expected from the differential constraint. When the zeropoints from airmass regression and external authority were heavily weighted the small scale variation became much rougher on the scale of an observation footprint in the south where we did not have external zeropoints, but the RMS improved slightly.
The RMS values of the re-flattened APASS images were 17–12 millimag when we let the inter-exposure differences dominate the fit weights (labeled diff in the second column of Table 1), and 13–11 millimag when zeropoints from airmass regression dominated (labeled secz in Table 1). Optimizing the weights between differences and external zeropoints made things slightly better still, but we could not find a combination that made the RMS values substantially better than 10 millimag. Since this is the RMS between square degree tiles it represents an unacceptable systematic error.
4.2 The Gaia+2MASS+PS1 (GMP) subset and analysis
The release of Gaia DR2 created a new opportunity to set zeropoints. The Gaia bandpasses are very broad and very different from . is approximately 410–840 nm, is approximately 335–660 nm, and is approximately 640–900 nm, but and have extensive red tails, and a substantial dip between 365–400 nm.666https://www.cosmos.esa.int/web/gaia/dr2 However, comparison between Gaia magnitudes synthesized from Pan-STARRS revealed little spatial variation across the sky. It therefore appeared to be possible to pick a subset of Gaia stars that match with the 2MASS survey and have low reddening, and use the Gaia and 2MASS magnitudes to make accurate estimates of magnitudes over the entire sky. Since our goal is to set the overall zeropoint for exposures with photometry for many stars and good internal photometric consistency, a small subset of the stars can serve to set the zeropoint for all stars in that exposure.
Experiments revealed that the most fruitful comparison was with Gaia magnitudes in the , plane. The stellar locus has a tight regression for unreddened, non-red stars, and the reddening vector is distinctly non-parallel to the stellar locus so can serve to de-redden as well as distinguish giant from dwarf stars. Comparing the Gaia and 2MASS data with the Pan-STARRS DR1 catalog revealed an appropriate subset of stars and regressions for Pan-STARRS from the Gaia and 2MASS magnitudes (abbreviated GMP).
The stars that are chosen for the GMP subset have
-
•
neither Gaia VARIABLE nor DUPLICATE flag set,
-
•
uncertainties in and less than 0.03 mag,
-
•
uncertainties in and less than 0.05 mag,
-
•
, , , and
-
•
,
where
| (1) |
is the Gaia stellar locus. Evidently the color cuts are removing very blue and very red stars, regardless of whether the color is intrinsic or caused by reddening. We are also removing stars with that Gaia believes are extremely reddened ( is the Gaia extinction estimate in the Gaia broadband bandpass), and the last cut is removing stars that deviate from the stellar locus in Gaia colors.
We found that the residuals of Pan-STARRS magnitudes with respect to a regression based on the GMP subset of Gaia and 2MASS magnitudes still had rather large errors (0.1 mag) near the galactic plane, but these correlated well with star density. These deviations are minimal below a threshold star density, but then increase roughly proportional to the square root of star density (inverse of mean star separation) in more crowded regions. We use the count of Gaia stars with in each angular square degree () to create a star proximity variable we term . In -band, for example, the threshold for disagreement is (2500 stars per square degree), and the disagreement rises to 100 millimag at .
We do not understand the origin of these deviations. They do not depend directly on galactic latitude (extremely obscured areas right on the plane have small and small deviation). They do not appear to depend on star brightness, they are still present when 2MASS is removed from the Gaia-Pan-STARRS comparison, and they do not appear to correlate well with reddening, neither Gaia estimates nor the total column reddening from Schlegel et al. (1998) (SFD). Star density correlates with extinction and giant/dwarf ratio, of course, but neither of these variables correlates as well as star density. Our best guess is that Gaia incurs some sort of photometry offset as it scans areas with very high star densities that creates a small error.
Our predictions for Pan-STARRS from Gaia and 2MASS are for the GMP subset are:
| (2) | ||||
| (3) | ||||
| (4) | ||||
| (5) |
where is the Gaia color, is the 2MASS color, and is the scaled, square root star density.
The advantage of using GMP to set zeropoints is its uniformity over the entire sky. The cost of such an approach is that errors in the Gaia and 2MASS source catalogs are impressed on all the results, and the risk is that systematic changes in reddening, metallicity, dwarf/giant population ratio, and crowding will also create systematic biases. Our judgement is that the Gaia systematic errors are less than 0.01 mag (although we are not certain about crowded regions), and that the coefficients multiplying are small enough to ensure that the 2MASS systematic errors will also not contribute at the 0.01 mag level either. We examine the final results for systematic errors below, and find they are small. Using GMP to set the photometric basis for our reference catalog appears to be the best we can do for photometry south of ∘ Dec, at least until the release of Gaia DR3 which will presumably synthesize from the spectra.
We created a GMP catalog of stars for the entire sky using the regressions of Equations 2-5, and used them to set zeropoints for all our APASS re-reductions and Pathfinder observations. Since GMP is a regression that produces Pan-STARRS bandpass magnitudes from Gaia and 2MASS, we must first convert the Pan-STARRS , , , and to each individual catalog’s bandpass before comparison. To our knowledge, only Pan-STARRS has published bandpasses measured in-situ, so we did not trust any estimates of color terms derived from integration of SEDs against bandpass estimates, but worked entirely empirically. Regressions for catalog magnitude as a function of Pan-STARRS magnitude and vice versa over the usual Dec band are given in Table 2.
The relations in Table 2 are not inverses. The calculation of catalog magnitude as a function of Pan-STARRS was derived from the GMP subset of stars in order to set zeropoints (the same relation is applicable to both the APASS re-reduction as well as APASS DR9.) The relations that predict Pan-STARRS magnitude as a function of catalog magnitude conversely are calculated from all stars, regardless of color or reddening. In order to derive these, we matched all stars from each catalog to Pan-STARRS, sorted the independent variable or from the catalog into bins of size 0.1 mag, and then took the median of all magnitude differences in that bin. We fitted a line to a selected range in abscissa and verified that it matched trends visible in these medians as well as the cloud of all points. The results for the APASS re-reduction and APASS DR9 are quite independent of each other because the APASS re-reduction includes much fainter and redder stars than APASS DR9. As with all simple, empirical, linear color term transformations, these do not pretend to high accuracy for stars with extremely red or blue SEDs. Therefore individual Refcat2 magnitudes for very red or blue stars without direct Pan-STARRS photometry (south of Dec ∘ or brighter than ) should be treated with care.
| RMS | ||||
| 0.032 | ||||
| 0.039 | ||||
| 0.050 | ||||
| 0.043 | ||||
| 0.036 | ||||
| 0.042 | ||||
| 0.032 | ||||
| 0.016 | ||||
| 0.022 | ||||
| 0.020 | ||||
| 0.026 | ||||
| 0.027 | ||||
| 0.045 | ||||
| 0.021 | ||||
| 0.026 | ||||
| 0.046 | ||||
| 0.018 | ||||
| 0.019 | ||||
| 0.025 | ||||
| 0.029 | ||||
| 0.021 | ||||
| 0.016 | ||||
| 0.020 |
The APASS re-reduction and Pathfinder detections were then grouped by matching against the list of all Gaia stars and weighted median magnitudes were calculated for each star. (The “weighted median” occurs at the 50% quantile of the cumulative inverse variance weights for all the detection magnitudes.) An uncertainty was estimated from the weighted quartiles and the number of contributing observations. When this uncertainty is significantly discrepant from the individual uncertainties we flag the star as a potential variable.
There are real stars in the APASS and Pathfinder observations for which the closest Gaia star is more than 10.8″ distant. For these we assembled a median magnitude by grouping among themselves, and we include them in the Refcat2 output. We endeavored to avoid galaxies in the DoPhot output for APASS and Pathfinder, but these images do not have a lot of spatial resolution so a few bright galaxies have crept into Refcat2 (about 0.02% of the total). These non-Gaia objects can be distinguished because the Gaia magnitude and uncertainty are zero. Appendix A provides details.
The photometry of the final APASS and Pathfinder objects are compared against Pan-STARRS in Table 1 with GMP listed as the source of zeropoint. The scatter for APASS and Pathfinder are now only a few millimags.
We also used the GMP set of stars to correct the photometry of APASS DR9. Because the reduction, photometric analysis, and detection combination used by the APASS project for DR9 is completely different from our re-reduction, there is merit in treating it as an independent set of photometry. We cannot re-flatten the APASS DR9 observations and recombine them, but we can correct on a square degree basis using the GMP subset, and as noted above much of the variation of APASS DR9 with respect to Pan-STARRS occurs on scales of many degrees, so a square degree correction should not create serious discontinuities.
Similarly we created a new version of SkyMapper DR1.1 where the magnitudes for in each square degree are shifted to agree with the GMP estimates. SkyMapper DR1.1 flags some stars as having uncertain photometry because of crowding. For these we added 0.2 magnitude in quadrature to the uncertainties. This 0.2 mag is really an operational choice rather than an estimate of true uncertainty. The effect causes their contribution to the final magnitude to be minimal if another catalog has data, and serves to flag uncertain photometry when only SkyMapper contributes.
For both APASS DR9 and SkyMapper the magnitudes in each filter and each square degree are shifted by a constant value, so relative photometry between stars of different brightness in a given square degree is not changed. The regressions to convert these revised APASS DR9 and SkyMapper magnitude to the Pan-STARRS bandpasses are given in Table 2.
Lastly we list in Table 3 a crude set of regressions to get Pan-STARRS magnitude estimates from Gaia magnitudes alone in order to provide some sort of magnitude estimate when no other catalog is available. (These are given large systematic error which de-weights their contribution if some other catalog provides real photometry.) There is a large scatter, of course, and these are not available for stars too faint to have and . There is a prominent set of red stars (M giants) that diverge significantly from this relationship, but for magnitudes fainter than the M dwarfs will dominate.
| Domain | |||
|---|---|---|---|
5 Catalog combination
The pieces of our reference catalog now need to be combined. For the master list of stars we collect all Gaia stars for which at least one of , , or is brighter than . To this list we add objects from any of the other catalogs which seem to be bona fide stars and which are farther than 0.001∘ (3.6″) from the nearest Gaia star (0.003∘ for Pathfinder and APASS). By including stars from Tycho-2 and the BSC we think Refcat2 contains all stars brighter than with no omissions, although the usual caveats about unresolved binary stars and faint stars near bright stars apply. As noted above, we do not expect stars in Refcat2 with to have particularly accurate photometry although the coordinates should be quite good. These non-Gaia stars are a very small fraction (%) of Refcat2. Details are provided in Appendix A.
Matching between catalogs is done with a tolerance of 0.0002∘ (0.72″). Pathfinder and APASS use Gaia DR1 coordinates (epoch 2015.5), and Tycho and BSC are shifted to epoch 2015.5. Pan-STARRS DR1 is epoch 2013, but we did not shift Gaia coordinates to that (imprecise) epoch so a handful of high proper motion stars or stars with a very large parallax may have failed to match correctly. SkyMapper coordinates derive from UCAC4 (epoch 2000) so match failures will occur for stars with proper motion larger than 50 milliarcsec/yr, and similarly for APASS DR9.
For this master list we have Gaia data for most stars, 2MASS data for many stars, and photometry for all stars from a variety of sources, including Gaia, GMP, Pan-STARRS, SkyMapper, Pathfinder, APASS, APASS DR9, and Tycho-2/BSC, all put on the Pan-STARRS bandpasses using the relations above. We soften each star’s formal error of each magnitude by augmenting it in quadrature with a value that reflects what we consider each catalog’s systematic reliability to be: 0.1 for Gaia DR2 only (Table 3), 0.015 using the GMP regression but increasing when star colors leave the restricted GMP domain, 0.01 for Pan-STARRS but increasing by 1 mag/mag for , , , and and 0.1 mag/deg south of Dec ∘, 0.02 for SkyMapper, Pathfinder, and APASS, 0.05 mag for APASS DR9, and 0.1 magnitude for Tycho-2/BSC. The estimation of , , , and for each star is a straightforward process that converts each catalog’s data to Pan-STARRS bandpasses according to Tables 2 and 3, computes the weighted average for each star from all contributing catalogs, tests whether any contributor is worse than 3 and if so increases the error on the worst offender by twice its deviation, and iterating until no contributor deviates by more than 3. A bitmap is kept of all contributing catalogs to each final magnitude as well as a count of the number of times a contributor had its error increased.
In order to make Refcat2 more useful for observations that do not enjoy the spatial resolution of Pan-STARRS or Gaia, for each star in the catalog we calculate the distance to stars in the full Gaia DR2 that are bright enough to interfere with its photometry. We assemble the cumulative flux of neighboring stars in Gaia as a function of distance from each star and note the radius where this flux exceeds 0.1, 1.0, and 10 times the central star’s brightness, out to a maximum distance of 36″.
We also provide the total column extinction values at the location of each star from Schlegel et al. (1998). Although many stars will lie in front of some or all of the dust, this may prove to be helpful for some applications.
More details about the precise content of the catalog may be found in Appendix A.
6 Catalog properties
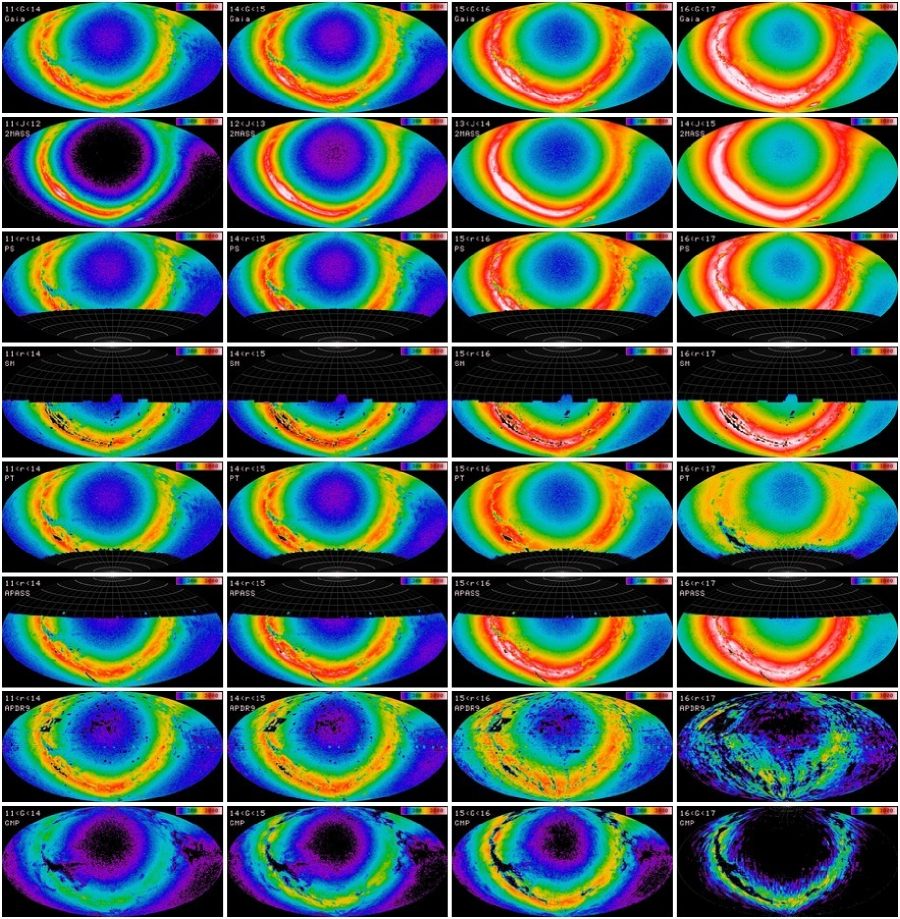
6.1 Star counts
Figure 2 shows the star counts in all the contributing surveys as a function of star brightness. The assembled Refcat2 looks no different than the Gaia counts because it includes all Gaia stars as well as a tiny fraction more. Many features are apparent, such as the progressive failure of Pathfinder to be able to discern crowded stars fainter than , the dramatically lower density of stars in GMP resulting from the severe selection filters applied, the tiny “crack in the sky” in the APASS counts, and of course the markedly different appearance of the galactic plane in the 2MASS -band.
Note that the APASS DR9 counts also show the APASS DR8 stars in the northern hemisphere, although these were not used in the production of Refcat2. Pan-STARRS loses stars in -band relative to the redder Gaia -band due to extinction, but the correspondence between the stars lists is nearly perfect at these bright magnitudes. The APASS counts are also very similar to Gaia for , although the completeness for begins to fall off.
6.2 Catalog comparisons with Refcat2
Figures 3 and 4 show the difference between the star magnitudes in each of eight catalogs relative to the final Refcat2. These are computed as the median difference between catalog’s star magnitudes (converted to Pan-STARRS bandpasses using the color terms of Table 2) and Refcat2, evaluated on each square degree of the sky. Pathfinder and APASS have , , and comparisons, and GMP, Pan-STARRS, and SkyMapper also have comparisons. The color palette stretches between and magnitudes.
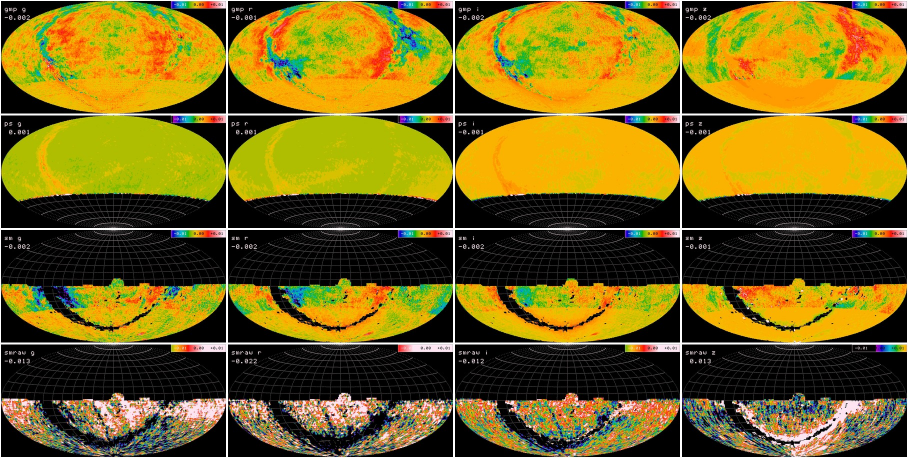
Close inspection of the GMP–Refcat2 comparison does not show any obvious Gaia scan pattern (although it is obvious if the DUPLICATE stars are not eliminated), but it is possible to discern tiny errors in Pan-STARRS: the 3∘ honeycomb pattern and 10∘ square chunk pattern can be seen at the 5 millimag level. Because of the heavy weighting given to Pan-STARRS these artifacts are not seen in the Pan-STARRS–Refcat2 comparison, indicating these features have been carried into Refcat2.
The third row of Figure 3 shows the DR1.1 SkyMapper magnitudes, spatially corrected on a degree scale to GMP. The roughness in the overlap region with Pan-STARRS is relatively large because its zeropoint is corrected by GMP, not Pan-STARRS. Some minor offsets from crowding are visible in the Large Magellanic Cloud. The fourth row shows the uncorrected SkyMapper DR1.1 comparison as a reference (but we do not use uncorrected magnitudes). The flaws that SkyMapper inherited by using zeropoints from APASS DR9 photometry are visible in this panel.
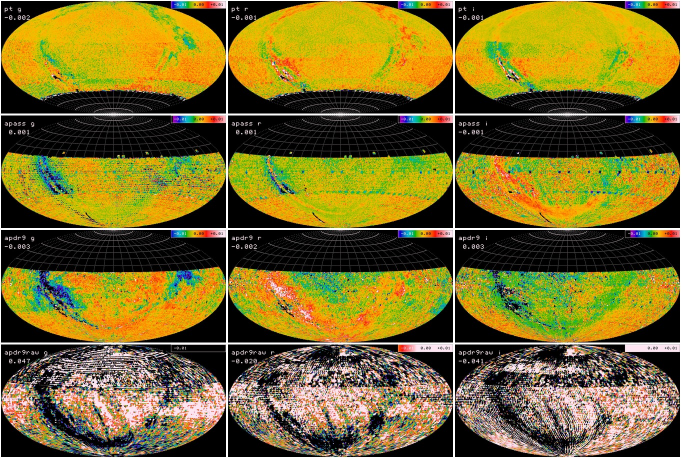
Figure 4 shows the comparison with Pathfinder, APASS as re-reduced for this work, and APASS DR9 published by the APASS project. The Pathfinder comparison looks a bit better than GMP where it overlaps with Pan-STARRS, presumably because the bandpasses are more closely matched (compare the top rows of Figures 3 and 4). The mild discontinuity at Dec ∘ shows the onset of southern systematic error in Refcat2. Pathfinder also reveals a honeycomb pattern on 5∘ scales at the 5 millimag RMS level arising from the Takahashi telescope vignetting and imperfect flattening.
The APASS comparison reveals the APASS footprint and the imperfections in the re-flattening we imposed. The APASS DR9 comparison is based on the magnitudes published by the APASS project corrected on a square degree basis by GMP, and the comparison looks somewhat different than the re-reduction of APASS above. Apart from the effects from our re-reduction of the images, the APASS DR9 is more than one magnitude shallower than the APASS re-reduction, so different stars are being compared. Some of the degree-by-degree roughness in these images stems from fluctuations in degrees with few matching stars. The fourth row in Figure 4 shows the APASS DR9 (and DR8 for Dec north of ∘) before correction by GMP. Not only are there large differences on degree and much larger scales, the mean offsets listed in the upper left are significant.
6.3 HST standards
The SkyMapper project integrated the Calspec set of HST standard star SEDs against the Pan-STARRS bandpasses to make predictions for magnitudes in , , , and -bands.777http://skymapper.anu.edu.au/filter-transformations/ We do not expect great accuracy for Refcat2 magnitudes brighter than because the only contributions are from Tycho-2, BSC, or Gaia, with rather gross color transformations to .
The difference between Refcat2 magnitude and HST Calspec magnitudes are shown in Figure 5 as a function of magnitude and color.
Restricting to stars fainter than we find the difference between Refcat2 and 36 HST standards to be , , , and . Restricting to stars fainter than the differences with respect to 17 HST standards is , , , and . We do not regard any of these differences to be significant enough to compel us to adjust the absolute zeropoint that has been set by GMP and its calibration against Pan-STARRS. There are 8 HST standards south of Dec ∘, but only 1 is fainter than . These scatter evenly among the northern stars and do not show any offset in any of these bandpasses, confirming that Refcat2 maintains all-sky accuracy even where Pan-STARRS makes no contribution.
6.4 Refcat2 errors and uncertainties
The photometry in Refcat2 has both statistical and systematic errors. The statistical errors listed for each star’s magnitude in Refcat2 are derived from the errors of extant catalogs and photometry, augmented by judicious systematic allowances according to the trustworthiness of zeropoint adjustments we have applied as well as the degree of color correction from catalog to standard Pan-STARRS bandpasses. The combination process of photometry from different catalogs appears to obey Gaussian statistics for most stars, which gives us confidence that the individual star magnitudes have reasonable error estimates. The distribution of /DOF and the frequency of outlier rejection provided in the catalog are consistent with a Gaussian distribution with a few percent tail from variable stars and other outliers. However Refcat2 remains a heterogeneous compilation at some level, and examination of magnitude error as a function of magnitude will reveal disjoint clumps according to the dominant contributor during the catalog combination.
It is difficult to be certain about systematic error and fidelity to absolute photometry. The comparison with the STScI Calspec standards affirms the absolute photometry heritage of Refcat2 through Pan-STARRS. Comparing Gaia with Pan-STARRS, two completely different sets of photometry with completely different processes to achieve internal consistency, is a means to understand the systematic errors that may be present in each.
The top two panels in Figure 3 illustrate the difference between GMP versus Refcat2 and Pan-STARRS versus Refcat2. The difference between Pan-STARRS and Refcat2 in the second panel is virtually non-existent, as expected because Pan-STARRS observations have lower error than any other contributor to Refcat2 and therefore strongly dominate the weighted average magnitudes for stars.
However, GMP is also fundamental to Refcat2 because it provides the normalization for the Pathfinder and APASS exposures that were re-reduced as well as the re-normalization of APASS DR9 and SkyMapper DR1.1. Therefore, by construction the difference between GMP and Refcat2 south of Dec ∘ is also very small.
We can therefore get a sense of the systematic inaccuracy of Refcat2 by looking at the discontinuity in the GMP–Refcat2 comparison north and south of Dec ∘. Figure 6 shows the GMP–Refcat2 comparison evaluated on square degrees in a pair of 4∘ wide strips immediately above and below the discontinuity.
The northern strip shows marked deviations from zero, exceeding millimag at particular locations although the RMS is much less than 10 millimag. band has the worst residuals: 5119 (coordinate) square degrees deviate by more than 5 millimag, 771 square degrees deviate by more than 10 millimag, and 23 square degrees deviate by more than 20 millimag. band never deviates by as much as 20 millimag, band deviates by at least 20 millimag on 5 square degrees, and band on 1 square degree. Formally the difference between GMP and Pan-STARRS evaluated on each square degree over the entire sky north of Dec ∘ has an RMS of about 2 millimag but of course it is the excursions that are of concern. Because the Pan-STARRS–Refcat2 comparison has no such deviations we can conclude that these reflects error in the GMP predictions for Pan-STARRS magnitudes. We presume that GMP is continuous and actually has errors akin to the ones visible in the north strip, and so Refcat2 has such errors south of Dec ∘. As noted above, the GMP–Refcat2 comparison north of Dec ∘ reveals hints of the Pan-STARRS footprint and chunks, so the northern part of Refcat2 surely also has systematic errors of at least 2 millimag.
Although the all-sky RMS is about 2 millimag, there are obvious coherent patches, particularly in and near the galactic anticenter where the GMP–Refcat2 difference is consistently around millimag. These patches remain from the density correction terms of Equation 2 that erased much bigger errors near the galactic plane. Although we have a suspicion that this has to do with Gaia–Pan-STARRS filter mismatch and gradients in stellar population or metallicity, we were unable to find an all-sky correlate with these features. It is also conceivable that the ubercal procedure that sets the internal consistency of the Pan-STARRS photometry has wandered because of poor constraints on large scale error. However, for our purposes this level of error is not important and we do not have an all-sky method to correct for it.
Therefore our summary assessment of the accuracy of Refcat2 is that by construction it matches Pan-STARRS north of Dec ∘ with an RMS systematic error of at least 2 millimag, and south of Dec ∘ it has an RMS systematic error of at least 3 millimag, except near the galactic center where systematic errors can occasionally grow to more than 20 millimag. However, note that these excursions are more correlated with stellar density than galactic latitude; the differences are small right on the plane because the extinction is so high that the star density is lower.
7 Summary and Conclusions
We have produced an all sky astrometric and photometric reference catalog (Refcat2) to meet the needs of the ATLAS project: all-sky uniformity, accuracy, and completeness for including the galactic plane.
We have merged data from the three publicly released star catalogs of Gaia, Pan-STARRS and SkyMapper. We supplemented this with new ATLAS Pathfinder survey data, and we re-processed APASS images in the southern sky to improve its photometric uniformity and fidelity. Addition of bright stars from Tycho-2 and the Yale Bright Star catalog filled in the brightest stars that affect observations even when saturated, and which are required by small aperture, very wide-field instruments. We have also added 2MASS near-infrared magnitudes for each object, when they exist, to remove the need for a user to do an extra catalog cross-match.
To our knowledge Refcat2 currently is the best single reference catalog for photometric calibration of wide-field surveys. The release of Gaia DR2 has obviously been a game changer for astrometry and we recognize the exquisite calibration by including the most important Gaia data in the catalog table. The salient features of the catalog are summmarised below; details on the content of Refcat2 are found in Appendix A.
-
•
Refcat2 lists 991 million stars between for which we provide magnitudes. In this context means the brightest of , , and magnitude. We believe Refcat2 is virtually complete to over the entire sky. Refcat2 also repeats the Gaia DR2 coordinates, parallax, proper motion, , , and magnitudes, as well as Gaia estimates of photosphere temperature and extinction. We augment this with Schlegel et al. (1998) extinction values, and we compute proximity statistics for each star’s neighbors that may interfere with photometry. 2MASS magnitudes are provided when available.
-
•
All photometry has been transformed to the Pan-STARRS , , , and bandpasses. Extension of the PS1 photometry to catalogs south of Dec ∘ and brighter than uses a two step procedure of identifying a small fraction of stars from the Gaia and 2MASS catalogs with well behaved photometric properties and determining relationships to convert Gaia and 2MASS photometry for these stars to the Pan-STARRS system (the GMP subset).
-
•
For reasons we do not fully understand, the GMP regressions produced residuals that depend on stellar sky density, possibly linked to a small photometry offset in Gaia when scanning high density fields. Whatever the reason, inclusion of a stellar density term in the regression equations removes the residual satisfactorily.
-
•
The GMP subset is then transformed as required to each catalog’s bandpasses to provide zeropoints of observations or mean offsets on a square degree basis. The uniformity of Gaia and 2MASS are the foundation for the uniformity of Refcat2 in the south and brighter than .
-
•
The Refcat2 magnitudes are weighted means from all contributing catalogues. Pan-STARRS has the greatest signal to noise in the transformed magnitudes, so north of Dec ∘ and fainter than Refcat2 magnitudes are effectively Pan-STARRS DR1 magnitudes.
-
•
Comparisons of Refcat2 with the GMP subset indicate that the RMS systematic error in Refcat2 is on the order of 3 millimag, but excursions in sytematic error as large as 20 millimag do appear for selected square degrees near the galactic plane.
-
•
Comparison of Refcat2 with synthetic magnitudes from the STScI Calspec set of stars reveal no significant offsets in any of the bandpasses, implying that Refcat2 agree with the Calspec system and Pan-STARRS bandpasses at the 5 millimag level or better.
The future operations of ATLAS in the south, ongoing SkyMapper operations and data releases, and Gaia Data Release 3 (expected around 2021) will lead to improvements, and we envisage revising this data product when these become available. The Large Synoptic Survey Telescope is expected to produce a definitive survey in the southern hemisphere with its first data release due around 2023, and extremely accurate photometry is part of its baseline requirement. Although LSST itself will saturate around , a calibration telescope is also planned which will be able to work to much brighter limits, so these should provide a useful cross-check on both the bright and faint end of Refcat2 when their calibrated results become available.
Appendix A Refcat2 Details
Refcat2 is served from MAST at the Space Telescope Science Institute (URL https://archive.stsci.edu/prepds/atlas-refcat2/). All our data products are available at MAST via http://doi.org/10.17909/t9-2p3r-7651 (catalog doi:10.17909/t9-2p3r-7651). STScI provides Refcat2 in a variety of formats: the basic bzip2 compressed tar archives with integer fields described here, other types of file compression, and a version that replaces the scaled integers with values that have the correct units. STScI also provides an interface into a database that permits cone searches and other queries. Finally STScI will match Refcat2 against the UV photometry from the Galex satellite and IR photometry from the WISE satellite, and provide those data as well.
Refcat2 is normally provided as a set of bzip2 compressed tar archives of 64800 files, one for each (coordinate) square degree in the sky. The file names reflect the coordinate location, rrr+dd.rc2. For example 270-20.rc2 is the square degree with and . The stars in each square degree file are sorted by increasing RA. The data are given in comma separated variable format (CSV), using scaled integers for all real numbers as described in Table 4. Abbreviations include “10ndeg” for degree, “10uas” for arcsecond, “mas” for arcsecond, and “mmag” for magnitude.
| Field | Name | Entry | Units | Meaning | Description |
|---|---|---|---|---|---|
| 1 | RA | 28000001672 | [10ndeg] | 280.00001672∘ | RA from Gaia DR2, J2000, epoch 2015.5 |
| 2 | Dec | 1967818581 | [10ndeg] | ∘ | Dec from Gaia DR2, J2000, epoch 2015.5 |
| 3 | plx | 98 | [10uas] | 0.98 mas | Parallax from Gaia DR2 |
| 4 | dplx | 10 | [10uas] | 0.10 mas | Parallax uncertainty |
| 5 | pmra | 114 | [10uas/yr] | 1.14 mas/yr | Proper motion in RA from Gaia DR2 |
| 6 | dpmra | 16 | [10uas/yr] | 0.16 mas/yr | Proper motion uncertainty in RA |
| 7 | pmdec | -1460 | [10uas/yr] | -14.60 mas/yr | Proper motion in Dec from Gaia DR2 |
| 8 | dpmdec | 15 | [10uas/yr] | 0.15 mas/yr | Proper motion uncertainty in Dec |
| 9 | Gaia | 15884 | [mmag] | 15.884 | Gaia DR2 magnitude |
| 10 | dGaia | 1 | [mmag] | 0.001 | Gaia DR2 magnitude uncertainty |
| 11 | BP | 16472 | [mmag] | 16.472 | Gaia magnitude |
| 12 | dBP | 10 | [mmag] | 0.010 | Gaia magnitude uncertainty |
| 13 | RP | 15137 | [mmag] | 15.137 | Gaia magnitude |
| 14 | dRP | 1 | [mmag] | 0.001 | Gaia magnitude uncertainty |
| 15 | Teff | 4729 | [K] | 4729 K | Gaia stellar effective temperature |
| 16 | AGaia | 895 | [mmag] | 0.895 | Gaia estimate of -band extinction for this star |
| 17 | dupvar | 2 | 2 | Gaia flags coded as CONSTANT (0), VARIABLE (1), or NOT_AVAILABLE (2) + 4*DUPLICATE | |
| 18 | Ag | 1234 | [mmag] | 1.234 | SFD estimate of total column -band extinction |
| 19 | rp1 | 50 | [0.1″] | 5.0″ | Radius where cumulative flux exceeds 0.1 this star |
| 20 | r1 | 50 | [0.1″] | 5.0″ | Radius where cumulative flux exceeds 1 this star |
| 21 | r10 | 155 | [0.1″] | 15.5″ | Radius where cumulative flux exceeds 10 this star |
| 22 | g | 16657 | [mmag] | 16.657 | Pan-STARRS magnitude |
| 23 | dg | 10 | [mmag] | 0.010 | Pan-STARRS magnitude uncertainty |
| 24 | gchi | 23 | [0.01] | 0.23 | for contributors to |
| 25 | gcontrib | 1f | [%02x] | 00011111 | Bitmap of contributing catalogs to |
| 26 | r | 15915 | [mmag] | 15.915 | Pan-STARRS magnitude |
| 27 | dr | 12 | [mmag] | 0.012 | Pan-STARRS magnitude uncertainty |
| 28 | rchi | 41 | [0.01] | 0.41 | for contributors to |
| 29 | rcontrib | 3f | [%02x] | 00111111 | Bitmap of contributing catalogs to |
| 30 | i | 15578 | [mmag] | 15.578 | Pan-STARRS magnitude |
| 31 | di | 10 | [mmag] | 0.010 | Pan-STARRS magnitude uncertainty |
| 32 | ichi | 49 | [0.01] | 0.49 | for contributors to |
| 33 | icontrib | 0f | [%02x] | 00001111 | Bitmap of contributing catalogs to |
| 34 | z | 15346 | [mmag] | 15.346 | Pan-STARRS magnitude |
| 35 | dz | 12 | [mmag] | 0.012 | Pan-STARRS magnitude uncertainty |
| 36 | zchi | 0 | [0.01] | 0.00 | for contributors to |
| 37 | zcontrib | 06 | [%02x] | 00000110 | Bitmap of contributing catalogs to |
| 38 | nstat | 0 | 0 | Count of deweighted outliers | |
| 39 | J | 14105 | [mmag] | 14.105 | 2MASS J magnitude |
| 40 | dJ | 36 | [mmag] | 0.036 | 2MASS J magnitude uncertainty |
| 41 | H | 14105 | [mmag] | 14.105 | 2MASS H magnitude |
| 42 | dH | 53 | [mmag] | 0.053 | 2MASS H magnitude uncertainty |
| 43 | K | 13667 | [mmag] | 13.667 | 2MASS K magnitude |
| 44 | dK | 44 | [mmag] | 0.044 | 2MASS K magnitude uncertainty |
When a magnitude is not available (for example 2MASS at the faint end or for non-Gaia stars) the magnitude and its uncertainty are set to 0, otherwise the magnitude uncertainty is given as at least 1 millimag.
The band total column extinction Ag is computed from the values of Schlegel et al. (1998), multiplied by 0.88 as recommended by Schlafly & Finkbeiner (2011), and also by (Tonry et al., 2012).
The proximity statistics rp1, r1, and r10 are derived by summing the cumulative band flux of all Gaia stars as a function of distance from each star, and reporting the radius where this flux first exceeds 0.1 (rp1), 1 (r1), and 10 (r10) times the flux of the star. These are given the value 999 (99.9″) when a star is so isolated that the cumulative flux never reaches the threshold within the 36″ search radius.
The griz-contrib entries identify contributors to the magnitudes. Bits 0–7 are set when a catalog contributes to the statistical average with magnitude uncertainty less than 0.2: Gaia DR2 (bit 0), GMP (bit 1), Pan-STARRS (bit 2), SkyMapper (bit 3), Pathfinder (bit 4), APASS (bit 5), APASS DR9 (bit 6), and Tycho-2/BSC (bit 7). For example the code rcontrib=06 implies that contributions with uncertainty less than 0.2 mag came from GMP and Pan-STARRS.
Gaia DR2 does not include all bright stars; Polaris is missing, for example, as well as a star at RA 93.7759, Dec +15.0451. Stars found in the contributing catalogs that are no closer than 3.6″ (PanSTARRS, SkyMapper, and Tycho/BSC) or 10.8″ (Pathfinder and APASS) to the nearest Gaia star are added to Refcat2 with zero values for all Gaia-specific quantities. A real star can therefore be inhibited from inclusion because Gaia DR2 lists a faint star nearby, except for Tycho/BSC for which the Gaia match must be within 2 magnitudes of the non-Gaia candidate. A non-Gaia star may be identified in Refcat2 because it will always have dGaia = 0.
Examining a statistical sample of these non-Gaia objects, we see a change in behavior around , where the Tycho-2 catalog ends. About 78% of the non-Gaia inclusions in Refcat2 brighter than really are stars, about 18% are double star blends mostly from APASS DR9, and the remainder are bright galaxies, completely false triggers (often in the outskirts of a bright star), or coordinates that did not link with the Gaia stars (possibly a transient). The double star blends almost always have the individual stars also present in Refcat2 as Gaia-matching entries. About 0.25% of the stars with in Refcat2 do not appear in Gaia DR2; 8946 stars in Refcat2 brighter than are missing from Gaia DR2.
Fainter than the fractions of stars, galaxies, and false triggers near bright stars change discontinuously. About 31% appear to be real stars, 27% appear to be diffraction artifacts from bright stars, 23% are galaxies, and 19% are probably transients, eruptive stars, or errors. About 0.1% of Refcat2 is not found in Gaia DR2 for these fainter sources.
A Refcat2 user should therefore use these non-Gaia objects according to application. If a relatively complete sample of stars is needed for an astrometric or photometric solution there is no reason to include any non-Gaia stars and selecting on dGaia > 0 may be advisable. If the user wants to know whether there is a star with within a degree, then using the non-Gaia entries is mandatory. If a detection appears in a difference image it is a good idea to check the non-Gaia entries as well for the identity of the object, but there is a chance (0.1%) that a non-Gaia entry may not really be a bona fide star at the specified location.
A small fraction of Refcat2 entries are galaxies, inherited from Gaia DR2 and Pan-STARRS. Comparing a subset of Refcat2 objects with SDSS DR12 star/galaxy identifications and using Pan-STARRS (Kron-PSF) magnitudes, we find a galaxy contamination rate that depends on magnitude and galactic latitude. For and the contamination is about 1.5%, rising to 10% for . For the contamination is about 2% for . Overall for the galaxy fraction is less than 1%. Virtually all galaxies can be rejected by selecting objects for which Gaia provides a non-zero proper motion uncertainty, dpmra and dpmdec, at the cost of about 0.7% of all real stars.
Parenthetically, users interested in transforming Refcat2 to SDSS should not use the relations of Tonry et al. (2012) which are appropriate for SDSS DR7. SDSS photometry evolves with each release, so although the color terms of Tonry et al. (2012) may still be correct, the offsets are not.
The catalog is distributed in five magnitude chunks without overlap, (00_m_16.tbz, 105M stars, 5.9GB), (16_m_17.tbz, 107M stars, 5.6GB), (17_m_18.tbz, 204M stars, 9.8GB), (18_m_19.tbz, 369M stars, 17GB), and (19_m_20.tbz, 206M stars, 8.7GB). Any star that has () where is the brightest of , , and lies in the second chunk, etc. There are red stars with that appear in the first chunk because , but a user who wants a complete sample with , for example, needs only examine the first two chunks. Stars appear in the fifth chunk with because our Pan-STARRS selection also includes red stars with , but that chunk is very incomplete.
The entire compressed catalog amounts to about 50 bytes per star (about 1 byte per field), depending on how many fields are populated. The expectation is that users will select a subset of stars and fields chosen according to their application, which can greatly reduce the size and increase the access speed of a database table. The data are partitioned into square degree files so that a survey such as ATLAS, whose field of view will typically touch 40 such files, can dispense with a database and simply use the file system to rapidly return all the stars in a given exposure.
Appendix B Pan-STARRS catalog query
This is the query used to select objects with from Pan-STARRS DR1 at the STScI MAST
archive888http://mastweb.stsci.edu/ps1casjobs/,
as described in Section 2.3.
select raMean, decMean, gMeanPSFMag, gMeanPSFMagErr, rMeanPSFMag, rMeanPSFMagErr,
iMeanPSFMag, iMeanPSFMagErr, zMeanPSFMag, zMeanPSFMagErr, yMeanPSFMag, yMeanPSFMagErr
from ObjectThin join MeanObject on objectThin.uniquePspsOBid = meanObject.uniquePspsOBid
join stackObjectThin on objectThin.objID = stackObjectThin.objID
where bestdetection = 1 and primarydetection = 1 and ((gKronMag
19 and gKronMag 0)
or (rKronMag 19 and rKronMag 0 ) or (iKronMag 19 and iKronMag 0)
or (zKronMag 19 and zKronMag 0))
This query does not attempt to do any star-galaxy separation. The Pan-STARRS catalog flag QF_OBJ_EXT (which implies a likely extended object) indicates that about 12% of sources could potentially be galaxies. However only a tiny fraction of these sources do not match Gaia (%), and only a quarter of those appear to be galaxies, so the galaxy contamination should be minimal.
References
- Alonso-Garcia et al. (2012) Alonso-Garcia, J., Mateo, M., Sen, B., Banerjee, M., Catelan, M., Minniti, M., & von Braun, K., 2012, AJ, 143, 70
- Bohlin et al. (2001) Bohlin, Dickinson, & Calzetti, 2001, AJ, 122, 2118
- Bohlin (2007) Bohlin, R. C. 2007, ASP Conf. Ser., Vol. 364, The Future of Photometric, Spectrophotometric and Polarimetric Standardization, ed. by C. Sterken, p. 315
- Bohlin (2014) Bohlin, R. C. 2014, AJ, 147, 127
- Chambers et al. (2016) Chambers K. C., et al., 2016, arXiv, arXiv:1612.05560
- Flewelling et al. (2016) Flewelling H. A., et al., 2016, arXiv, arXiv:1612.05243
- Finkbeiner et al. (2016) Finkbeiner, D. P., Schlafly, E. F., Schlegel, D. J., et al. 2016, ApJ, 822, 66
- Fukugita et al. (1996) Fukugita, M., Ichikawa, T., Gunn, J. E., et al. 1996, AJ, 111, 1748
- Fukugita et al. (2011) Fukugita, M., Yasuda, N., Doi, M., Gunn, J. E., & York, D. G. 2011, AJ, 141, 47
- Gaia Collaboration et al. (2016) Gaia Collaboration, Brown, A. G. A., Vallenari, A., et al. 2016, A&A, 595, A2
- Gaia Collaboration et al. (2018) Gaia Collaboration, Brown, A. G. A., Vallenari, A., et al. 2018, arXiv:1804.09365
- Heinze et al. (2018) Heinze, A. N., Tonry, J. L., Denneau, L., et al. 2018, arXiv:1804.02132
- Henden et al. (2016) Henden, A. A., Templeton, M., Terrell, D., et al. 2016, VizieR Online Data Catalog, 2336,
- Hoffleit (1964) Hoffleit, D. 1964, New Haven, Conn: Yale University Observatory, 1964, 3rd rev.ed., edited by Hoffleit, Dorrit
- Hoffleit & Warren (1995) Hoffleit D., Warren W. H., Jr., 1995, yCat, 5050,
- Høg et al. (2000) Høg E., et al., 2000, A&A, 357, 367
- Lang et al. (2010) Lang D., Hogg D. W., Mierle K., Blanton M., Roweis S., 2010, AJ, 139, 1782
- Lowry et al. (2007) Lowry, S. C., Fitzsimmons, A., Pravec, P., et al. 2007, Science, 316, 272
- Magnier et al. (2016a) Magnier, E. A., Chambers, K. C., Flewelling, H. A., et al. 2016a, arXiv:1612.05240
- Magnier et al. (2016b) Magnier, E. A., Sweeney, W. E., Chambers, K. C., et al. 2016b, arXiv:1612.05244
- Magnier et al. (2016c) Magnier, E. A., Schlafly, E. F., Finkbeiner, D. P., et al. 2016c, arXiv:1612.05242
- Padmanabhan et al. (2008) Padmanabhan, N., Schlegel, D. J., Finkbeiner, D. P., et al. 2008, ApJ, 674, 1217
- Pickles & Depagne (2010) Pickles, A., & Depagne, É. 2010, PASP, 122, 1437
- Schechter et al. (1993) Schechter, P. L., Mateo, M., & Saha, A. 1993, PASP, 105, 1342
- Schlafly & Finkbeiner (2011) Schlafly, E. F., & Finkbeiner, D. P. 2011, ApJ, 737, 103
- Schlafly et al. (2012) Schlafly, E. F., Finkbeiner, D. P., Jurić, M., et al. 2012, ApJ, 756, 158
- Schlegel et al. (1998) Schlegel, D. J., Finkbeiner, D. P., & Davis, M. 1998, ApJ, 500, 525
- Skrutskie et al. (2006) Skrutskie, M. F., Cutri, R. M., Stiening, R., Weinberg, M. D., et al. 2006, AJ, 131, 1163
- Tonry et al. (2012) Tonry J. L., et al., 2012, ApJ, 750, 99
- Tonry et al. (2018) Tonry, J. L., Denneau, L., Heinze, A. N., et al. 2018, PASP, 130, 064505
- van Leeuwen (2007) van Leeuwen, F. 2007, A&A, 474, 653
- Vereš et al. (2015) Vereš, P., Jedicke, R., Fitzsimmons, A., et al. 2015, Icarus, 261, 34
- Waters et al. (2016) Waters, C. Z., Magnier, E. A., Price, P. A., et al. 2016, arXiv:1612.05245
- Wolf et al. (2018) Wolf, C., Onken, C. A., Luvaul, L. C., et al. 2018, PASA, 35, 10
- Zacharias et al. (2010) Zacharias N., et al., 2010, AJ, 139, 2184