An XMM-Newton observation of the symbiotic star AG Peg: the X-ray emission after the end of its 2015 outburst
Abstract
We present an analysis of the XMM-Newton observation of the symbiotic star AG Peg, obtained after the end of its 2015 outburst. The X-ray emission of AG Peg is soft and of thermal origin. AG Peg is an X-ray source of class of the X-ray sources amongst the symbiotic stars, whose X-ray spectrum is well matched by a two-temperature optically-thin plasma emission ( keV and keV). The X-ray emission of the class sources is believed to originate from colliding stellar winds (CSW) in binary system. If we adopt the CSW picture, the theoretical CSW spectra match well the observed properties of the XMM-Newton spectra of AG Peg. However, we need a solid evidence that a massive-enough hot-star wind is present in the post-outburst state of AG Peg to proof the validity of the CSW picture for this symbiotic binary. No short-term X-ray variability is detected while the UV emission of AG Peg shows stochastic variability (flickering) on time-scales of minutes and hours.
keywords:
shock waves – stars: individual: AG Peg – stars: binaries: symbiotic – X-rays: stars.1 Introduction
AG Peg (HD 207757) is a symbiotic nova whose first recorded outburst occurred in the mid-19th century. This is likely the slowest classical nova eruption amongst recorded until present day (e.g., Kenyon et al. 1993; Kenyon, Proga & Keyes 2001 and references therein). During the time of declining brightness (lasting for many decades), AG Peg has passed through various spectral phases, as signs of new active phase were recently reported both in the optical (Munari et al., 2013) and in X-rays (Nunez & Luna 2013; Luna et al. 2015; Ramsay et al. 2015). In fact, 2015 marked an outburst111Throughout this text, the term outburst will be used to denote the 2015 activity of AG Peg. of AG Peg with two brightness maxima in the optical and the corresponding analysis indicated that AG Peg became a member of the classical symbiotic stars group (Tomov et al. 2016; Ramsay et al. 2016; Skopal et al. 2017).
In X-rays, AG Peg was observed numerous times. It was first detected with ROSAT (Mürset et al., 1995) years before its active phase in 2015. The X-ray emission of this pre-outburst state was soft likely originating from an optically thin plasma with a temperature of a few 106 K, which marked AG Peg as a member of the class of the X-ray sources amongst symbiotic stars (Mürset et al., 1997). We note that the X-ray emission of these sources is believed to originate from colliding stellar winds (CSW) in binary system (e.g., Mürset et al. 1997; Luna et al. 2013).
The Swift observations during the 2015 outburst revealed considerable X-ray variability on time-scales of days that resembles the characteristics of the flicker noise (flickering), typical for accretion processes in astrophysical objects (Zhekov & Tomov, 2016). But, the X-rays might originated in shocks from the ejecta (Ramsay et al., 2016). Such a diversity of properties of the X-ray emission from AG Peg justifies the need of follow-up observations and such were proposed.
In this paper, we report results from the XMM-Newton observation of AG Peg, carried out after the end of its active phase in 2015. In Section 2, we review the observational data. In Section 3, we present results from analysis of the X-ray emission of AG Peg. In Section 4, we discuss our results and Section 5 present our conclusions.
2 Observations and data reduction
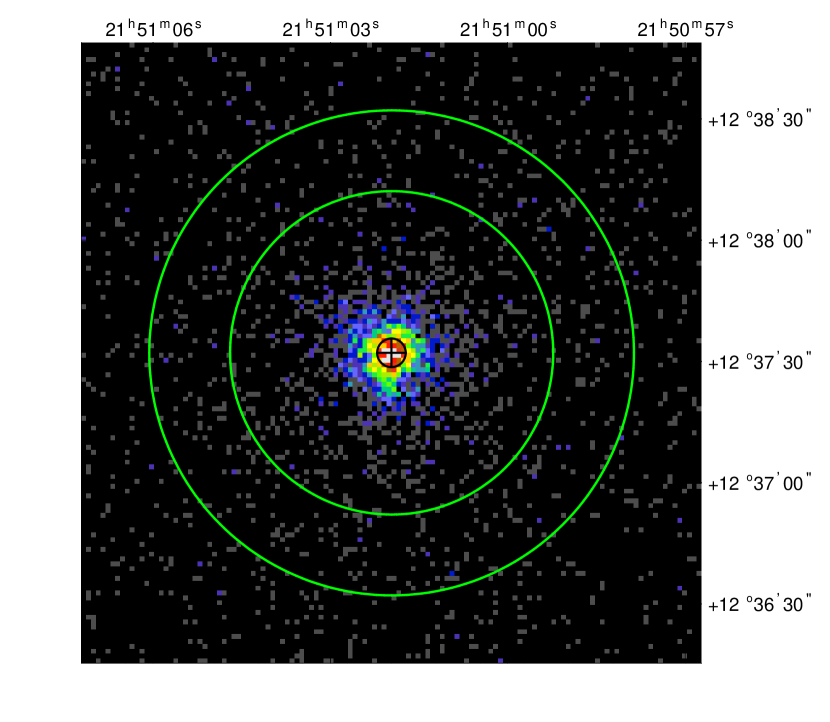
AG Peg was observed with XMM-Newton on 2017 Nov 16 (Observation ID 0800420101) with a nominal exposure of ks. The source was clearly detected in X-rays (see Fig. 1) and good quality data were acquired with the European Photon Imaging Camera (EPIC) having one pn and two MOS detectors. We made use of the data from the two instruments of the Reflected Grating Spectrometer (RGS) as well, but we note that these data had quite limited photon statistics. The XMM-Newton Optical Monitor (OM)222for EPIC, RGS and OM see § 3.3, 3.4 and 3.5 in the XMM-Newton Users Handbook, https://xmm-tools.cosmos.esa.int/external/xmm_user_support/documentation/uhb/ telescope allows for obtaining optical/UV data on a given target simultaneously with its X-ray data. Thus, six UV exposures in UVM2 filter were obtained that provided good quality UV light curves of AG Peg.
X-rays. For the data reduction, we made use of the XMM-Newton sas333Science Analysis Software, https://xmm-tools.cosmos.esa.int/external/xmm_user_support/documentation/sas_usg/USG/ 16.1.0 data analysis software. The sas pipeline processing scripts emproc, epproc and rgsproc were executed to incorporate the most recent calibration files (as of 2017 December 20). The data were then filtered for high X-ray background following the instructions in the sas documentation. The corresponding sas procedures were adopted to generate the response matrix files and ancillary response files for each spectrum. The MOS spectrum in our analysis is the sum of the spectra from the two MOS detectors. The extracted EPIC spectra (0.2 - 10 keV) of AG Peg had source counts in the 10.5-ks pn effective exposure and source counts in the 28.2-ks MOS effective exposure. The high-resolution spectra had only (RGS1) and (RGS2) source counts in the 29.4-ks effective exposure. Also, we constructed the pn and MOS1,2 background-subtracted light curves of AG Peg.
UV. We used the pipeline background-subtracted light curves of AG Peg in the UVM2 filter (effective wavelength and width of 2310 Å and 480 Å, respectively) in units of counts s-1 which can be presented also in magnitudes using the zeropoint for the UVM2 filter.
For the spectral analysis, we used standard as well as custom models in version 12.9.1 of xspec (Arnaud, 1996).
3 Results


3.1 An overview of the X-ray emission
The XMM-Newton observation of AG Peg provided data of much better quality (e.g., photon statistics, spectral resolution) than that of the previous X-ray observations (ROSAT, Swift) of this object. This allows us to better constrain the properties of its X-ray emission.
An important piece of information comes from the XMM-Newton dispersed spectra of AG Peg. Namely, emission lines of various ionic species are detected. Figure 2 shows RGS1 and RGS2 data for the strongest H-like doublets (NVII and OVIII) and the OVII He-like triplet. Although the photon statistics of these spectra is not high, the line detection is reliable (at a level): (NVII), (OVIII) and (OVII) source counts. Other lines as the FeXVII 15.01, 15.21 Å and 16.78, 17.05, 17.10 Å are also detected but at lower confidence level.
We fitted the H-like doublets with a sum of two Gaussians and a constant continuum. The centres of the doublet components were held fixed according to the AtomDB database (Atomic Data for Astrophysicists)444For AtomDB see http://www.atomdb.org/ and the components shared the same line width and line shift. The component intensity ratio was fixed at its atomic data value. The OVII He-like triplet was considered in a similar manner but its component ratios were free parameters of the fit. For these fits, we made use of the implementation of the Cash statistic (Cash, 1979) in xspec, which gives robust results for model fits of data with low photon counts.
The basic results from these fits are as follows. The strong emission lines show no appreciable line shifts (all are consistent with zero-shifts) and the line widths (full width at half maximum, FWHM) are of the order of 700-1500 km s-1 . But, it should be kept in mind that the dispersed spectra of AG Peg have quite limited photon statistics, so, these fit results could be affected by that. Nevertheless, we note that the forbidden line (at 22.1 Å) in the OVII He-like triplet is not suppressed as seen from Fig. 2 and its ratio to the inter-combination line (at 21.8 Å) is . We will return to this result in Section 4.
However, the most important result from the dispersed spectra of AG Peg is that emission lines are indeed detected. This is a solid evidence that the X-ray emission of AG Peg in 2017 is of thermal origin, that is it originates in optically thin thermal plasmas.
Since the X-ray source is thermal and almost all of its emission is at energies below 2 keV (see Fig. 3 and Section 3.2), it is conclusive that AG Peg in 2017 (XMM-Newton observation) is of the class of the X-ray sources amongst the symbiotic stars (for the X-ray source classification see Mürset et al. 1997 and Luna et al. 2013).
| Parameter | 2T vapec |
|---|---|
| /dof | 168/151 |
| NH (1021 cm-2) | 0.77 |
| kT1 (keV) | 0.14 |
| kT2 (keV) | 0.66 |
| EM1 ( cm-3) | 1.78 |
| EM2 ( cm-3) | 3.32 |
| O | 0.67 |
| Ne | 0.86 |
| Mg | 0.39 |
| Si | 0.20 |
| Fe | 0.23 |
| FX ( ergs cm-2 s-1) | 6.33 (11.8) |
| FX,hot ( ergs cm-2 s-1) | 4.73 (7.33) |
| LX ( ergs s-1) | 9.06 |
Notes. Results from simultaneous fits to the EPIC spectra of AG Peg. Tabulated quantities are the neutral H absorption column density (NH), plasma temperature (kT), emission measure (), the absorbed X-ray flux (FX; 0.2 - 8 keV) followed in parentheses by the unabsorbed value (FX,hot denotes the higher-temperature component, kT2), the X-ray luminosity LX (0.2 - 8 keV). The EM and LX values assume a reference distance of 800 pc (Kenyon et al. 1993; Kenyon et al. 2001), The derived abundances are with respect to the solar abundances (Anders & Grevesse, 1989). Errors are the values from the fits.
3.2 Global Spectral Models
To derive some physical properties of the thermal plasma responsible for the X-ray emission from AG Peg, we fitted the observed spectra (pn, MOS) with models of absorbed optically thin plasma emission. The pn and MOS spectra were fitted simultaneously sharing identical model parameters. In the spectral fits, the H, He, C and N abundances had the values derived by Schmutz (1996): H : He : C : N = 1 : 0.1 : : by number (H , He , C = , N with respect to the solar abundances; Anders & Grevesse 1989). To improve the quality of the fits, the abundances of some elements (O, Ne, Mg, Si and Fe) were allowed to vary.
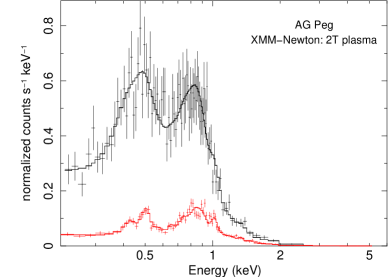
We performed one- and two-temperature plasma model fits: the latter provides a better match to the observed spectra (the goodness of the fit is 0.0008 for the former and 0.17 for the latter). Table 1 and Fig. 3 present the corresponding results from the two-temperature fit to the undispersed XMM-Newton spectra of AG Peg.
As seen from Fig. 3, the X-ray emission from AG Peg is soft: almost all the photons have energy keV. In terms of observed flux, its part in the 0.2 - 2 keV energy range comprises 96 per cent of the total observed flux in the 0.2 - 8 keV range (for the latter see Table 1).
Such a soft emission is naturally produced by thermal plasma with relatively low temperature as derived in the spectral fits. We note that the two-component plasma model adopted here, which is a good representation of the observed spectrum, in fact indicates a distribution of plasma in AG Peg. Namely, the X-ray emitting region of AG Peg is likely temperature stratified and the hotter the plasma the higher its emission measure.
The derived value of the hydrogen absorption column density is equivalent to a range of optical extinction A mag. The range corresponds to the conversion that is used: NAV cm-2 (Gorenstein, 1975). and NAV cm-2 (Vuong et al. 2003, Getman et al. 2005). Thus, we find no indication for any X-ray absorption in considerable excess to the optical extinction to AG Peg (E mag; Kenyon et al. 1993; E mag; Vogel & Nussbaumer 1994), although the derived values of the X-ray absorption may mean some slight increase of the circumstellar absorption after the end of the outburst of AG Peg in 2015.
Finally, it is worth noting that the X-ray emission of AG Peg in 2017 returned to its level before the outburst of this object in 2015. The 2017 observed flux in the 0.3 - 3 keV energy range of ergs cm-2 s-1 is about a factor of 2 lower than the average flux in 2015 and comparable to the value of the pre-outburst observations in 2013 (see table 1 and fig. 2 in Zhekov & Tomov 2016).
3.3 Variability
The XMM-Newton observation of AG Peg allows to search for variability on time-scale less than ks both in X-rays and in UV. To check for variability, we fitted each LC with a constant, adopting fitting.
In X-rays, we made use of the light curves from the MOS1 and MOS2 detectors, adopting various binning. On a time-scale less than 30 ks and time bins between 100 and 1000 s, the X-ray light curves were statistically consistent with a constant flux. This result is confirmed for the LC from the pn detector: it spans only ks due to considerable loss of the exposure due to high X-ray background. The MOS1 and MOS2 LCs binned at 600 s are shown in Fig. 4.
In UV, we made use of the LCs from all six individual exposures, also adopting different binning between 10 (original time bin) and 300 s. No matter the time-bin size, stochastic variability (flickering) was always present and in all the individual exposures. This result does not depend on the format of the light curve: it is valid for the LCs in flux units (counts s-1) and in magnitudes. Also, we calculated the power spectrum for each LC but no periodic signal was detected on time scales smaller than the time extent of the corresponding LC. The individual UV LCs (binned at 60 s) and the total UV LC (binned at 120 s) are given in Fig. 4.
Such a different behaviour of the X-ray and UV light curves likely indicates that the X-ray and UV emissions originate from different regions in AG Peg and are subject to different formation mechanisms.
4 Discussion
From analysis of the first AG Peg detection with ROSAT, Mürset et al. (1995) reported soft X-ray emission from an optically thin plasma with a temperature of a few K. These authors suggested that the X-ray emission likely originates from colliding stellar winds (CSWs), that is from the interaction region of the winds from the cool and hot stellar components in this symbiotic binary.
During the active phase of AG Peg in 2015, Swift observations revealed considerable X-ray variability (flickering) on time-scale of days as variability on shorter time-scale might have been present as well, which means that some other mechanism, not CSWs, was responsible for the X-ray emission of the active phase (Zhekov & Tomov, 2016).
XMM-Newton observed AG Peg in 2017, that is after the end of its active phase, and the basic characteristics of its X-ray emission were quite similar to those from the early ROSAT observation (Section 3). Namely, the X-ray emission of AG Peg is soft and its spectrum is well matched by emission from optically thin, and temperature stratified, plasmas of a few K.
Such similarities justify considering the X-ray emission from AG Peg in 2017 in the framework of the CSW picture in some more detail and in comparison with a similar consideration of the ROSAT spectrum of AG Peg.
We note that the ROSAT spectrum considered in this study is the same one as in Zhekov & Tomov (2016): its data reduction and spectral extraction are described in section 2 therein. It is worth recalling that the ROSAT spectrum is not of that high quality as the EPIC spectra are: it has only source counts (to compare with source counts in the pn and MOS spectra; see Section. 2).


4.1 CSW model spectra
We note that a direct comparison between the CSW model and observed X-ray emission of AG Peg was presented in Zhekov & Tomov (2016). Here, we will adopt the same approach and we will briefly recall below the basic characteristics of that CSW model and some changes of its as well.
The basic input parameters for the hydrodynamic model in CSW binaries are the mass loss and velocity of the stellar winds of the binary components and the binary separation. They determine the shape and the structure of the CSW interaction region, that is the physical parameters (density, temperature, velocity, emission measure) of the shocked plasma (Lebedev & Myasnikov 1990; Luo et al. 1990; Stevens et al. 1992; Myasnikov & Zhekov 1993).
Given the values of the input parameters, some dimensionless parameters are introduced that indicate whether or not some physical processes are important that may affect the X-ray emission of the interaction region. For example, the importance of the radiative losses is indicated by either of dimensionless parameters (Stevens et al., 1992) and (Myasnikov & Zhekov, 1993). The importance of partial electron heating behind strong shocks is given by the value of dimensionless parameter (Zhekov & Skinner, 2000). The dimensionless parameter (Zhekov, 2007) determines the importance of the non-equilibrium ionization effects (NEI) for the X-ray emission from the CSW region.
And, given the results from the CSW hydrodynamic model (the latter is based on the 2D numerical hydrodynamic model of CSW by Lebedev & Myasnikov 1990, see also Myasnikov & Zhekov 1993), we run the corresponding CSW model in xspec that is used to directly fit the observed X-ray spectrum of the studied binary. We note that our CSW models were originally developed in the xspec version 11.3.2 (Zhekov, 2007) but they can now be used in xspec 12.9.1, thus, allowing for using the recent atomic data (see section 4.1 in Zhekov 2017 for more details on the CSW models and fitting procedure).
For the CSW spectral models of AG Peg, we adopted the same stellar wind and binary parameters as in Zhekov & Tomov (2016). Namely, the mass-loss rates and wind velocities are based on Mürset et al. (1995) and Schmutz (1996): M⊙ yr-1 , km s-1 , M⊙ yr-1 , km s-1 (the notations and stand for the hot star and cool star, respectively). The binary separation of cm comes from Kepler’s third law for an adopted period of 818.2 days (Fekel et al., 2000) and assuming a total binary mass of 2 solar masses. For the distance to AG Peg, we used the value of d pc (Kenyon et al. 1993; Kenyon et al. 2001). We recall that for these wind and binary parameters the dimensionless parameters (, , , ) suggest (Zhekov & Tomov, 2016): (a) the CSWs in AG Peg (the shocked HS plasma) will be adiabatic; (b) the temperature equalization is very fast (that is, the electron and ion temperatures are equal in the shocked plasma); (c) the NEI effects do not play an important role (the hot plasma is in collisional equilibrium ionization, CIE).
For the abundances, we adopted the same values as in the case of discrete-temperature spectral models (Section 3.2) and for the spectra with good photon statistics (pn, MOS) the abundances of N, O, Ne, Mg, Si and Fe were allowed to vary to improve the quality of the fits.
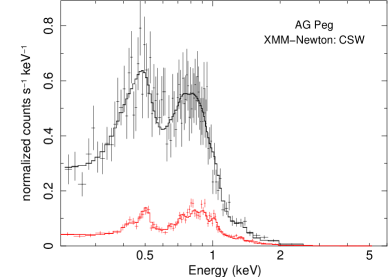
We ran a series of CSW spectral models to fit the X-ray spectra of AG Peg. This was done both for the XMM-Newton spectra obtained in 2017 and for the ROSAT spectrum obtained in 1993. Table 2 and Fig. 5 present some of the fit results.
It should be noted that the quality of the fits is good: the CSW model matches well the shape of the observed XMM-Newton and ROSAT spectra. However, to get a good correspondence between the theoretical flux (emission measure) and that observed the mass-loss rates in AG Peg had to be changed with respect to their nominal values: by a factor of 1.06 in the case of the ROSAT spectrum and with a factor of 1.86 in the case of the XMM-Newton spectra.
For the XMM-Newton spectra, the derived value of the X-ray absorption from the CSW model is very similar to that from the fit with the discrete-temperature model (Table 1), that is it is in general consistent with the optical extinction to AG Peg, as discussed in Section 3.2. The latter is true also for the X-ray absorption derived from the CSW model fit to the ROSAT spectrum of AG Peg.
Interestingly, the observed flux in the (0.1 - 2 keV) energy range in the pre-outburst (ROSAT) and post-outburst (XMM-Newton) state of AG Peg is virtually the same. The % difference is within the associated confidence interval on the flux: F (ROSAT) and (XMM-Newton) in units of ergs cm-2 s-1. Thus, using the same physical model (picture) we find again (see also Section 3.2) that the pre-outburst and post-outburst states in AG Peg have very similar level of X-ray emission.
We see that the CSW model is capable of explaining the X-ray emission of AG Peg in its pre-outburst state (1993 June; ROSAT) as well as in its post-outburst state (2017 November; XMM-Newton). However, we have to keep in mind that there is a mandatory requirement for the validity of the CSW picture. Namely, we must have a solid evidence that both components in the binary system possess stellar winds. It is well known that objects of a late spectral class (e.g., M giants) have slow and relatively massive stellar winds but this may not be always the case with the low-mass hot stars (i.e., white dwarfs).
We just recall that for the pre-outburst state of AG Peg such a solid evidence for presence of a stellar wind from the hot component was indeed found from analysis of high resolution UV spectra (see Nussbaumer et al. 1995; Schmutz 1996). And, we do need a similar finding for the post-outburst state of AG Peg.
For the moment, we have only indirect signs that the CSW model is a reasonable representation of the X-ray emission from AG Peg in its post-outburst state.
Among others, we recall that the dispersed spectra of AG Peg in 2017 show that the forbidden line in the He-like triplet of OVII is not suppressed (Section 3.1 and Fig. 2). This indicates that the line emission originates from a region with relatively low plasma density located far from strong sources of UV emission. That is, the X-ray emission is not expected to form close to or on the surface of the hot component. So, the CSW region in AG Peg seems a suitable place for the origin of the X-rays from this symbiotic binary.
Also, the strong emission lines in the dispersed spectra of AG Peg in 2017 show no appreciable line shifts (all are consistent with zero-shifts). We note that in the framework of the CSW picture, which considers interaction of two spherically-symmetric stellar winds, the axis of symmetry of the CSW ‘cone’ coincides with the line of centres of the binary components. And, the CSW cone has its apex pointing to the star with the stronger wind, therefore, the shocked plasma flow will be towards the star with the weaker wind. Thus, if the orbital inclination of the binary system is not zero, the spectral lines from the interaction region are expected to have line shifts that vary with the orbital phase. The maximum red- or blue-shifts of the lines are expected when the star with the stronger wind or the stellar component with the weaker wind is respectively ‘in-front’ with respect to observer. Non-shifted line centres are to be observed when the observer’s line of sight is perpendicular to the line of centres of the binary components. For orbits with low ellipticity, these are the orbital phases near the maximum and the minimum of the radial-velocity curve of the stellar components themselves. Using the ephemeris from Fekel et al. (2000), we derive that the XMM-Newton observation of AG Peg was carried out at orbital phase 0.765. Interestingly, this is exactly near the orbital phases with the maximum radial-velocity of the M giant in AG Peg (see fig.9 in Fekel et al. 2000). So, no line shifts are to be expected for the spectral lines of the CSW region at that moment.
But, what about the different type of variability in the UV and X-ray spectral domains in 2017? Namely, on short time-scales (minutes and hours) AG Peg shows noticeable stochastic variability (flickering) in UV and no variability in X-rays (see Section 3.3 and Fig. 4). We think this result can be understood in the framework of the CSW picture. Since the presumed hot-star wind is driven by the radiation pressure of the hot component, fluctuations of the UV radiation may cause similar variability (i.e., on about the same short time-scales) of the stellar wind parameters, which in turn may result in some fluctuation of the CSW region parameters. However, we have to keep in mind that there is a characteristic time-scale that determines how the CSW region responds to any physical fluctuations. This is the dynamical time () of the hydrodynamical problem of CSWs and for AG Peg is days (, where cm is the binary separation and km s-1 ; see above). This value of the dynamical time means that the CSW region in AG Peg will ‘promptly’ respond to any changes in the stellar winds that have typical time-scale of weeks or months. On the other hand, all the short-time fluctuations will simply be smeared out and the CSW region will adopt such physical parameters that correspond to the time-averaged values of the stellar wind parameters. Thus, we may expect that the X-ray emission from the presumed CSWs in AG Peg to have no variability on short time-scales despite the appreciable UV variability (flickering) from this symbiotic binary.
However, we underline that if future optical/UV observations do not find a solid evidence for a massive enough hot-star wind or if they find that no hot-star wind exists now (in the post-outburst state), then the CSW picture will face serious problems and a different mechanism must be proposed for the origin of the X-ray emission from AG Peg.
| Parameter | ROSAT | XMM-Newton |
|---|---|---|
| /dof | 23/33 | 169/153 |
| NH | 0.43 | 0.90 |
| N | 8.93 | 4.62 |
| O | 1.0 | 0.24 |
| Ne | 1.0 | 0.60 |
| Mg | 1.0 | 0.48 |
| Si | 1.0 | 0.28 |
| Fe | 1.0 | 0.26 |
| 1.00 | 1.00 | |
| FX,1 | 6.41 (13.7) | 6.08 (20.2) |
| FX,2 | … | 6.38 (15.2) |
Notes. Results from the fit to the ROSAT spectrum of AG Peg using model spectra from the CSW hydrodynamic simulations for the case with collisional ionization equilibrium (CIE). Tabulated quantities are the neutral H absorption column density (NH) in units of 1021 cm-2, the normalization parameter () and the absorbed X-ray flux in units of ergs cm-2 s-1 (FX,1 in the 0.1 - 2 keV range; FX,2 in the 0.2 - 8 keV range) followed in parentheses by the unabsorbed value. The parameter is a dimensionless quantity that gives the ratio of observed to theoretical fluxes. A value of indicates a perfect match between the observed count rate and that predicted by the model. The adopted abundances are with respect to the solar abundances (Anders & Grevesse, 1989). Errors are the values from the fit.

5 Conclusions
In this work, we presented the XMM-Newton data of AG Peg, obtained after the end of its outburst in 2015. The basic results and conclusions from our analysis of these data are as follows.
(i) The X-ray emission of AG Peg is of thermal origin as indicated by the presence of emission lines of high-ionization species (NVII, OVII, OVIII, Fe XVII) in the dispersed spectra of AG Peg. A strong (not suppressed) forbidden line in the He-like triplet of OVII is detected, which indicates that the X-ray emission originates from a rarefied hot plasma far from strong sources of ultraviolet emission.
(ii) The thermal origin of the X-ray emission and the fact that almost all of the source counts are at energies below 2 keV indicate that AG Peg in 2017, that is in its post-outburst state, is of the class of the X-ray sources amongst the symbiotic stars. The X-ray spectra of AG Peg are well matched by a two-temperature optically-thin plasma emission ( keV and keV).
(iii) No short-term (within 30 ks) X-ray variability is detected. On the other hand, the UV emission (UVM2 optical filter with effective wavelength and width of 2310 Å and 480 Å, respectively) of AG Peg shows stochastic variability (flickering) on time-scales of minutes and hours. Such a different behaviour is a sign that the X-ray and UV emissions originate from different regions in AG Peg and are subject to different formation mechanisms.
(iv) Since the X-ray emission of symbiotic stars of the class is assumed to originate from colliding stellar winds in binary system (Mürset et al. 1997; Luna et al. 2013), we also made use of CSW modelling in our analysis by adopting the stellar wind and orbital parameters of AG Peg deduced from analysis in other spectral domains (e.g., Schmutz 1996; Fekel et al. 2000). The basic result is that the CSW model spectrum can match well the shape of the XMM-Newton spectra, but the mass-loss rates had to be increased by a factor of 1.86 to get a good correspondence between the theoretical and observed flux values.
(v) Despite the fact that the CSW model is capable of explaining the X-ray properties of AG Peg in its post-outburst state, a solid evidence for a massive enough hot-star wind is needed from observations in other spectral domains to proof the validity of the CSW picture. If no such an evidence is found, then the CSW picture will face serious problems and a different mechanism must be proposed for the origin of the X-ray emission from this symbiotic binary.
Acknowledgements. This research has made use of data and/or software provided by the High Energy Astrophysics Science Archive Research Center (HEASARC), which is a service of the Astrophysics Science Division at NASA/GSFC and the High Energy Astrophysics Division of the Smithsonian Astrophysical Observatory. This research has made use of the NASA’s Astrophysics Data System, and the SIMBAD astronomical data base, operated by CDS at Strasbourg, France. The authors thank an anonymous referee for valuable comments and suggestions.
References
- Anders & Grevesse (1989) Anders E., Grevesse N., 1989, Geochimica Cosmochimica Acta, 53, 197
- Arnaud (1996) Arnaud K. A., 1996, in Jacoby G. H., Barnes J., eds, Astronomical Society of the Pacific Conference Series Vol. 101, Astronomical Data Analysis Software and Systems V. p. 17
- Cash (1979) Cash W., 1979, ApJ, 228, 939
- Fekel et al. (2000) Fekel F. C., Joyce R. R., Hinkle K. H., Skrutskie M. F., 2000, AJ, 119, 1375
- Getman et al. (2005) Getman K. V., Feigelson E. D., Grosso N., McCaughrean M. J., Micela G., Broos P., Garmire G., Townsley L., 2005, ApJS, 160, 353
- Gorenstein (1975) Gorenstein P., 1975, ApJ, 198, 95
- Kenyon et al. (1993) Kenyon S. J., Mikolajewska J., Mikolajewski M., Polidan R. S., Slovak M. H., 1993, AJ, 106, 1573
- Kenyon et al. (2001) Kenyon S. J., Proga D., Keyes C. D., 2001, AJ, 122, 349
- Lebedev & Myasnikov (1990) Lebedev M. G., Myasnikov A. V., 1990, Fluid Dynamics, 25
- Luna et al. (2013) Luna G. J. M., Sokoloski J. L., Mukai K., Nelson T., 2013, A&A, 559, A6
- Luna et al. (2015) Luna G. J. M., Nunez E. N., Sokoloski L. J., Montane B., 2015, The Astronomer’s Telegram, 7741
- Luo et al. (1990) Luo D., McCray R., Mac Low M.-M., 1990, ApJ, 362, 267
- Munari et al. (2013) Munari U., Valisa P., Dallaporta S., Cherini G., Righetti G. L., Castellani F., 2013, The Astronomer’s Telegram, 5258
- Mürset et al. (1995) Mürset U., Jordan S., Walder R., 1995, A&A, 297, L87
- Mürset et al. (1997) Mürset U., Wolff B., Jordan S., 1997, A&A, 319, 201
- Myasnikov & Zhekov (1993) Myasnikov A. V., Zhekov S. A., 1993, MNRAS, 260, 221
- Nunez & Luna (2013) Nunez E. N., Luna M. G. J., 2013, The Astronomer’s Telegram, 5324
- Nussbaumer et al. (1995) Nussbaumer H., Schmutz W., Vogel M., 1995, A&A, 293, L13
- Ramsay et al. (2015) Ramsay G., Luna G. J. M., Nunez E. N., Sokoloski L. J., Montane B., 2015, The Astronomer’s Telegram, 7779
- Ramsay et al. (2016) Ramsay G., Sokoloski J. L., Luna G. J. M., Nuñez N. E., 2016, MNRAS, 461, 3599
- Schmutz (1996) Schmutz W., 1996, in Benvenuti P., Macchetto F. D., Schreier E. J., eds, Science with the Hubble Space Telescope - II. p. 366
- Skopal et al. (2017) Skopal A., et al., 2017, A&A, 604, A48
- Stevens et al. (1992) Stevens I. R., Blondin J. M., Pollock A. M. T., 1992, ApJ, 386, 265
- Tomov et al. (2016) Tomov T. V., Stoyanov K. A., Zamanov R. K., 2016, MNRAS, 462, 4435
- Vogel & Nussbaumer (1994) Vogel M., Nussbaumer H., 1994, A&A, 284, 145
- Vuong et al. (2003) Vuong M. H., Montmerle T., Grosso N., Feigelson E. D., Verstraete L., Ozawa H., 2003, A&A, 408, 581
- Zhekov (2007) Zhekov S. A., 2007, MNRAS, 382, 886
- Zhekov (2017) Zhekov S. A., 2017, MNRAS, 472, 4374
- Zhekov & Skinner (2000) Zhekov S. A., Skinner S. L., 2000, ApJ, 538, 808
- Zhekov & Tomov (2016) Zhekov S. A., Tomov T., 2016, MNRAS, 461, 286