Vis-DSS: An Open-Source toolkit for Visual Data Selection and Summarization
Abstract
With increasing amounts of visual data being created in the form of videos and images, visual data selection and summarization are becoming ever increasing problems. We present Vis-DSS, an open-source toolkit for Visual Data Selection and Summarization. Vis-DSS implements a framework of models for summarization and data subset selection using submodular functions, which are becoming increasingly popular today for these problems. We present several classes of models, capturing notions of diversity, coverage, representation and importance, along with optimization/inference and learning algorithms. Vis-DSS is the first open source toolkit for several Data selection and summarization tasks including Image Collection Summarization, Video Summarization, Training Data selection for Classification and Diversified Active Learning. We demonstrate state-of-the art performance on all these tasks, and also show how we can scale to large problems. Vis-DSS allows easy integration for applications to be built on it, also can serve as a general skeleton that can be extended to several use cases, including video and image sharing platforms for creating GIFs, image montage creation, or as a component to surveillance systems and we demonstrate this by providing a graphical user-interface (GUI) desktop app built over Qt framework. Vis-DSS is available at https://github.com/rishabhk108/vis-dss.
1 Introduction
Visual Data in the form of images, videos and live streams have been growing in the last few years. While this massive data is a blessing to data science by helping improve predictive accuracy, it is also a curse since humans are unable to consume this large amount of data. Drones, Dash-cams, Body-cams, Security cameras, Go-pro and Cell phones etc. generate videos and photos at a rate higher than what we can process. Moreover, majority of this data is plagued with redundancy. Given this data explosion, machine learning techniques which automatically understand, organize and categorize this data are of utmost importance.
Visual Data summarization attempts to provide a highlight of the most critical and important events in the video, giving the viewer a quick glimpse of the entire video so they can decide which parts of the video is important. Similarly Machine Learning models today require training data often labeled by humans. Visual Data Subset Selection attempts to summarize large training data-sets saving both the time and the cost of human labeling efforts.
We present Vis-DSS, a toolkit for both Visual Data Subset Selection for Training Vision Models, and for summarization of videos and image collections. Our engine uses Submodular Function optimization, and presents several models of diversity, coverage, representation etc. We also empirically compare these different models and suggest recipes for using these models in different scenarios.
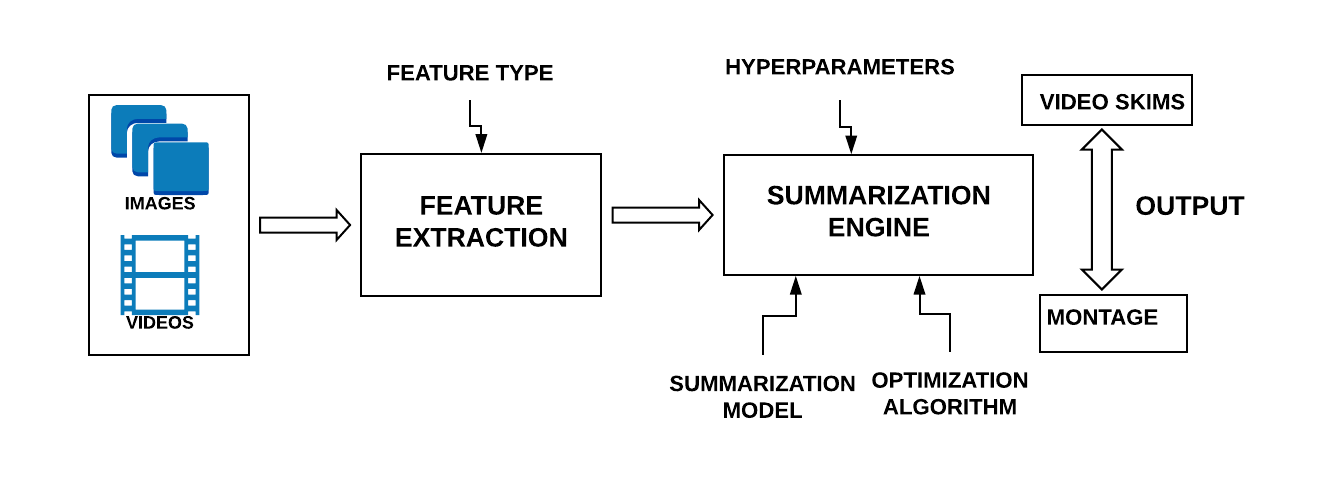
In order to perform summarization, our system accepts input in the form of an image collection/video, analyses and pre-processes it to generate meta-information about the input. The meta-information consists of visual features, scene information, presence of objects, faces and colors. This meta-information, along with information such as the desired size of the summary output, form the input to our summarization module.
Since modern deep learning models require quite a lot of data, sourcing the data and labeling them is a time consuming and expensive ordeal. There are also other problems with visual training data like data redundancy, where the amount of new information we add to the model is not proportionate to the amount of training data added. This increases the cost of labeling the data without much utility. Hence, selecting a rich subset from an existing training set without losing out on too much accuracy becomes an important tool to quickly train deep models. Summarization techniques can be used to choose such a rich subset from the visual training data to help aid in this process.
Learning approaches like active learning, which is contradictory to passive learning (supervised learning), gives the algorithm a privilege to select the best samples for optimum learning. However, making the right choice of data can be a cumbersome task in itself. Submodular functions, if used in the right way, can be a great query selection strategy in active learning that help in selecting best samples in the correct amount.
Vis-DSS provides a unified software framework with several applications including a) Image collection summarization, b) Video Summarization, c) Visual Training data subset selection, and d) Diversified active learning. All these applications are built over our core engine of submodular function optimization.
2 Related Work and Our Contributions
There have been various approaches in the past to solve Image Collection Summarization and Video Summarization. [37] perform Image Collection Summarization by formulating a summarization problem as a dictionary learning problem. Other approaches, such as [30, 26], tackle the problem by identifying the most representative set of images in the collection. [30] [30] tackled the Image Collection Summarization problem using submodular functions. They argue how a lot of previous work on this problem, have, often unknowingly, used models which are submodular. They unify all this work by proposing a framework for learning mixtures of submodular functions for image collection summarization, and also propose an evaluation measure for this problem.
Video Summarization approaches differ in the representation of the output summary. Some works extract key-frames [35, 20, 15, 16] from the input video, while some generate skims [8, 11] from it. There have also been other forms of video summarization which include creation of montages [28] and GIFs [9]. Building upon existing work from [30, 21]. [8] [8] also utilized submodular functions for performing video summarization. They also learn a mixture of submodular functions to generate summaries by providing a trade-off for interestingness, representation and uniformity. Related approaches to visual training data subset selection has revolved around the idea of choosing a smaller subset which is characteristically more diversity or representative of the overall dataset. As submodular functions are able to mathematically model these ideas of diversity and representativeness of a set, they are put to use in data subset selection applications for computer vision tasks such as text categorization [32] as well as for speech recognition. [34]
In the light of learning from lesser data, researchers have looked into techniques for selecting the right samples for training. This technique is famously known as active learning. There are limited studies that amalgamate active learning and subset selection for computer vision problems. [27] used information theoretic objective function like mutual information between the labels and developed a framework [27] to evaluate and maximize this objective for batch mode active learning. Another open-source toolkit Jensen [13] has support for continuous convex optimization which is essential for active learning aspects. [5] have incorporated batch active learning to deep models. It is common in active learning to use a core-set [1] which efficiently approximate various geometric extent measures for large set of data instances by using a smaller, but diverse subset.
There is somewhat limited work around open source software and systems for data summarization. [8] [8] have also released their code for video summarization, along with a dataset for evaluation. Similarly [18] [18] has previously released a toolbox for Submodular Function Optimization. However, both these do not adapt well to the needs of large scale problems. This paper releases a first of its kind, Visual Data Selection and Summarization toolkit, which uses Submodular Functions Optimization to identify diverse and representative elements in a set, while minimizing redundancy. We provide several classes of submodular functions including Facility Location, Minimum Dispersion, Graph Cut, Saturated Coverage, Set Cover, Probabilistic Set Cover, Feature Based functions etc. These functions have extensively been used in several summarization papers [21, 30, 8, 33, 31, 25]. We also provide three variants of inference/optimization algorithms including Greedy algorithms for Submodular Knapsack problem [29], Submodular Cover [36] and a Streaming Greedy algorithm. In each case, we provide Lazy greedy implementations [23]. Finally, and most importantly, we provide several implementational tricks including a Memoization framework. We show how using Memoization, we are able to achieve significant speedups to optimization/inference algorithms. We note that none of the existing softwares for submodular optimization [18, 8] implement these memoization tricks.
Building upon our engine, we provide several applications including Image collection summarization, Video summarization, Data subset selection and active learning. We provide three kinds of video/image summarization, including extractive summarization, query based and entity summarization. We support several models for feature extraction, including simple color histogram based features right upto deep model based feature extractors. We finally evaluate our framework on several datasets and demonstrate how our toolkit is capable of state-of-the art performance for these problems.
3 Submodular Summarization Models
This section describes the Submodular Functions used as Summarization Models in our system. We divide these into Coverage Functions, Representation Functions and Diversity Functions.
3.1 Modeling Coverage
This class of functions model notions of coverage, i.e. try to find a subset of the ground set which covers a set of concepts. Below are instantiations of this.
3.1.1 Set Cover Function
Denote as the ground set and let be a subset (of snippets or frames). Further denotes a set of concepts, which could represent, for example, scenes or objects. Each frame (or snippet) contains a subset set of concepts (for example, an image covers a table, chair and person). The set cover function then is
| (1) |
where denotes the weight of concept .
3.1.2 Probabilistic Set Cover
This is a generalization of the set cover function, to include probabilities for each object in Image . For example, our Convolutional Neural Network (CNN) might output a confidence of object in Image , and we can use that in our function. The probabilistic coverage function is defined as,
| (2) |
The set cover function is a special case of this if if Object belongs to Image (i.e. we use the hard labels instead of probabilities).
3.1.3 Feature Based Functions
Finally, we investigate the class of Feature Based functions. Here, we denote an Image via a feature representation . This could be, for example, the features extracted from a fully connected layer of a CNN. Denote as the set of features. The feature based function is defined as,
| (3) |
where , and is the value of feature in Image . is a concave function. Examples of are square-root, Log and Inverse Function etc.
3.2 Modeling Representation
Representation based functions attempt to directly model representation, in that they try to find a representative subset of items, akin to centroids and mediods in clustering.
3.2.1 Facility Location Function
The Facility Location function is closely related to k-mediod clustering. Denote as the similarity between images and . We can then define . For each image , we compute the representative from which is closest to and add the similarities for all images. Note that this function, requires computing a similarity function. However, as shown in [31], we can approximate this with a nearest neighbor graph, which will require much smaller space requirement, and also can run much faster for large ground set sizes.
3.2.2 Saturated Coverage Function
The saturated coverage function [21] is defined as . This function is similar to Facility Location and attempts to model representation. This is also a Kernel based function and requires computing a similarity matrix.
3.2.3 Graph Cut Functions
We define the graph cut family of functions as . This function is similar to the Facility Location and Saturated Coverage in terms of its modeling behaviour.
3.3 Modeling Diversity
The third class of Functions are Diversity based ones, which attempt to obtain a diverse set of key points.
3.3.1 Dispersion (Disparity) Functions
Denote as a distance measure between Images and . Define a set function . This function is not submodular, but can be efficiently optimized via a greedy algorithm [4]. It is easy to see that maximizing this function involves obtaining a subset with maximal minimum pairwise distance, thereby ensuring a diverse subset of snippets or key-frames. Similar to the Minimum Disparity, we can define two more variants. One is Disparity Sum, which can be defined as . This is a supermodular function. Another model is, what we call, Disparity Min-Sum which is a combination of the two forms of models. Define this as . This function is submodular [3].
3.4 Understanding Diversity, Representation and Coverage
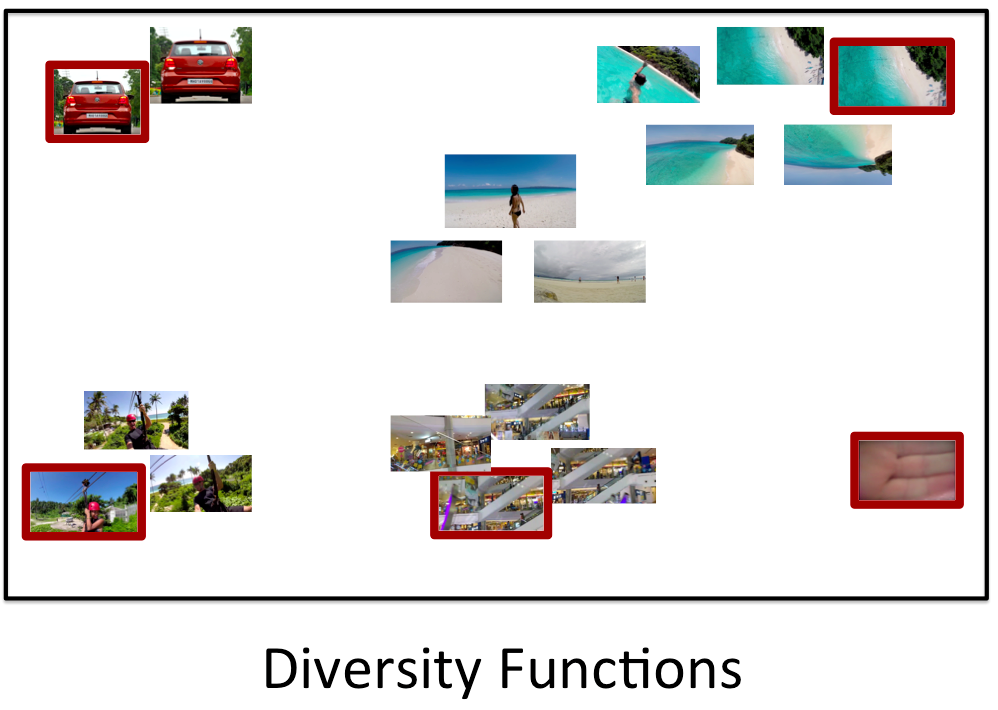
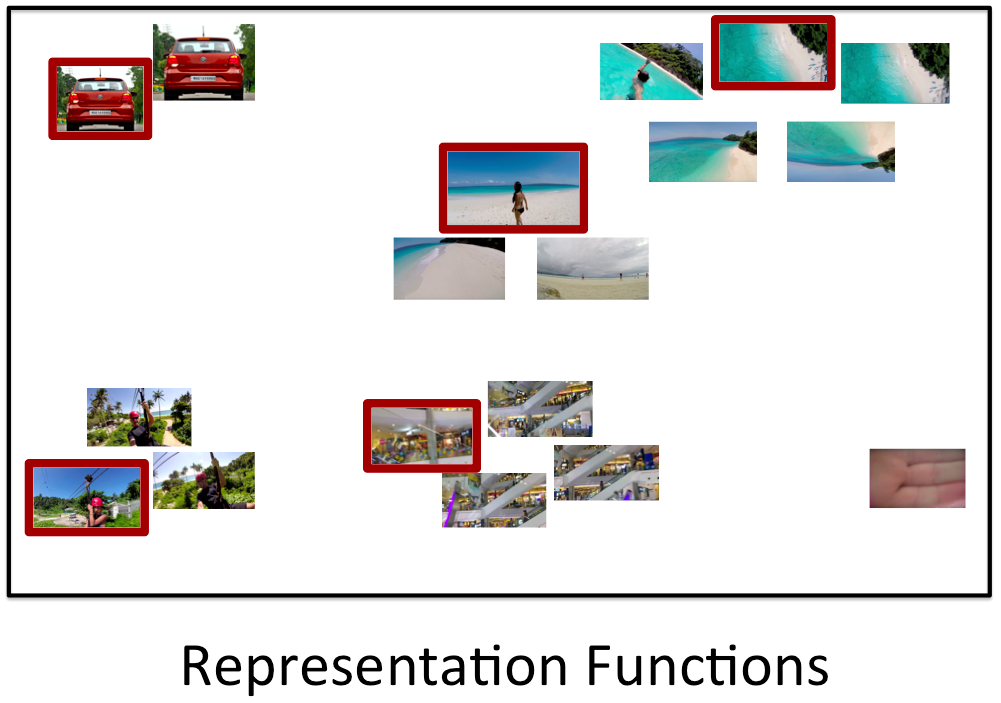
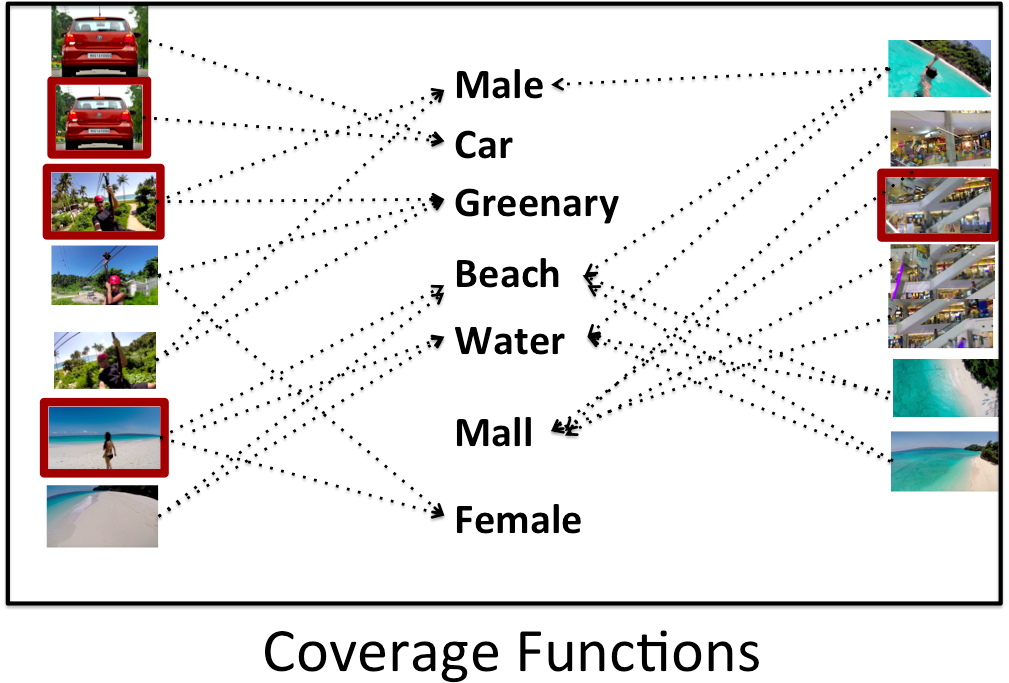
Figure 1 demonstrates the intuition of using diversity, representation and coverage functions. Diversity based functions attempt to find the most different set of images. The leftmost figure demonstrates this. It is easy to see that the five most diverse images are picked up by the diversity function (Disparity Min), and moreover, the summary also contains the image with a hand covering the camera (the image on the right hand side bottom), which is an outlier. The middle figure demonstrates the summary obtained via a representation function (like Facility Location). The summary does not include outliers, but rather contains one representative image from each cluster. The diversity function on the other hand, does not try to achieve representation from every cluster. The rightmost figure demonstrates coverage functions. The summary obtained via a coverage function (like Set Cover or Feature based function), covers all the concepts contained in the images (Male, Car, Greenery, Beach etc.).
3.5 Optimization/Inference Algorithms
In the previous section, we discussed the different submodular functions used in our summarization model. We now investigate the various optimization algorithms used by us to solve our problems.
3.5.1 Budget Constrained Submodular Maximization
For Budget Constrained Submodular Maximization, the greedy algorithm is a slight variant, where at every iteration, we sequentially update . This algorithm has near optimal guarantees [29].
3.5.2 Submodular Cover Problem
For the Submodular Cover Problem, we again resort to a greedy procedure [36] which is near optimal. In this case, the update is similar to that of problem 1, i.e. choose . We stop as soon as , or in other words, we achieve a set which covers all the concepts.
3.5.3 Stream Greedy
Finally, we describe the Stream greedy algorithm. We implement a very simple version of streaming greedy algorithm. We first order the elements via a permutation . Denote as the element in the ordering. Given a threshold , the streaming greedy ads an element to the summary if the gain of adding element to the current summary is greater than , i.e. if .
| Name | ||||
|---|---|---|---|---|
| Facility Location | ||||
| Saturated Coverage | ||||
| Graph Cut | ||||
| Feature Based | ||||
| Set Cover | ||||
| Prob. Set Cover | ||||
| Dispersion Min | ||||
| Dispersion Sum | ||||
| Dispersion Min-Sum |
3.5.4 Lazy Greedy Implementations
Each of the greedy algorithms above admit lazy versions which run much faster than the worst case complexity above [23]. The idea is that instead of recomputing , we maintain a priority queue of sorted gains . Initially is set to . The algorithm selects an element , if , we add to (thanks to submodularity). If , we update to and re-sort the priority queue. The complexity of this algorithm is roughly , where is the average number of re-sorts in each iteration. Note that , while in practice, it is a constant thus offering almost a factor speedup compared to the simple greedy algorithm.
3.5.5 Implementation Tricks: Memoization
This section goes over implementation tricks via memoization. One of the parameters in the lazy greedy algorithms is , which involves evaluating . One option is to do a naïve implementation of computing and then and take the difference. However, due to the greedy nature of algorithms, we can use memoization and maintain a precompute statistics at a set , using which the gain can be evaluated much more efficiently. At every iteration, we evaluate using , which we call . We then update after adding element to . Table 1 provides the precompute statistics, as well as the computational gain for each choice of a submodular function . Denote as the time taken to naïvely compute . Denote as the time taken to evaluate this gain given the pre-compute statistics . We see from Table 1, that evaluating the gains using memoization is often an order of magnitude faster. Moreover, notice that we also need to update the pre-compute statistics at every iteration. For the functions listed in Table 1, the cost of updating the pre-compute statistics is also . Hence every iteration of the (lazy) greedy algorithm costs only instead of which is an order of magnitude larger in every case. In our results section, we evaluate empirically the benefit of memoization in practice.
4 Our Vis-DSS Framework
4.1 Our Engine
In order to make our toolkit easy to incorporate in applications, we assemble a summarization engine which is used to solve our tasks of image and video summarization, training data subset selection and diversified active learning.
We provide easy to use APIs and function calls in our library, which allow the user to effortlessly run the various summarization models present in our toolkit.
The combinations of submodular models and algorithms available in our system are given in Table 2.
| Submodular Function Type | Summarization Algorithm | Summarization Model |
| Similarity Based | Budgeted Greedy | Disparity Min |
| Max Marginal Relevance | ||
| Facility Location | ||
| Graph Cut | ||
| Saturated Coverage | ||
| Stream Greedy | Disparity Min | |
| Max Marginal Relevance | ||
| Facility Location | ||
| Graph Cut | ||
| Saturated Coverage | ||
| Coverage Greedy | Facility Location | |
| Graph Cut | ||
| Saturated Coverage | ||
| Coverage Based | Budgeted Greedy | Set Cover |
| Probabilistic Set Cover | ||
| Feature Based Functions | ||
| Coverage Greedy | Set Cover | |
| Probabilistic Set Cover | ||
| Feature Based Functions |
4.2 Image Collection Summarization
Image Collections, such as albums of vacations photographs, generally contain a large number of repetitive and similar looking images. Humans are able to identify this redundancy intuitively, however it may be a taxing process due to the sheer number of images in a large image collection. To summarize such image collections, we provide the following variants of summarization in our toolkit.
4.2.1 Extractive Summarization
Extractive Summarization extracts a set of diverse, yet representative frames from the original image collection. The summary is determined at run-time based on the desired length, or the desired coverage, representation and diversity. The output summary can be in the form of a stitched video of summary images or an image montage.
Feature Extraction
In order to obtain a diverse subset from the collection, we first need to extract features for every image in the collection. These features would then be used by the submodular summarization models to select the elements to be added to the summary set.
Two types of features can be extracted for an image in our system. They are as follows:
-
1.
Simple Feature: The color histogram is computed for the Hue and Saturation channels of the image. This color histogram is then normalized and it acts as the feature for the image.
-
2.
Deep Feature: We use CNN models to extract features from their fully connected layers. These features are high-dimensional and are used by the summarization model to create the summary set.
While performing Deep Feature Extractive Summarization in our system, we extract the features from the first fully connected layer of the 2012 Imagenet winning model, AlexNet by [19] [19]. We obtain a 4096 dimensional feature vector for every image, which is then fed to the summarization model.
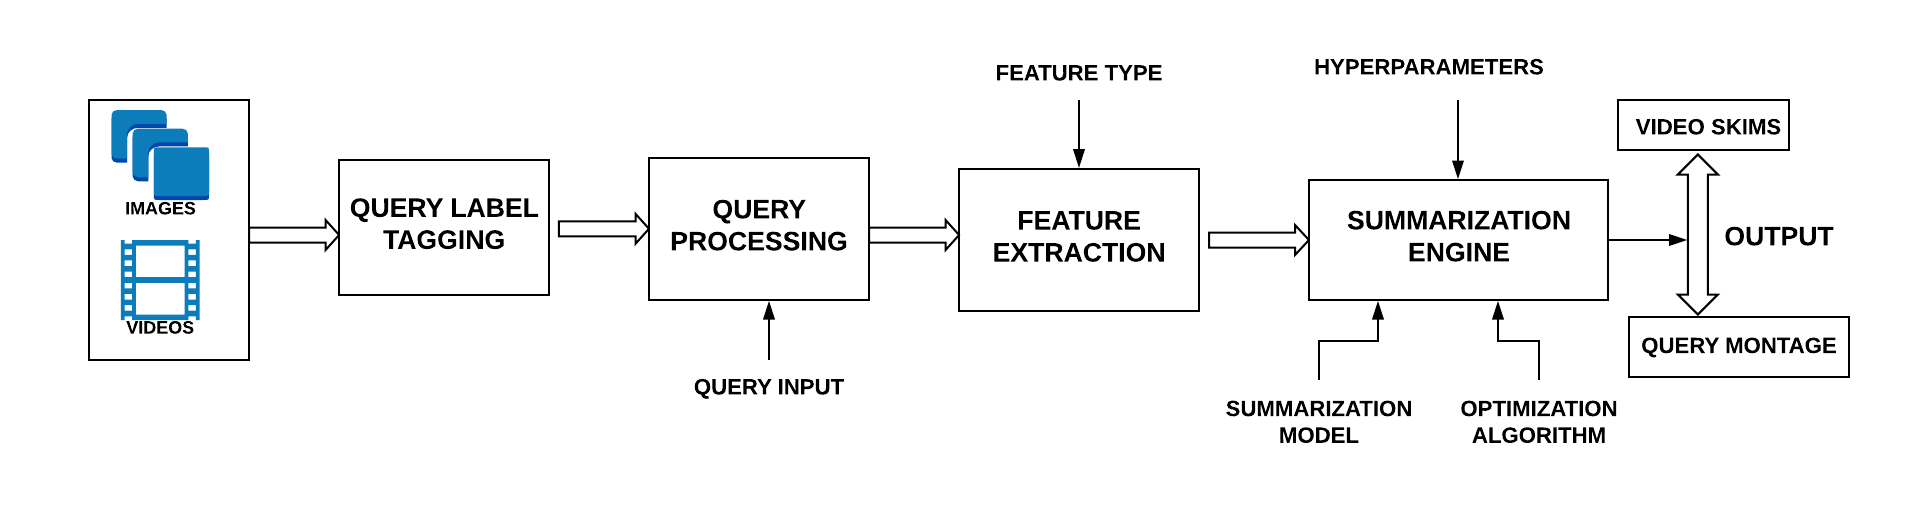
4.2.2 Query Summarization
Given an input query, extract a set of diverse and representative frames relevant to that query. Once the relevant frames have been retrieved, the procedure is similar to extractive summarization. The output is a stitched video or image montage of images apropos to the query.
Query Label Tagging
The first step in Query Summarization involves the assignment of a label to every image in the collection. A user can then input a query based on these labels. In order to tag the images, we use a scene classification CNN model [38] to classify the background scenes in the images and assign the corresponding label to it.
Query Processing
Once all the images in the collection are labelled, an input query is accepted from the user which is used to select the appropriate frames from the collection.
Feature Extraction
As used in extractive summarization, the AlexNet model is used to extract deep features for all the selected relevant frames of the collection.
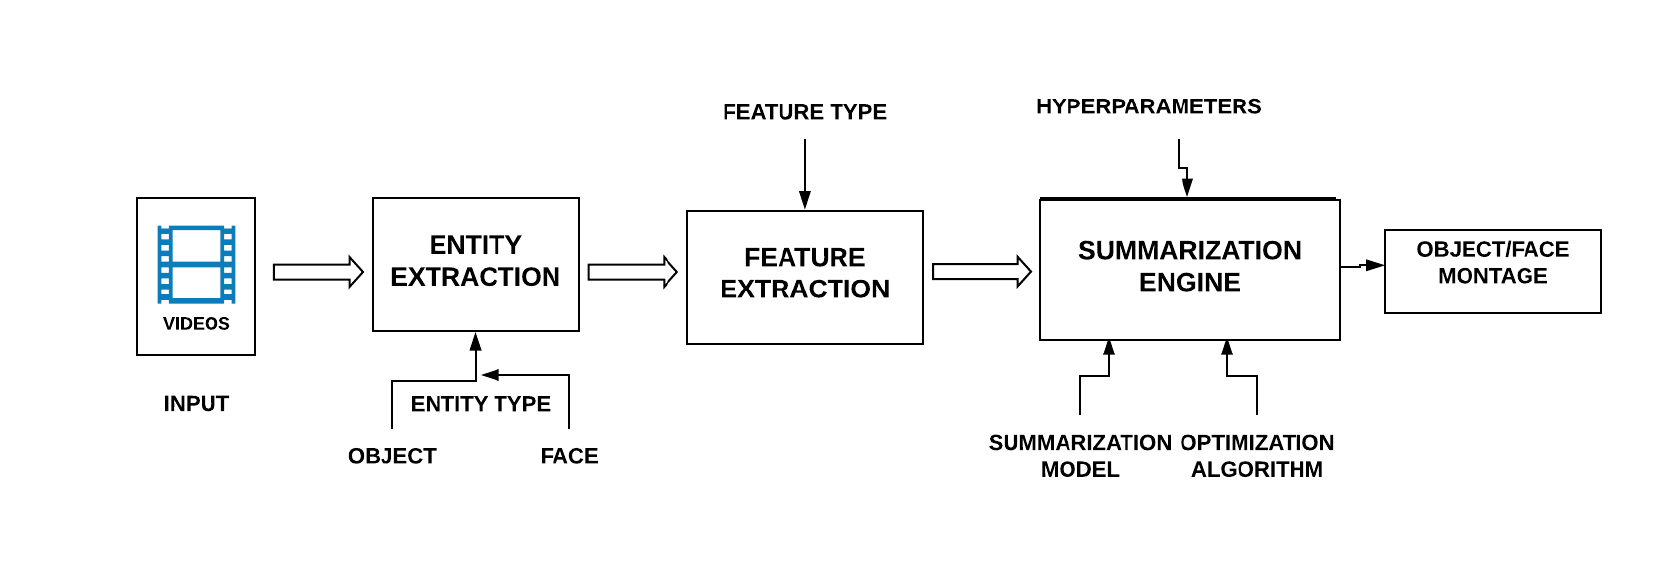
4.2.3 Entity Summarization
An image collection may contain multiple occurrences of numerous distinct entities. These entities can be of different types, such as person, vehicle, animals, etc. Entity Summarization identifies and extracts these entities from the input and summarizes them to return an image montage consisting of diverse entities present in it. The same entity summarization approach is also used to identify and output a representative set of faces present in our input collection.
Detecting and Extracting Entities
To detect the different entities present in the input video, we use a YOLOv2 [24] object detection model trained on the PASCAL VOC [7] dataset. The model is capable of detecting objects belonging to various categories, such as person, vehicles, animals and indoor objects. This allows us to identify common objects seen in everyday scenarios and extract them, in order to perform entity summarization on them.
Another variant of Entity Summarization uses a Single Shot Detector [22] based ResNet [12] model trained on human faces. The model detects all faces present in the image collection. We then perform summarization on this collection of extracted faces to identify the different people present in the input image collection.
Feature Extraction
Similar to the other variants of summarization, we continue using CNN models to extract features of our extracted entities. The AlexNet model is used to extract features of the entities detected by the YOLOv2 model, whereas a Deep Metric Learning based ResNet model [17] is used for obtaining features when the extracted entities are human faces.
4.3 Video Summarization
Similar to Image Collection Summarization, our system is also capable of summarizing videos by identifying the diverse, representative or interesting snippets in a video. We provide the same variants of summarization for video summarization, as provided for Image Collection summarization, i.e. extractive summarization and query summarization, along with the addition of entity summarization.
Snippet Types
To summarize a video, we first create snippets of the video. These snippets form our ground set, which is used by our summarization models to generate the summary.
Two kinds of snippets can be selected in our system They are as follows:
-
1.
Fixed Length Snippets: Each element of the ground set is of a fixed snippet size, which can be configured by the user. By default, we set the snippet size to two seconds.
-
2.
Shot Detected Snippets: Instead of having snippets of fixed size, we provide the option of having individual shots as snippets. This ensures that the snippets do not start/end abruptly, and the generated summary video looks uniform and smooth.
4.3.1 Extractive Summarization
Similar to extractive summarization in Image Collection Summarization, we extract a set of diverse, yet representative snippets from the input video. The summary can be generated in form of image montage or video skim of the original video.
Feature Extraction
As in the case of Image Collection Summarization, the first step in Extractive Video Summarization is feature extraction. We use the same types of features for video summarization as described in section 4.2.1. However, in the case of video summarization, we extract these features for all frames in a given snippet and create an average feature vector representing that snippet.
4.3.2 Query Summarization
In line with query summarization for Image Collection Summarization, we extract a set of diverse and representative snippets relevant to the input query.
Query Label Tagging
For every snippet in the ground set, we pass all frames through the scene classification CNN model [38] and tag the individual frames in the snippet.
Query Processing
After tagging all snippets, an input query is accepted from the user. If a snippet contains a frame which satisfies the input query, the snippet is retained in the ground set, else it is removed from the ground set.
Feature Extraction
To perform summarization on the query relevant snippets, we follow the same methodology as followed in section 4.3.1. We extract deep features of every frame in a particular snippet and aggregate those features, so as to generate an average feature vector which is representative of that snippet.
4.3.3 Entity Summarization
Similar to Image Collection Summarization, videos may also contain multiple occurrences of numerous distinct entities and faces. We adopt the same approach that we’ve taken in section 4.2.3.
Detecting and Extracting Entities
To detect the different entities present in the input video, we use the same YOLOv2 [24] object detection model to detect common place objects, and a SSD based ResNet face detector to extract our required entities.
Feature Extraction
In case of entity summarization, we follow the same feature extraction pipeline used in the Image Collection Summarization case, which has been elaborated upon in section 4.2.3.

4.4 Visual Training Data Subset Selection
The goal behind data subset selection is to select a small representative dataset which can be used for training models efficiently, performing quick hyperparameter tuning or reducing the data labeling cost. A subset selected using diversity models for data summarization helps towards this goal, as opposed to selecting a random subset of the same size. This technique can be used for a wide variety of computer vision tasks which can be solved using deep CNNs such as image classification and object detection.
Given a dataset for an image classification task, we can use Vis-DSS to generate a subset of that dataset using a given submodular function to train a model without a significant loss in accuracy and show that this subset outperforms a random subset of the same size. The features used to compute the representativeness for subset selection can be AlexNet features trained on ImageNet, GoogLeNet trained on the Places205 dataset [38] or any such pre-trained model.
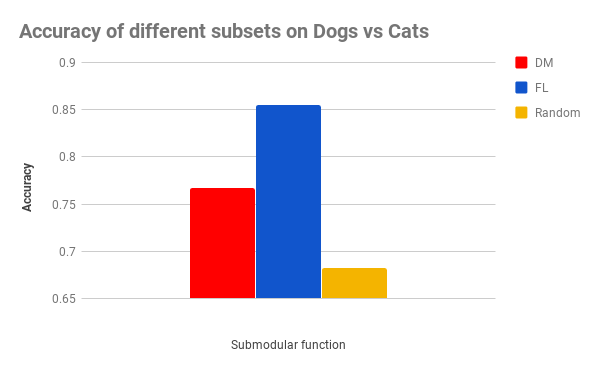
We demonstrate using such a subset using two submodular functions, Disparity Min and Facility Location to train an AlexNet model on the Dogs vs Cats dataset [6] and compare the accuracy with a random subset.
4.5 Diversified Active Learning
Since submodular functions naturally model diversity, they are a perfect fit for selecting samples to be labeled in order to make a learning algorithm better. A blend of subset selection algorithms with active learning can speed up the learning process and maximize gradient flow in the very initial training epochs. We propose diversified active learning that uses various submodular functions that act as query selection techniques for datasets of all types. Deep learning being a highly iterative process, it is imperative to get insights regarding the learning of a model during its early training epochs.
Vis-DSS is the solution to all the query selection problems for active learning. Depending on requirements based on representation, diversity or coverage needed from a particular domain, several sudmodular functions are provided in Vis-DSS to aid the selection of the best query from a dataset. This is an iterative process and required features that would be diverse in nature. For instance, the features could be VGG or AlexNet features trained on ImageNet, or YOLO features trained on COCO.
We illustrate the performance of different summarization models for data subset selection and active learning. We used the Dogs vs Cats dataset [6], as an example to illustrate this. The features are extracted using AlexNet which is pre-trained on ImageNet.
5 Applications built on Vis-DSS
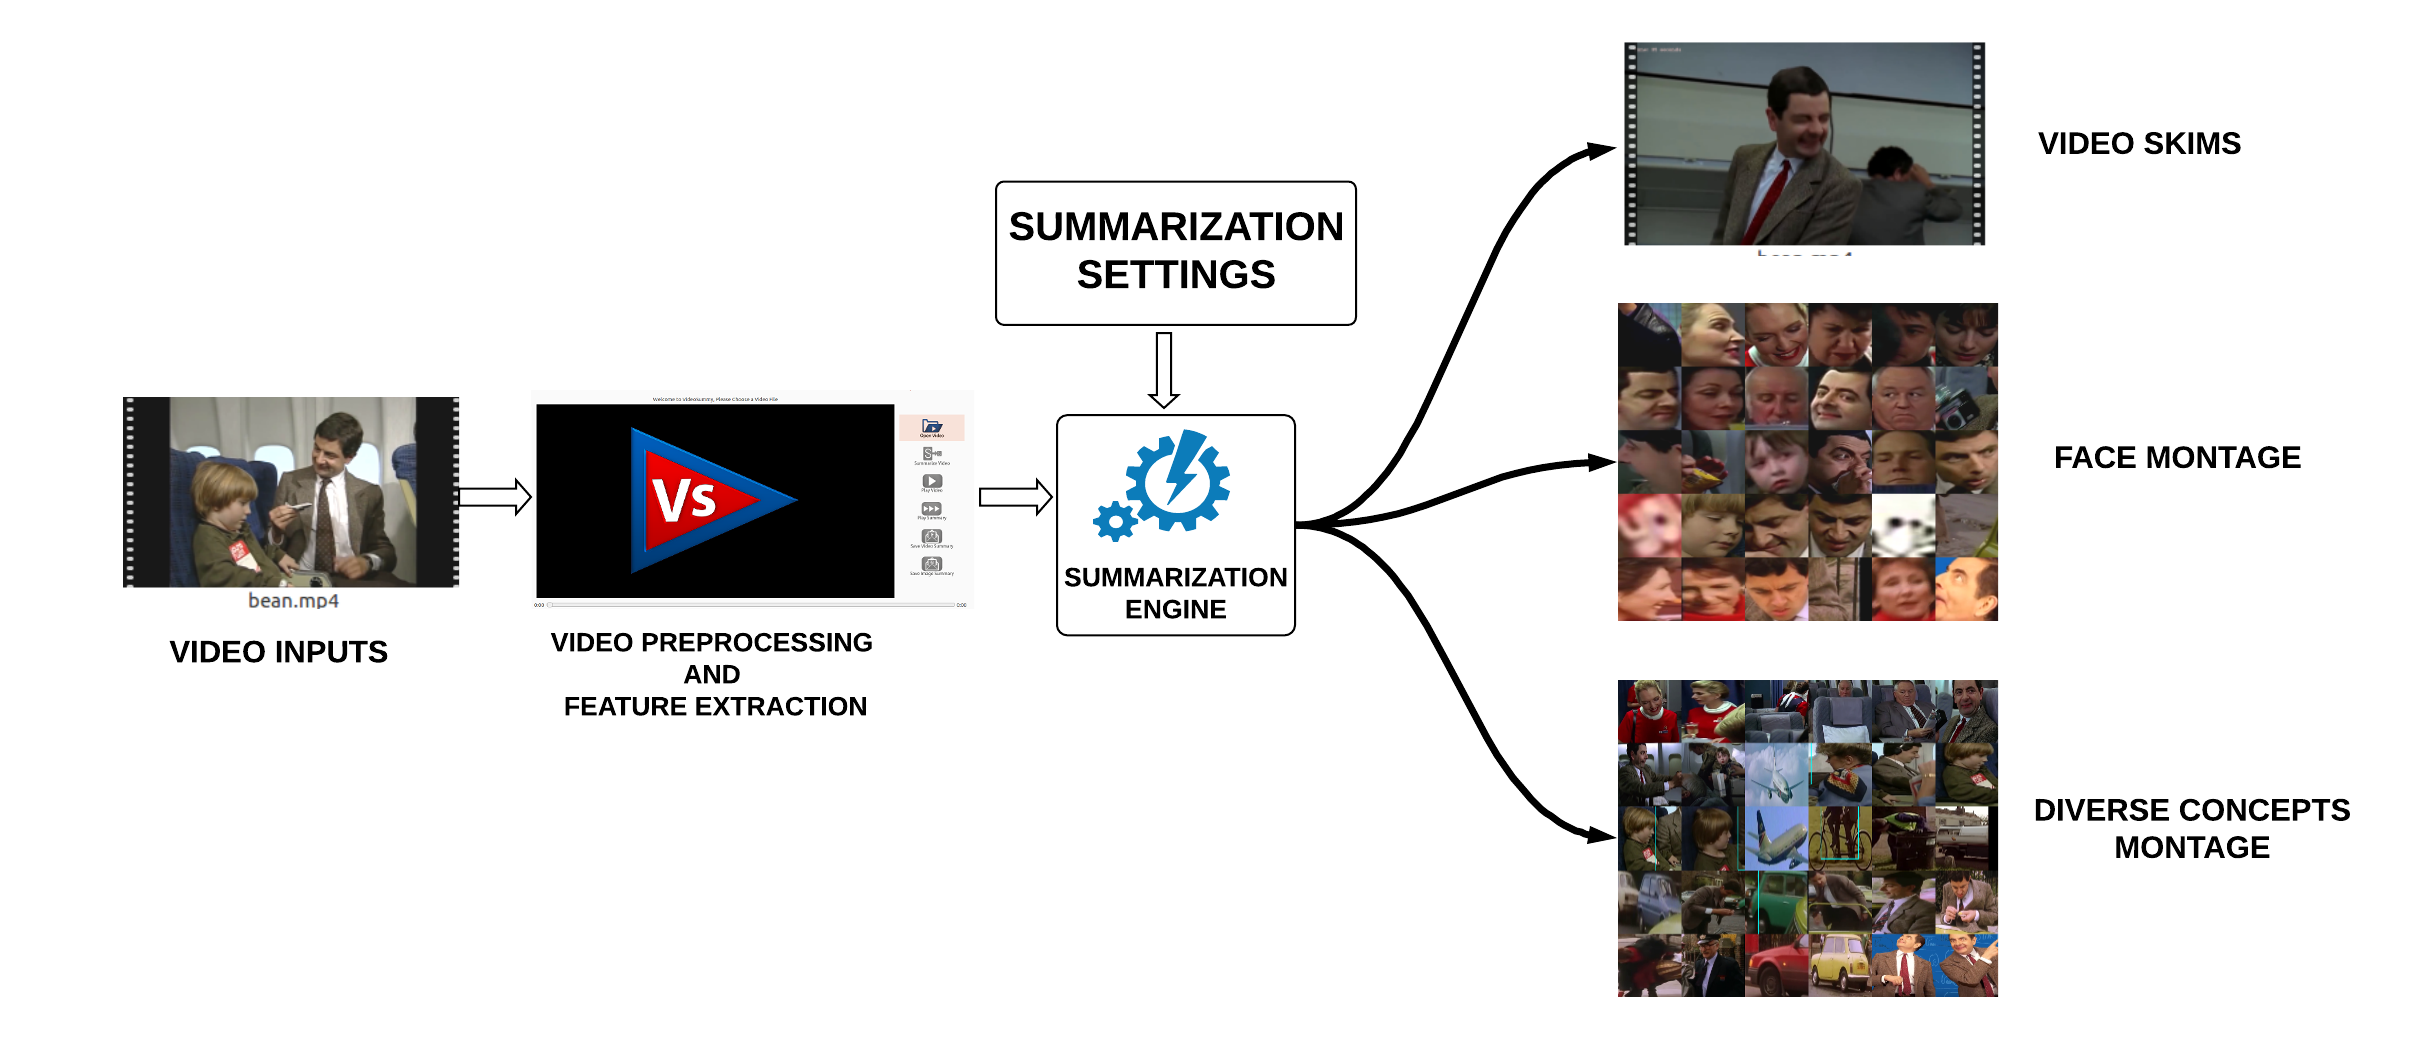
5.1 The Vis-DSS Summarization Application
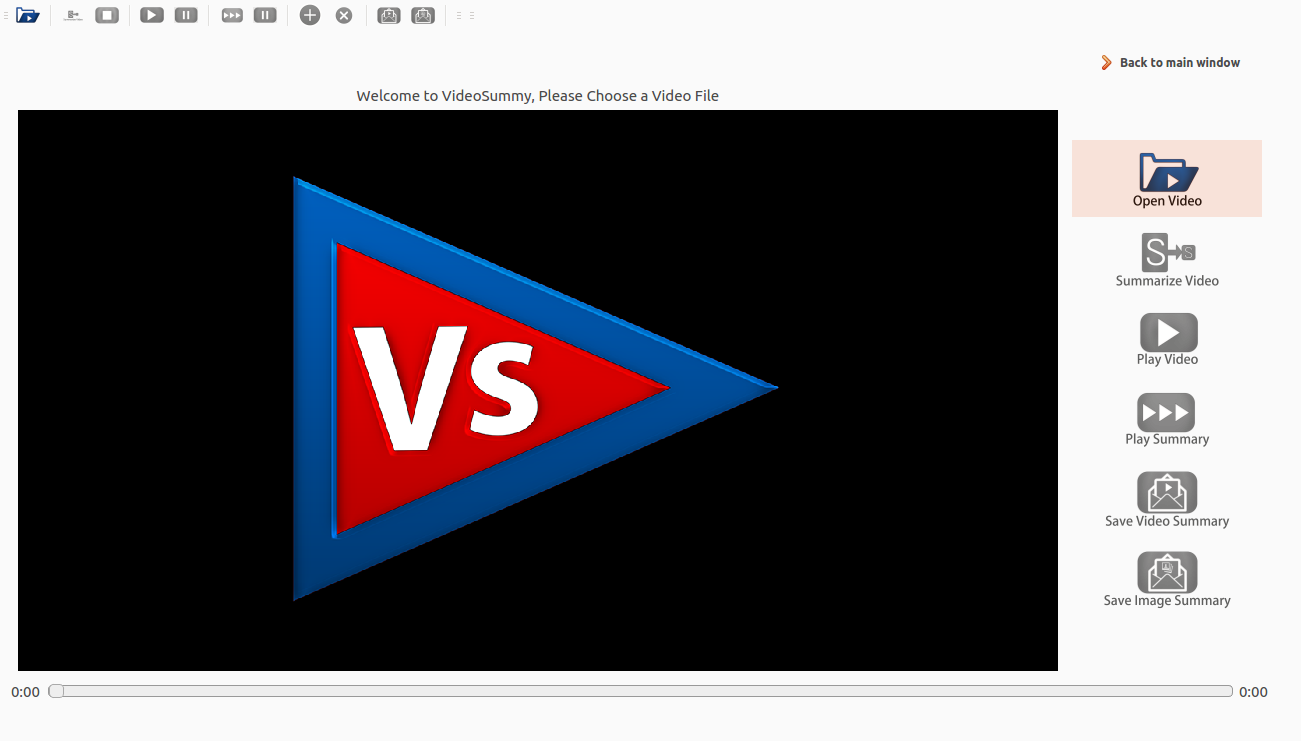
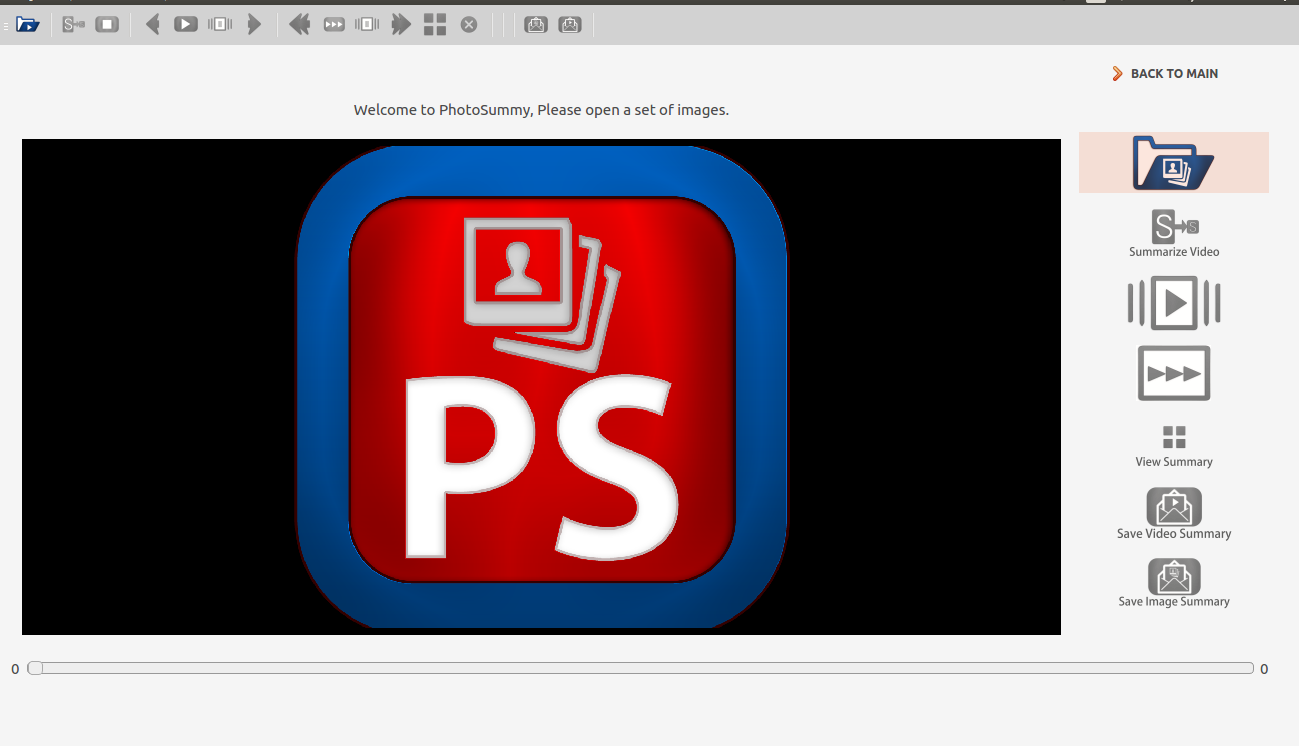
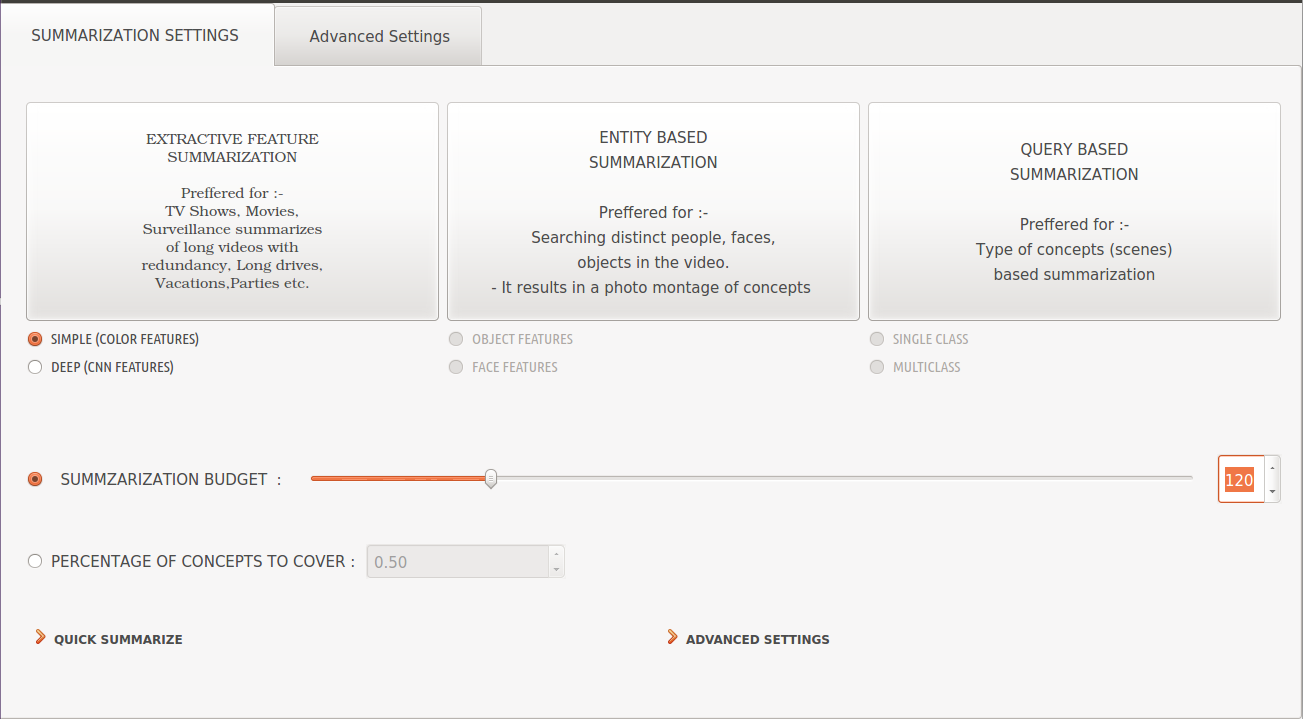
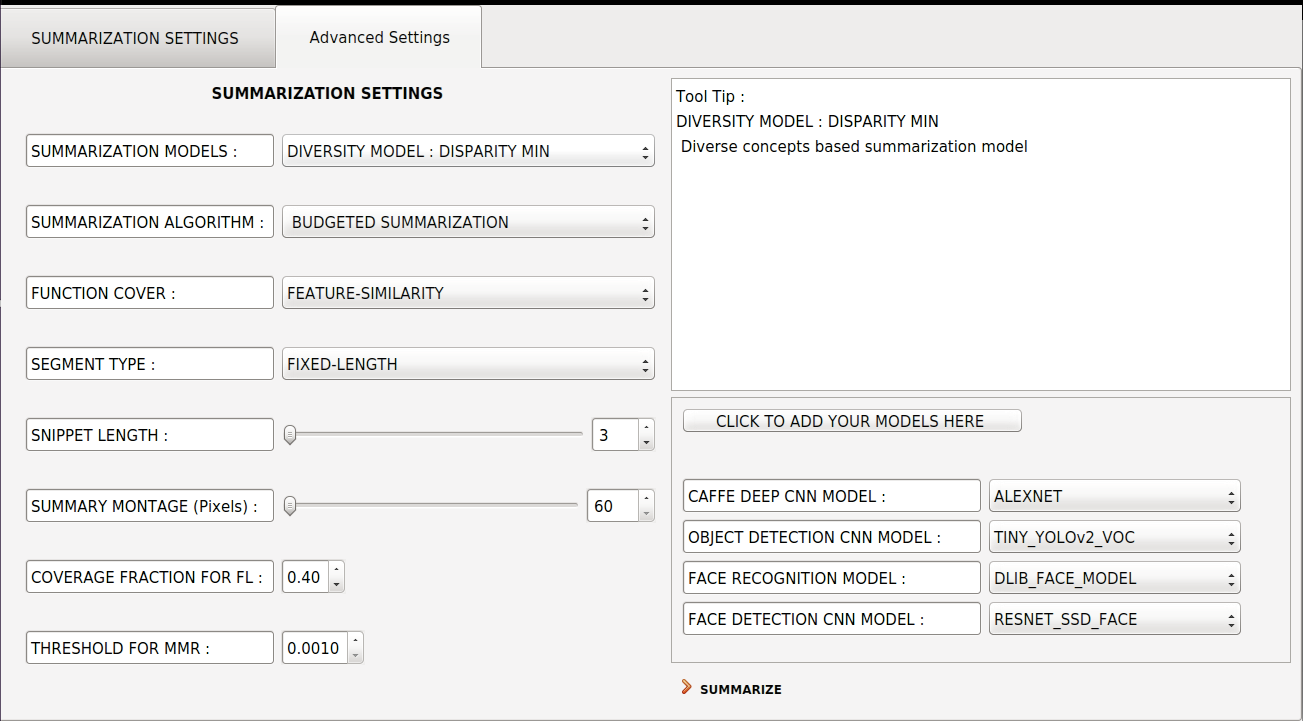
Vis-DSS is an open-source standalone application which provides implementation of submodular algorithms for visual data subset selection and summarization.It includes a low level optimization engine written in ANSI C++, which is invoked by the graphical user interface (GUI) provided by a multi-threaded application built over QT Application development framework. The Application provides a clean and simple graphical interface through which a user can select an algorithm among different permutations of summarization techniques, which suits requirements the best. As the source has been released under open-source paradigm, it is possible to integrate it to other existing C++ projects. To make that system is easy to understand and user friendly we have have a tool tip inside the application which helps the users to understand different algorithms while selecting among them. In terms of system dependencies and deployment, Vis-DSS requires OpenCV [2] for all the image/video manipulations and color feature extractions. Apart from this, the other dependencies are Caffe [14], for deep feature extractions and query labelling, and Dlib [17], for face features. The GUI application has been designed in the Open-Qt Framework, which enables it to be distributed easily as a binary. Figure 5 shows the flow of the application, while Figure 6 shows the screen shots of our application and the different pages.
6 Experimental Evaluation
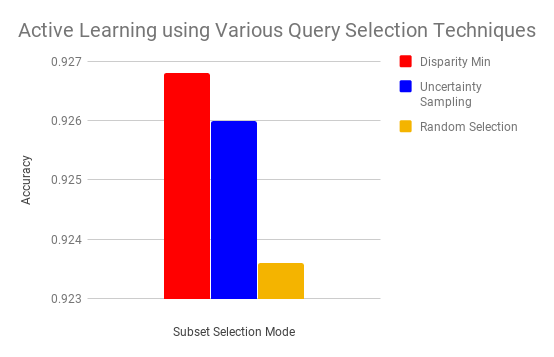
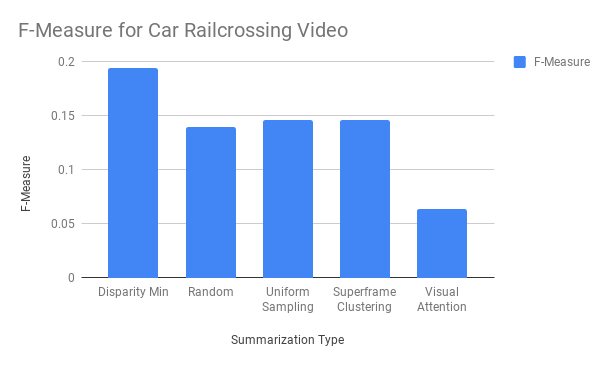
Figure 7 (top) demonstrates the results of Data subset selection with submodular functions. We use two specific summarization models, Facility Location and Disparity Min (one is a representation function and another is diversity). We compare a random baseline. We see that the summarization models consistently outperform the random baseline. Next, we study the performance of the summarization models in the context diversified active learning (Figure 7 middle). We use uncertainty sampling and random selection as baselines. We then consider Disparity Min as a diversity model within the context of diversified active learning. Again, we see that disparity min significantly out performs these baselines. We also compare our video summarization models on Summe dataset [10]. Again, we choose Disparity Min as an example summarization model and compare to random, uniform, superframe culstering and visual attention on the Car Railcrossing video. We see that Disparity Min outperforms all baselines in terms of F1 measure.
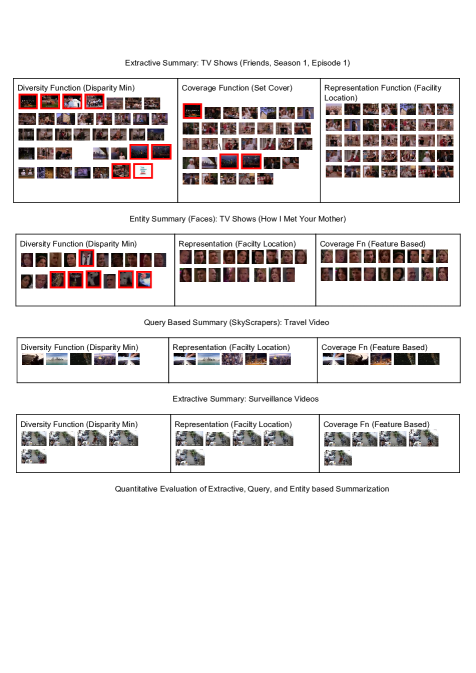
We next qualitatively and quantitatively study the role of different submodular functions for video/image summarization. Figure 8 shows the results for extractive summarization, entity summarization and query based summarization on frames from different kinds of videos. We compare the different summarization models under various scenarios and evaluation measures. Instead of comparing all the submodular functions described above, we consider representatives from each class of functions. We use Facility Location as a representative function, Disparity Min for Diversity and Set Cover as a choice for Coverage functions. Towards this, we create a dataset of videos from different categories. We select 10 videos from the following categories: Movies/TV shows, Surveillance camera footage, Travel videos and sports videos like Soccer. In the following sections, we annotate various events of interest (ground-truth) from these videos to define various evaluation criteria. The goal of this is to demonstrate the role of various summarization models.
Extractive Summarization: Representation
The top Figure in Fig. 8 demonstrates the results of extractive summarization on Movies and TV shows. Diversity Models tend to pick up outlier events, which in this case, include transition scenes and other outliers. In contrast, the Representation function (Facility Location) tends to pick the representative scenes. The coverage function does something in between. In the case of a TV show, representative shots are probably more important compared to the transition scenes. To quantify this, define an evaluation measure as follows. We divide a movie (TV Show) into a set of scenes where each scene is a continuous shot of events. We do not include the outliers (we define outliers as shots less than a certain length – for example transition scenes). Given a summary , define . A summary with a large value of will not include the outliers and will pick only single representatives from each scene. We evaluate this on different TV show and movie videos. Figure 9 (top left) compares the representative, diversity, and coverage models and a random summary baseline. We see the representative model (Facility Location) tends to perform the best as expected, followed by the coverage model. The diversity model does poorly since it picks a lot of outliers.
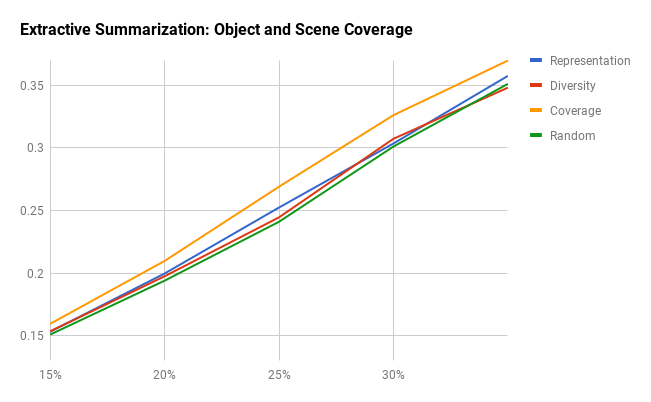
Extractive Summarization: Coverage
Next, we define an evaluation criteria capturing coverage. For each frame in the video (sampled at 1FPS), define a set of concepts covered . Denote as the set of concepts covered by a set . For each frame of the video, we hand pick a set of concepts (scenes and objects contained in the video). Define the coverage objective as . Figure 9 demonstrates the coverage objective for the different models. We obtain this by creating a set of 10 labeled videos of different categories (surveillance, TV shows/movies, and travel videos). As expected, the coverage function (set cover) achieves superior results compared to the other models.
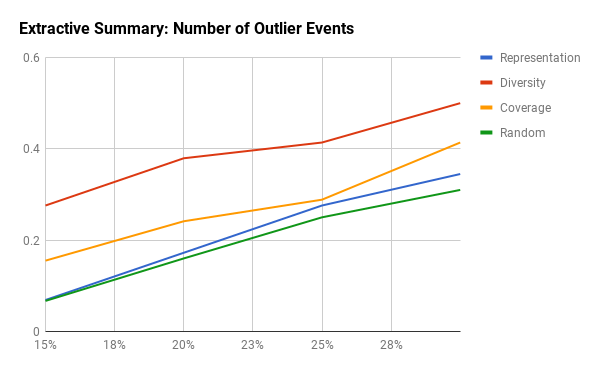
Extractive Summarization: Outliers and Diversity
In the above paragraphs, we define two complementary evaluation criteria, one which captures representation and another which measures coverage. We argue how, for example, representation is important in Movies and TV shows. We now demonstrate how the diversity models tend to select outliers and anomalies. To demonstrate this, we select a set of surveillance videos. Most of our videos have repetitive events like no activity or people sitting/working. Given this, we mark all the different events (what we call outliers), including for example, people walking in the range of the camera or any other different activity. We create a dataset of 10 surveillance videos with different scenarios. Most of these videos have less activity. Given a set of these events marked in the video, define . Note this measure is similar to the representative evaluation criteria ( except that it is defined w.r.t the outlier events. Figure 9 (middle left) shows the comparison of the performance of different models on this dataset. As expected, the Diversity measures outperforms the other models consistently.
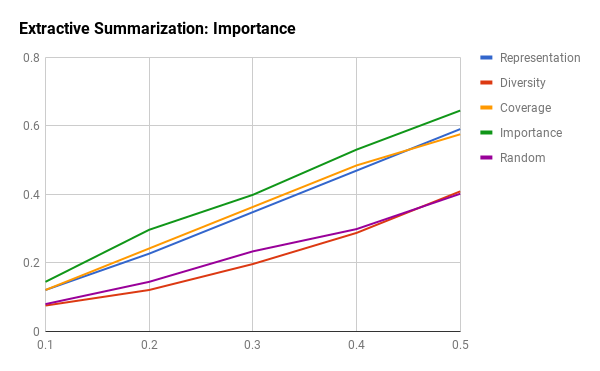
Extractive Summarization: Importance
To demonstrate the benefit of having the right importance or relevance terms, we take a set of videos where intuitively the relevance term should matter a lot. Examples include sports videos like Soccer. To demonstrate this, we train a model to predict important events of the video (e.g. the goals, red card). We then define a simple Modular function where the score is the output of the classifier. We then test this out and compare the importance model to other summarization models. The results are shown in Figure 9 (middle right). As we expect, the model with the importance gets the highest scores.
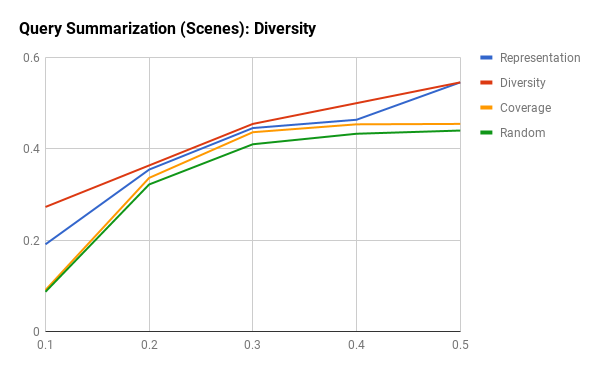
Query Summarization: Diversity
We next look at query based summarization. The goal of query based summarization is to obtain a summary set of frames which satisfy a given query criteria. Figure 8 (third row) qualitatively shows the results for the query ”Sky Scrapers”. The Diversity measure is able to obtain a diversity of the different scenes. Even if there is an over-representation of a certain scene in the set of images satisfying the query, the diversity measure tends to pick a diverse set of frames. The representation measure however, tends to focus on the representative frames and can pick more than one image in the summary from scenes which have an over-representation in the query set. We see this Figure 8. To quantify this, we define a measure by dividing the video into a set of clusters of frames where each cluster contains similar frames. These are often a set of continuous frames in the video. We evaluate this on a set of 10 travel videos, and compare the different models. We see that the diversity and representation models tend to perform the best (Figure 9, bottom left), with the diversity model slightly outperforming the representative models. We also observe that there are generally very few outliers in the case of query based summarization, which is another reason why the diversity model tends to perform well.
Entity Summarization:
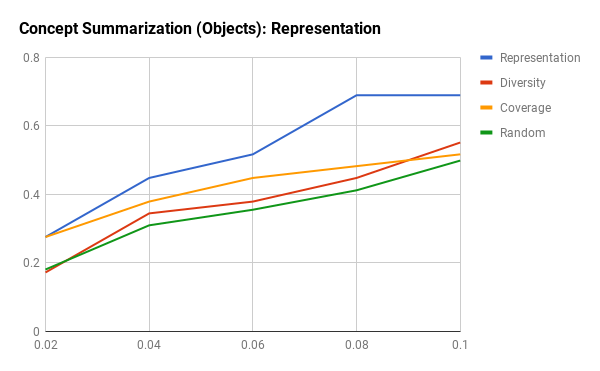
Lastly we look at Entity summarization. The goal here is to obtain a summary of the entities (faces, objects, humans) in the video. Figure 8 (second row) demonstrates the results for Entity summarization of Faces. We see the results for Diversity, Coverage and Representation Models. The diversity model tends to pick up outliers, many of which are false positives (i.e. not faces). The representation model skips all outliers and tends to pick representative faces. To quantitavely evaluate this, we define a representation measure as follows. We remove all the outliers, and cluster the set of entities (objects, faces) into a set of clusters where is a cluster of similar entities. We evaluate this again on a set of 10 videos. Figure 9 (bottom right) shows the results for objects. The results for Faces is similar and in the interest of space, we do not include these. We see that the representation model tends to outperform the other models and skips all the outliers. The diversity model focuses on outliers and hence does not perform as well.
Finally, we demonstrate the computational scalability of our framework. Table 3 shows the results of the time taken for Summarization for a two hour video (in seconds) with and without memoization. The groundset size is . We see huge gains from using memoization compared to just computing the gains using the Oracle models of the functions. All our experiments were performed on Intel(R) Xeon(R) CPU E5-2603 v3 @1.6 GHz (Dual CPU) with 32 GB RAM. Table 4 compares the implementations of Gygli et al [8] and SFO [18]. We see substantial gains with our implementations thanks to memoization.
| Memoization | No Memoization | |||||
|---|---|---|---|---|---|---|
| Function | 5% | 15% | 30% | 5% | 15% | 30% |
| Fac Loc | 0.34 | 0.4 | 0.71 | 48 | 168 | 270 |
| Sat Cov | 0.36 | 0.64 | 0.92 | 55 | 177 | 301 |
| Gr Cut | 0.39 | 0.52 | 0.82 | 41 | 161 | 355 |
| Feat B | 0.16 | 0.21 | 0.32 | 9 | 16 | 21 |
| Set Cov | 0.21 | 0.31 | 0.41 | 5 | 16 | 31 |
| PSC | 0.11 | 0.37 | 0.42 | 7 | 19 | 35 |
| DM | 0.11 | 0.61 | 0.82 | 21 | 125 | 221 |
| DS | 0.21 | 0.63 | 0.89 | 41 | 134 | 246 |
7 Conclusions
This paper presents Vis-DSS, a unified software framework for Data summarization. We describe our engine based on submodular optimization and provide several applications of it, including Image summarization, video summarization, data subset selection for training and diversified active learning. We also show how we can extend this by building a GUI application for video and image summarization. We hope that this toolkit can be used for applications around visual summarization.
References
- [1] Pankaj K Agarwal, Sariel Har-Peled and Kasturi R Varadarajan “Geometric approximation via coresets” In Combinatorial and computational geometry 52 Cambridge University Press, New York, 2005, pp. 1–30
- [2] G. Bradski “The OpenCV Library” In Dr. Dobb’s Journal of Software Tools, 2000
- [3] Shayok Chakraborty, Omesh Tickoo and Ravi Iyer “Adaptive keyframe selection for video summarization” In Applications of Computer Vision (WACV), 2015 IEEE Winter Conference on, 2015, pp. 702–709 IEEE
- [4] Anirban Dasgupta, Ravi Kumar and Sujith Ravi “Summarization Through Submodularity and Dispersion.” In ACL (1), 2013, pp. 1014–1022
- [5] Melanie Ducoffe, Geoffrey Portelli and Frederic Precioso “Scalable batch mode Optimal Experimental Design for Deep Networks”
- [6] Jeremy Elson et al. “CatsvsDogs Dataset”, 2007
- [7] M. Everingham et al. “The Pascal Visual Object Classes (VOC) Challenge” In International Journal of Computer Vision 88.2, 2010, pp. 303–338
- [8] M. Gygli, H. Grabner and L. Gool “Video summarization by learning submodular mixtures of objectives” In 2015 IEEE Conference on Computer Vision and Pattern Recognition (CVPR), 2015, pp. 3090–3098 DOI: 10.1109/CVPR.2015.7298928
- [9] M. Gygli, Y. Song and L. Cao “Video2GIF: Automatic Generation of Animated GIFs from Video” In 2016 IEEE Conference on Computer Vision and Pattern Recognition (CVPR), 2016, pp. 1001–1009 DOI: 10.1109/CVPR.2016.114
- [10] Michael Gygli, Helmut Grabner, Hayko Riemenschneider and Luc Van Gool “Creating Summaries from User Videos” In ECCV, 2014
- [11] Michael Gygli, Helmut Grabner, Hayko Riemenschneider and Luc Van Gool “Creating summaries from user videos” In European conference on computer vision, 2014, pp. 505–520 Springer
- [12] Kaiming He, Xiangyu Zhang, Shaoqing Ren and Jian Sun “Deep Residual Learning for Image Recognition” In arXiv preprint arXiv:1512.03385, 2015
- [13] R. Iyer, J.. Halloran and K. Wei “Jensen: An Easily-Extensible C++ Toolkit for Production-Level Machine Learning and Convex Optimization” In ArXiv e-prints, 2018 arXiv:1807.06574
- [14] Yangqing Jia et al. “Caffe: Convolutional Architecture for Fast Feature Embedding” In arXiv preprint arXiv:1408.5093, 2014
- [15] A. Khosla, R. Hamid, C. Lin and N. Sundaresan “Large-Scale Video Summarization Using Web-Image Priors” In 2013 IEEE Conference on Computer Vision and Pattern Recognition, 2013, pp. 2698–2705 DOI: 10.1109/CVPR.2013.348
- [16] G. Kim, L. Sigal and E.. Xing “Joint Summarization of Large-Scale Collections of Web Images and Videos for Storyline Reconstruction” In 2014 IEEE Conference on Computer Vision and Pattern Recognition, 2014, pp. 4225–4232 DOI: 10.1109/CVPR.2014.538
- [17] Davis King “High Quality Face Recognition with Deep Metric Learning”, 2017 URL: http://blog.dlib.net/2017/02/high-quality-face-recognition-with-deep.html
- [18] Andreas Krause “SFO: A toolbox for submodular function optimization” In Journal of Machine Learning Research 11.Mar, 2010, pp. 1141–1144
- [19] Alex Krizhevsky, Ilya Sutskever and Geoffrey E Hinton “ImageNet Classification with Deep Convolutional Neural Networks” In Advances in Neural Information Processing Systems 25, 2012, pp. 1097–1105
- [20] Y.. Lee, J. Ghosh and K. Grauman “Discovering important people and objects for egocentric video summarization” In 2012 IEEE Conference on Computer Vision and Pattern Recognition, 2012, pp. 1346–1353 DOI: 10.1109/CVPR.2012.6247820
- [21] Hui Lin and Jeff Bilmes “A class of submodular functions for document summarization” In Proceedings of the 49th Annual Meeting of the Association for Computational Linguistics: Human Language Technologies-Volume 1, 2011, pp. 510–520 Association for Computational Linguistics
- [22] Wei Liu et al. “SSD: Single Shot MultiBox Detector”, 2016
- [23] Michel Minoux “Accelerated greedy algorithms for maximizing submodular set functions” In Optimization Techniques Springer, 1978, pp. 234–243
- [24] J. Redmon and A. Farhadi “YOLO9000: Better, Faster, Stronger” In 2017 IEEE Conference on Computer Vision and Pattern Recognition (CVPR), 2017, pp. 6517–6525 DOI: 10.1109/CVPR.2017.690
- [25] Anurag Sahoo et al. “A unified multi-faceted video summarization system” In arXiv preprint arXiv:1704.01466, 2017
- [26] I. Simon, N. Snavely and S.. Seitz “Scene Summarization for Online Image Collections” In 2007 IEEE 11th International Conference on Computer Vision, 2007, pp. 1–8 DOI: 10.1109/ICCV.2007.4408863
- [27] Jamshid Sourati et al. “Classification active learning based on mutual information” In Entropy 18.2 Multidisciplinary Digital Publishing Institute, 2016, pp. 51
- [28] M. Sun, A. Farhadi, T. Chen and S. Seitz “Ranking Highlights in Personal Videos by Analyzing Edited Videos” In IEEE Transactions on Image Processing 25.11, 2016, pp. 5145–5157 DOI: 10.1109/TIP.2016.2601147
- [29] Maxim Sviridenko “A note on maximizing a submodular set function subject to a knapsack constraint” In Operations Research Letters 32.1 Elsevier, 2004, pp. 41–43
- [30] Sebastian Tschiatschek, Rishabh K Iyer, Haochen Wei and Jeff A Bilmes “Learning mixtures of submodular functions for image collection summarization” In Advances in neural information processing systems, 2014, pp. 1413–1421
- [31] Kai Wei, Rishabh K Iyer and Jeff A Bilmes “Fast Multi-stage Submodular Maximization.” In ICML, 2014, pp. 1494–1502
- [32] Kai Wei, Rishabh Iyer and Jeff Bilmes “Submodularity in Data Subset Selection and Active Learning” In Proceedings of the 32nd International Conference on Machine Learning 37, Proceedings of Machine Learning Research Lille, France: PMLR, 2015, pp. 1954–1963 URL: http://proceedings.mlr.press/v37/wei15.html
- [33] Kai Wei, Rishabh Iyer and Jeff Bilmes “Submodularity in data subset selection and active learning” In International Conference on Machine Learning, 2015, pp. 1954–1963
- [34] Kai Wei et al. “Submodular subset selection for large-scale speech training data” In IEEE International Conference on Acoustics, Speech and Signal Processing, ICASSP 2014, Florence, Italy, May 4-9, 2014, 2014, pp. 3311–3315
- [35] W. Wolf “Key frame selection by motion analysis” In 1996 IEEE International Conference on Acoustics, Speech, and Signal Processing Conference Proceedings 2, 1996, pp. 1228–1231 vol. 2 DOI: 10.1109/ICASSP.1996.543588
- [36] Laurence A Wolsey “An analysis of the greedy algorithm for the submodular set covering problem” In Combinatorica 2.4 Springer, 1982, pp. 385–393
- [37] Chunlei Yang, Jialie Shen, Jinye Peng and Jianping Fan “Image collection summarization via dictionary learning for sparse representation” In Pattern Recognition 46.3 Elsevier, 2013, pp. 948–961
- [38] Bolei Zhou et al. “Learning deep features for scene recognition using places database” In Advances in neural information processing systems, 2014, pp. 487–495