Weak nodes detection in urban transport systems: Planning for resilience in Singapore ††thanks: Luca Pappalardo has been partially funded by the European project SoBigData RI (Grant Agreement 654024). Gianni Barlacchi has been partially funded by the EIT project Cedus.
Abstract
The availability of massive data-sets describing human mobility offers the possibility to design simulation tools to monitor and improve the resilience of transport systems in response to traumatic events such as natural and man-made disasters (e.g., floods, terrorist attacks, etc…). In this perspective we propose Achilles, an application to models people’s movements in a given transport mode through a multiplex network representation based on mobility data. Achilles is a web-based application which provides an easy-to-use interface to explore the mobility fluxes and the connectivity of every urban zone in a city, as well as to visualize changes in the transport system resulting from the addition or removal of transport modes, urban zones and single stops. Notably, our application allows the user to assess the overall resilience of the transport network by identifying its weakest node, i.e. Urban Achilles Heel, with reference to the ancient Greek mythology. To demonstrate the impact of Achilles for humanitarian aid we consider its application to a real-world scenario by exploring human mobility in Singapore in response to flood prevention.
Index Terms:
urban science, data science, human mobility, complex systems, network science, multiplex networks, resilience, social goodI Introduction
Cities are a physical manifestation of continuous processes of human interaction and of the weaving and knitting of social relations unfolding through space and stratifying through time. Cities are inherently “hard” to understand; their interlacing facets and tangled assemblages render them difficult to frame [9, 27, 26]. In particular, the nexus of human mobility patterns, transport planning choices and urban policies pose great difficulties for scientific modelling. It presents, in fact, what Rittel et al. [36] call a “wicked problem”, that is, a problem whose social nature and lack of objective truth makes inherently hard to tackle with traditional analytic tools.
Despite being still far from adequately composing these problems [9], nowadays the variability of massive data describing human movements allows planners and policy-makers to face relevant urban challenges through computational methods [12, 37, 15, 6, 33, 4, 1, 32, 5]. While the observation of mobility flows offer for instance the possibility to investigate the inner workings of urban transport systems, this is not enough for efficient transport planning. As Ganin et al. [17] note, traditional transport studies focus on efficiency measure by observing a transport network under normal operating conditions. This approach though fails to capture information that really matters for real-world applications, i.e. how the network reacts when is under stress conditions. Such is the case of traumatic events that might cause disruption of service or worse, like in the event of natural or man-made disasters (e.g., floods, terrorist attacks, etc.). Thus, uncovering weak points that affect a network’s resilience, a proven key metric for transport policies [17], is not only a task of paramount relevance for the design of proper intervention scenarios in case of disasters, but also an actual requirement for managing transport services in complex global cities like Singapore. We refer to such weak points as Urban Achilles Heels.111https://en.wikipedia.org/wiki/Achilles%27_heel
Starting from these considerations, we address the following questions: (i) What and where are the weakest transport routes in a city, i.e., its Urban Achilles Heels? (ii) Given some changes in the transport system, what scenarios are likely to occur and what is their impact on human mobility and on the resilience of a transport system?
Here we propose Achilles, a web-based application which provides an easy-to-use interface to explore the mobility fluxes and the connectivity of urban zones in a city, as well as to visualizes changes in the transport system resulting from the addition or removal of transport modes, urban zones and single stops. Achilles is based on a multiplex network representation of mobility data [14], where every layer describes people’s movements with a given transport mode, e.g. buses, metros, taxis. A node in a layer represents an urban zone of the city, edges indicate routes between zones and edge weights indicate the amount of people moving between two nodes in a given time window. Achilles exploits this network representation and allows the user to visualize changes in the transport system resulting from the addition or removal of transport modes, urban zones and single stops. Notably, Achilles allows to compute the Heel-ness of a zone, a measure introduced in this paper which indicates the probability of a zone to disconnect the network when edges adjacent to it are removed. The computation of the Heel-ness allows Achilles to state that the transport system has an Urban Achilles Heel if there is at least one urban zone with a non-zero Heel-ness.
We show how Achilles can be used to explore human mobility in Singapore and test the resilience of its network to natural disaster, by using mobility data from several sources. The application allows to point out weak routes among urban areas in the city (i.e., routes where public transport does not meet the needs of the citizens), and simulate changes in the capacity of public transport to satisfy needs of citizens when specific events occur in the city, e.g. closing/adding transport modes or subway/bus stops. Additionally, it can be used by supplement humanitarian agencies for resilience preparedness and response, and in general fragile contexts where there is a dire need of deploying fast, scalable and effective humanitarian aid. Our approach is in fact highly flexible since it uses only data about transport and mobility flows. Given that many open datasets of such nature are nowadays publicly available222https://data.gov.sg/group/transport, our approach can be potentially applied to any other urban area to simulate traffic changes due to specific events, such as the impact of adding or removing transport modes or stops, the impact of closing the access to an urban area, or the organization of city-wide public events.
II Related Work
Understanding human mobility is a long-standing and highly relevant challenge for today’s increasingly urbanized world [40]. In their reconstruction of the discipline’s evolution Barbosa-Filho et al. [3] highlight how through time different scientific communities attempted to frame it using disparate data sources; starting from geographers’ studies of spatial interaction and regional migration [42, 21]. It is only recently though that significant advancements having been made due to novel data sources, such as Call Detail Records (CDRs) and GPS location data collected through mobile phone devices [19, 33] and analyzed through the lens of network science [39, 8].
Using precisely methods from network science we can design powerful models and simulation tools for what-if analysis of different urban planning scenarios [30, 25]. Singapore, due to the complexity of its transport system, is precisely a global city where such tools would be particularly valuable [24]. Network science applied to the study of transport systems has proved to be increasingly useful in recent years. Xu and González [41] have shown that a slight re-routing of a fraction of daily car commutes produces significant reductions in traffic, thus alleviating the congestion state of the overall transport system. In this perspective the development of data-driven analytic tools can help control the transport system and improve both the customer’s travel experience and the system’s overall efficiency. Çolak et al. [11] have investigated the interplay of number of vehicles and road capacity to determine the level of congestion in urban areas. In particular, they show that the ratio of the road supply to the travel demand can explain the percentage of time lost in congestion. De Domenico et al. [14] show that the efficiency in exploring the transport layers depends on the layers’ topology and the interconnection strengths.
Although these works doubtlessly shed light on interesting aspects about the structure of urban transport, they do not provide easy-to-use tools for exploring a city’s demand for mobility and the efficiency of the related transport system. Giannotti et al. [18] partly overcome this problem by proposing a querying and mining system (M-Atlas) for extracting mobility patterns from GPS tracks. This system, still, does not provide a method to assess weak points in cities, those that will collapse first in case of traumatic events.
Wang et al. [22] highlight in fact many studies in resilience engineering that try capture different facets of the problem at stake, often tackling the most disparate domains (e.g., from spatial economics [35] to computer networks [38] and socio-ecological systems [2]). However, as pointed out by [17], since the majority of transport-oriented policies stress efficiency aspects measured under optimal conditions, and neglect to consider instead stress scenarios that happen in the real word, there is still a need to provide policy-makers with adequate tools to actually capture a transport network resilience; here intended once again as the network’s capacity to recover from a catastrophic event returning to its original working state. Moreover, there is still a need to design tools to test and prototype scenarios for rapid response under critical conditions.
III Data Sources
In this work, we use different data sources from the city of Singapore with information about (i) transport, (ii) administrative boundaries, (iii) mobility flows and (iv) floods.
Transport Data
The public transport data are provided by LTA Data Mall333https://www.mytransport.sg/content/mytransport/home/dataMall.html, which published a wide variety of land transport-related datasets both static and in real-time. In this work we use data about bus lines444https://www.mytransport.sg/content/mytransport/home/dataMall.html, which provide information to build a transport network describing the displacements of inhabitants between different urban zones of Singapore. In particular, for every bus line, we retrieve information about its stops and the GPS traces describing the bus route.
Administrative boundaries
The urban zones areas are provided through the shape-files at different administrative division levels of the city, and are available at the website data.gov.sg555https://data.gov.sg/dataset/master-plan-2014-subzone-boundary-web. We use the most fine-grained division and, by applying a spatial join operation, assign every bus stop to the corresponding urban zone. The resulting dataset contains 323 urban zones and 4856 bus stops.
Mobility flows
We use data indicating both the presence of people in every urban zone and the fluxes of people, i.e. Origin-Destination (O-D) matrices [23] between urban zones at a given date and time. Such data were obtained from the data-as-a-service APIs provided by DataSparkAnalytics666https://www.datasparkanalytics.com/products/data-as-a-service. In particular, the presence of people and the O-D matrix are estimated starting from the mobile network data provided by different Asian telco operators. It is worth mentioning that location signals from the telcos are analysed in an anonymous and aggregated way. We use these data to estimate the number of people moving by bus between two urban zones in a given time window, since official information about the number of users traveling on the buses is not available. We aggregated the flows by hour.
Flooding data
Flood prone areas forecasts, computed by the Singapore’s Public Utilities Board (PUB), are provided as an incentive to reduce the risk of recurring flood events and to foster proactive measures among developers and the general public. We used such areas, retrievable at www.pub.gov.sg777https://www.pub.gov.sg/drainage/floodmanagement to inform our use-case with substantiated data related to a real-world problem related to a specific setting.
We hence obtain for every urban zone : (i) the bus stops in , (ii) the bus lines passing through , and (iii) all the urban zones connected to . We define two urban zones and to be connected if there is at least one bus line connecting and .
It is worth to mention that despite our experiment being limited to the bus network system, due to limited data availability, further extensions to truly multimodal systems can be integrated with ease. This will enhance the modelling of transport planning scenarios with increased reliance and confidence. Limitations standing, our proposed tool can already serve for specific use-cases, such as precisely the considered instance of Singapore’s bus network resilience to floods.
IV Methodology
The use of complex networks to analyze complex systems is a powerful way to simplify the description of a problem by means of a process of abstraction. This process reduces the complexity of the structure to two simple elements: nodes, i.e. the objects of the system, and edges, i.e. the relations between these objects. However, such a representation can lead to a strong loss of information about the real system characteristics.
In this context, an interesting novel approach was proposed by De Domenico et al. in their seminal work on multilayer networks [13]. They have proposed a new framework in which it is possible to encode information about the different possible relations between the nodes of the system in different layers. Each of these layers represents a specific kind of relation between a set of nodes and can be considered as a partial representation of the whole system without the loss of a simple structure representation: for example, a sub-network describing a specific kind of relation between the nodes of the network, which again reflects some of the properties or the characteristics of the complex system. In this work we adopt a similar mathematical formulation to describe the transport system of an urban environment. To better describe the transport system of the city we are studying, in Section VI we specifically model the network structure to best fit the city characteristics following the more general formulation discussed herein.
In an urban area, two zones can be connected through several transport means (e.g., bus, taxi, subway, etc.). As each transport mean differs from the other, also each subway or bus line differs from the others. In fact, using two different lines of the same mean require a transfer at some stop. In turn, each of these transport modes may be considered as a set of different lines following a specific path; connecting specific zones of an area; and eventually, can be considered as an additional layer of the system. To express this kind of information we introduce the concept of urban multiplex network by means of the following definition:
Definition
An Urban Multiplex Network (UMN) is a network in which two nodes represent zones of an urban area and can be connected, at the same time, by multiple edges that belong to different layers. We model such structure with an edge-labeled multi-graph denoted by where is a set of nodes, i.e. the zones in which the area we are studying is divided; is a the set of layers which encode the information about the different possible types of connections between two nodes, e.g. the public transport mean characterization and/or the line number; is a set of labeled edges, i.e., a set of triples where are two nodes, and is a layer of the multiplex network.
The global connectivity of two zones, which is the multidimensional connectivity (i.e., the connectivity considering all the layers of the network) in an urban area is a combination of two elements: (i) connection intensity and (ii) connection redundancy. We define the intensity of the connection between two zones on a single layer as:
Definition
Connection intensity
| (1) |
where is a weight function representing the mobility flux between two zones on layer , and is the set of neighbours of the zone .
Connection intensity consists hence of two factors: the first factor, , indicates the percentage of people moving between the two zones using a specific transport layer and line . The second factor, , is the percentage of common neighbours, , with respect to the most selective zone, . The idea is that, on each layer, the connection intensity is influenced by the number of displacements between the two zones, weighted by the value of selectiveness of the most selective zone, i.e. the ratio between the neighbours shared by the two zones and the number of neighbours of the zone with the smallest set of neighbours.
The second element on which global connectivity depends is connection redundancy, which takes into account the relevance of a layer in the all-layers zone’s connectivity. This quantity measures to what extent the removal of the links belonging to a specific layer affects the capacity to reach a neighbouring zone from the considered one. Redundancy in general is a measure of the strength of node-node connections considering the links connecting the two nodes over all the layers of the network. Before defining the connection redundancy, however, we need to introduce the layer relevance, , for the node .
can be defined as the ratio between the number of nodes that disconnect from node if all the links of layer are removed (which is the same as removing an entire layer to the multiplex network) and the number of nodes reachable before the removal of the layer[10]:
Definition
Layer Relevance
| (2) |
where is the number of reachable nodes from node using all the multiplex network’s layers , while is the number of reachable nodes from after the removal of layer , i.e. the reachable nodes from considering only the set of layers .
Definition
Connection Redundancy
| (3) |
where is a vector element of the adjacency tensor of the multiplex that keeps track of the presence of edges between node and node over the different layers.
We give a higher score to the edges that appear in several layers, so we are interested in the complement of those values. If the two areas are linked in more than one layer, the score raises until a maximum of 1.
We combine connection intensity and connection redundancy taking into account the multidimensionality of multilayer network’s connectivity: a greater number of connections on different layers is reflected in a greater chance of having a strong connectivity.
Definition
(Global) Connectivity.
Let be two nodes and be the set of layers of an urban multiplex network . The connectivity of two urban areas is defined as:
| (4) |
It is worth noticing that the measure proposed can be used to estimate the strength of the connectivity between nodes also in single-layer networks, in which is one and the overall sum is .
The aim of this work is to provide policy-makers, transport planners and humanitarian agencies with a working tool that has the versatility to adapt to different urban areas and the capacity to quantify the level of susceptibility to disruptive events related to a transport system own structure. More specifically, we are interested in studying the weaker ties as those potentially responsible for the disruption of the multiplex network. In particular, to study the weaknesses of a specific network, we introduce the notion of Heel-ness as the relative importance of a node in the context of network navigability.
Definition
Heel-ness.
Given a zone , the Heel-ness of is defined as:
| (5) |
where is the set of neighbors of , is the set of reachable nodes from node while is the set of reachable nodes from node after the removal of the edge . As a consequence of these definitions is the number of non-reachable nodes after the removal of the edge .
This metric quantifies this importance in terms of optimal disruptive events classified following the Granovetter’s theory for single-layer networks [20]: the importance of a node in preserving a network’s giant component depends on the connectivity of the node. In particular, nodes which shares weak connections tend to be those more important to be preserved. Heel-ness measures the importance of a node considering the weakest connection it has, and the number of unreachable nodes after that edge disruption. The Granovetter’s theory was proposed in 1973 in the context of social networks. Since then it was studied and proposed in countless different fields of application. Following a similar approach we adapt the measures introduced in [31] to detect important ties in transport networks. In particular we focus our attention on the topological resilience of multilayer networks as proposed in [14]. Topological resilience studies the robustness of a network in resisting to topological failures, such as edge removal. Heel-ness measures the single-event effects of the network and ranks them depending on the greatest damage they can inflict to the network structure if one particular edge is removed. Extending then the idea from [20] to transport networks allows us to refer to weak ties as those edges that make the network more fragile and susceptible to targeted edge loss. We stress further that topological resilience takes into account only the network structure while edges can be weighted in such a way that more important links, e.g. in a transport network those links that sustain higher traffic flows, are naturally considered as more crucial for the overall system connectivity.
Being able to classify nodes depending on the importance of their connection in the network, we can classify networks based on the presence or absence of fragile nodes. Using the definition of Heel-ness we can state that an urban multiplex network has an Urban Achilles Heel if there is at least one node for which the Heel-ness has a non-zero value.
Definition
Urban Achilles Heel.
We define the Urban Achilles Heel of a multiplex network as the node for which
| (6) |
This definition provides a classification based on a first-order disruptive event, i.e. an event that only causes the loss of a single edge. However, the extension of this definition to further orders is straightforward and can be done by sub-sequential removal of the weakest ties of the network.
Applying this definition to real transport networks can help in the identification of important edges and nodes that are crucial for the stability and routing of all zones in an urban area.
V Application Design
The application is freely available online at http://achille.fbk.eu. For scientific dissemination and to provide access for a larger external non-technical audience it was also complemented by a video-tutorial http://achille.fbk.eu/about. The application design follows closely the analytical framework described in Section I, while implementing a client-server architecture pattern. We implemented a RESTful web service using Flask, a widely used micro web framework written in Python. In the REST architecture the server exposes the resources to a client trough a set of defined URLs. For example, in order to get the list of buses passing trough an area, the endpoint is defined as http://achille.fbk.eu/area/<id_area>/services. This API is responsible not only for data provisioning, but also acts as the communication layer between the user and the network models. It is worth noting that, given its modularity, our application can be re-purposed as an agnostic provider of services to other consumers. In particular, the exposed methods consist in:
-
•
a query endpoint returning the network features’ geometries for a given urban zone ID, and additional information used to populate the geographic map application;
-
•
a second query endpoint returning for each given urban zone ID the computed network metrics, i.e., Connection intensity, Connection Redundancy, Connectivity (Section IV).
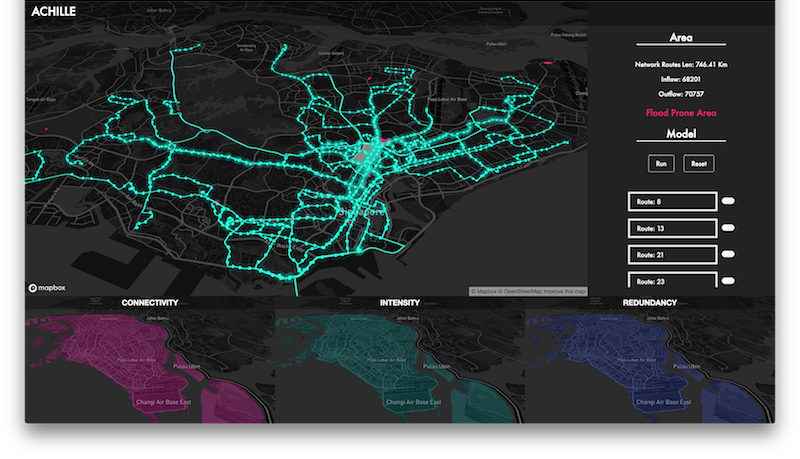
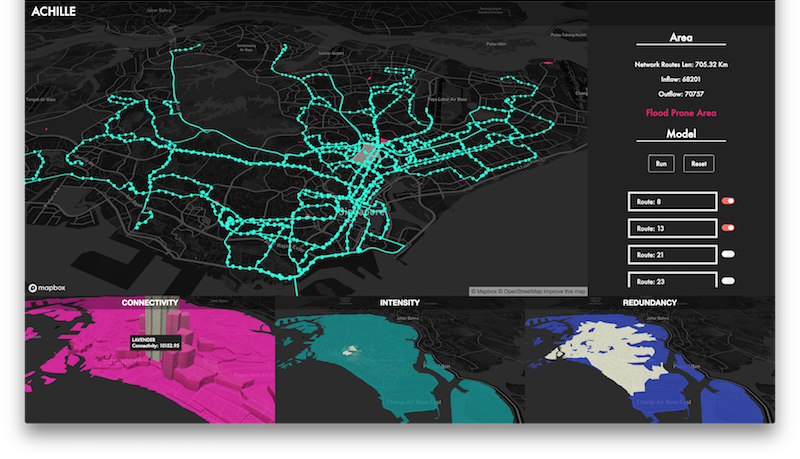
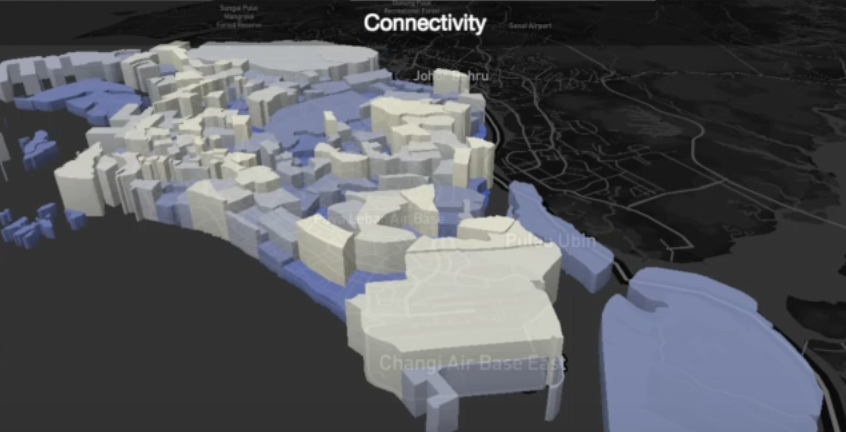
The front-end application is thus the entry-point for quickly interacting and prototyping future transport scenarios. The User Interface (UI), visible in Figure 1, has been developed with easiness of use and clarity of interpretation its standard pillars. It allows a non-technical audience to inspect the number of routes connecting an urban zone to the rest of the city simply by clicking on an urban zone in the city panel and control them via an interactive menu (Figure 1). Upon addition/removal of one or more routes in the menu, the user can trigger the calculation of the network metrics (Figure 2), which are promptly displayed in three separate windows. Every window shows a 3D map of the city, where an urban zone’s height is proportional to its average networks value computed over the connected urban zones (Figure 3). The menu and the bottom windows allow the user to simulate how the city’s connectivity changes after, for example, the construction of a new route or the temporary closing of an existing one. Further, the identification of sensitive areas, the so-called Urban Achilles Heel, can be accessed through a revealing button. The example in Figure 2 presents four areas in the northern part of Singapore.
All of the geographic map components are fully interactive and built with the latest web-mapping technologies taking advantage of latest WebGL standards and 3D capabilities; as such, they allow for a most fluid and seamless experience. This is a crucial factor that allows the application to hide the complexity of the models behind a fluid interface. It also let the technological stack move out of the way, making room for discussions and human elements that enhance decision-making processes.
VI Case study: Floods prevention in Singapore
In the following section we discuss the specific modeling adopted for the Singapore’s transport network and the results obtained by studying the structure of the system and its resilience to synthetic disruptive events.
VI-A Network structure
When dealing with real-world problems a case-dependent modelling usually ensures better performances and results in terms of actionable solutions. In the advanced case study, we deal with Singapore’s transport network with the aim to specifically uncover possible solutions to disruptive events (e.g. intense rainfall and consequent floods…) which might negatively impact the road network. We apply the methodology presented in section IV considering the reduced transport network composed by more than 300 different scheduled bus lines. This operation enable us to scope down the issues and focus solely on those related to the road network.
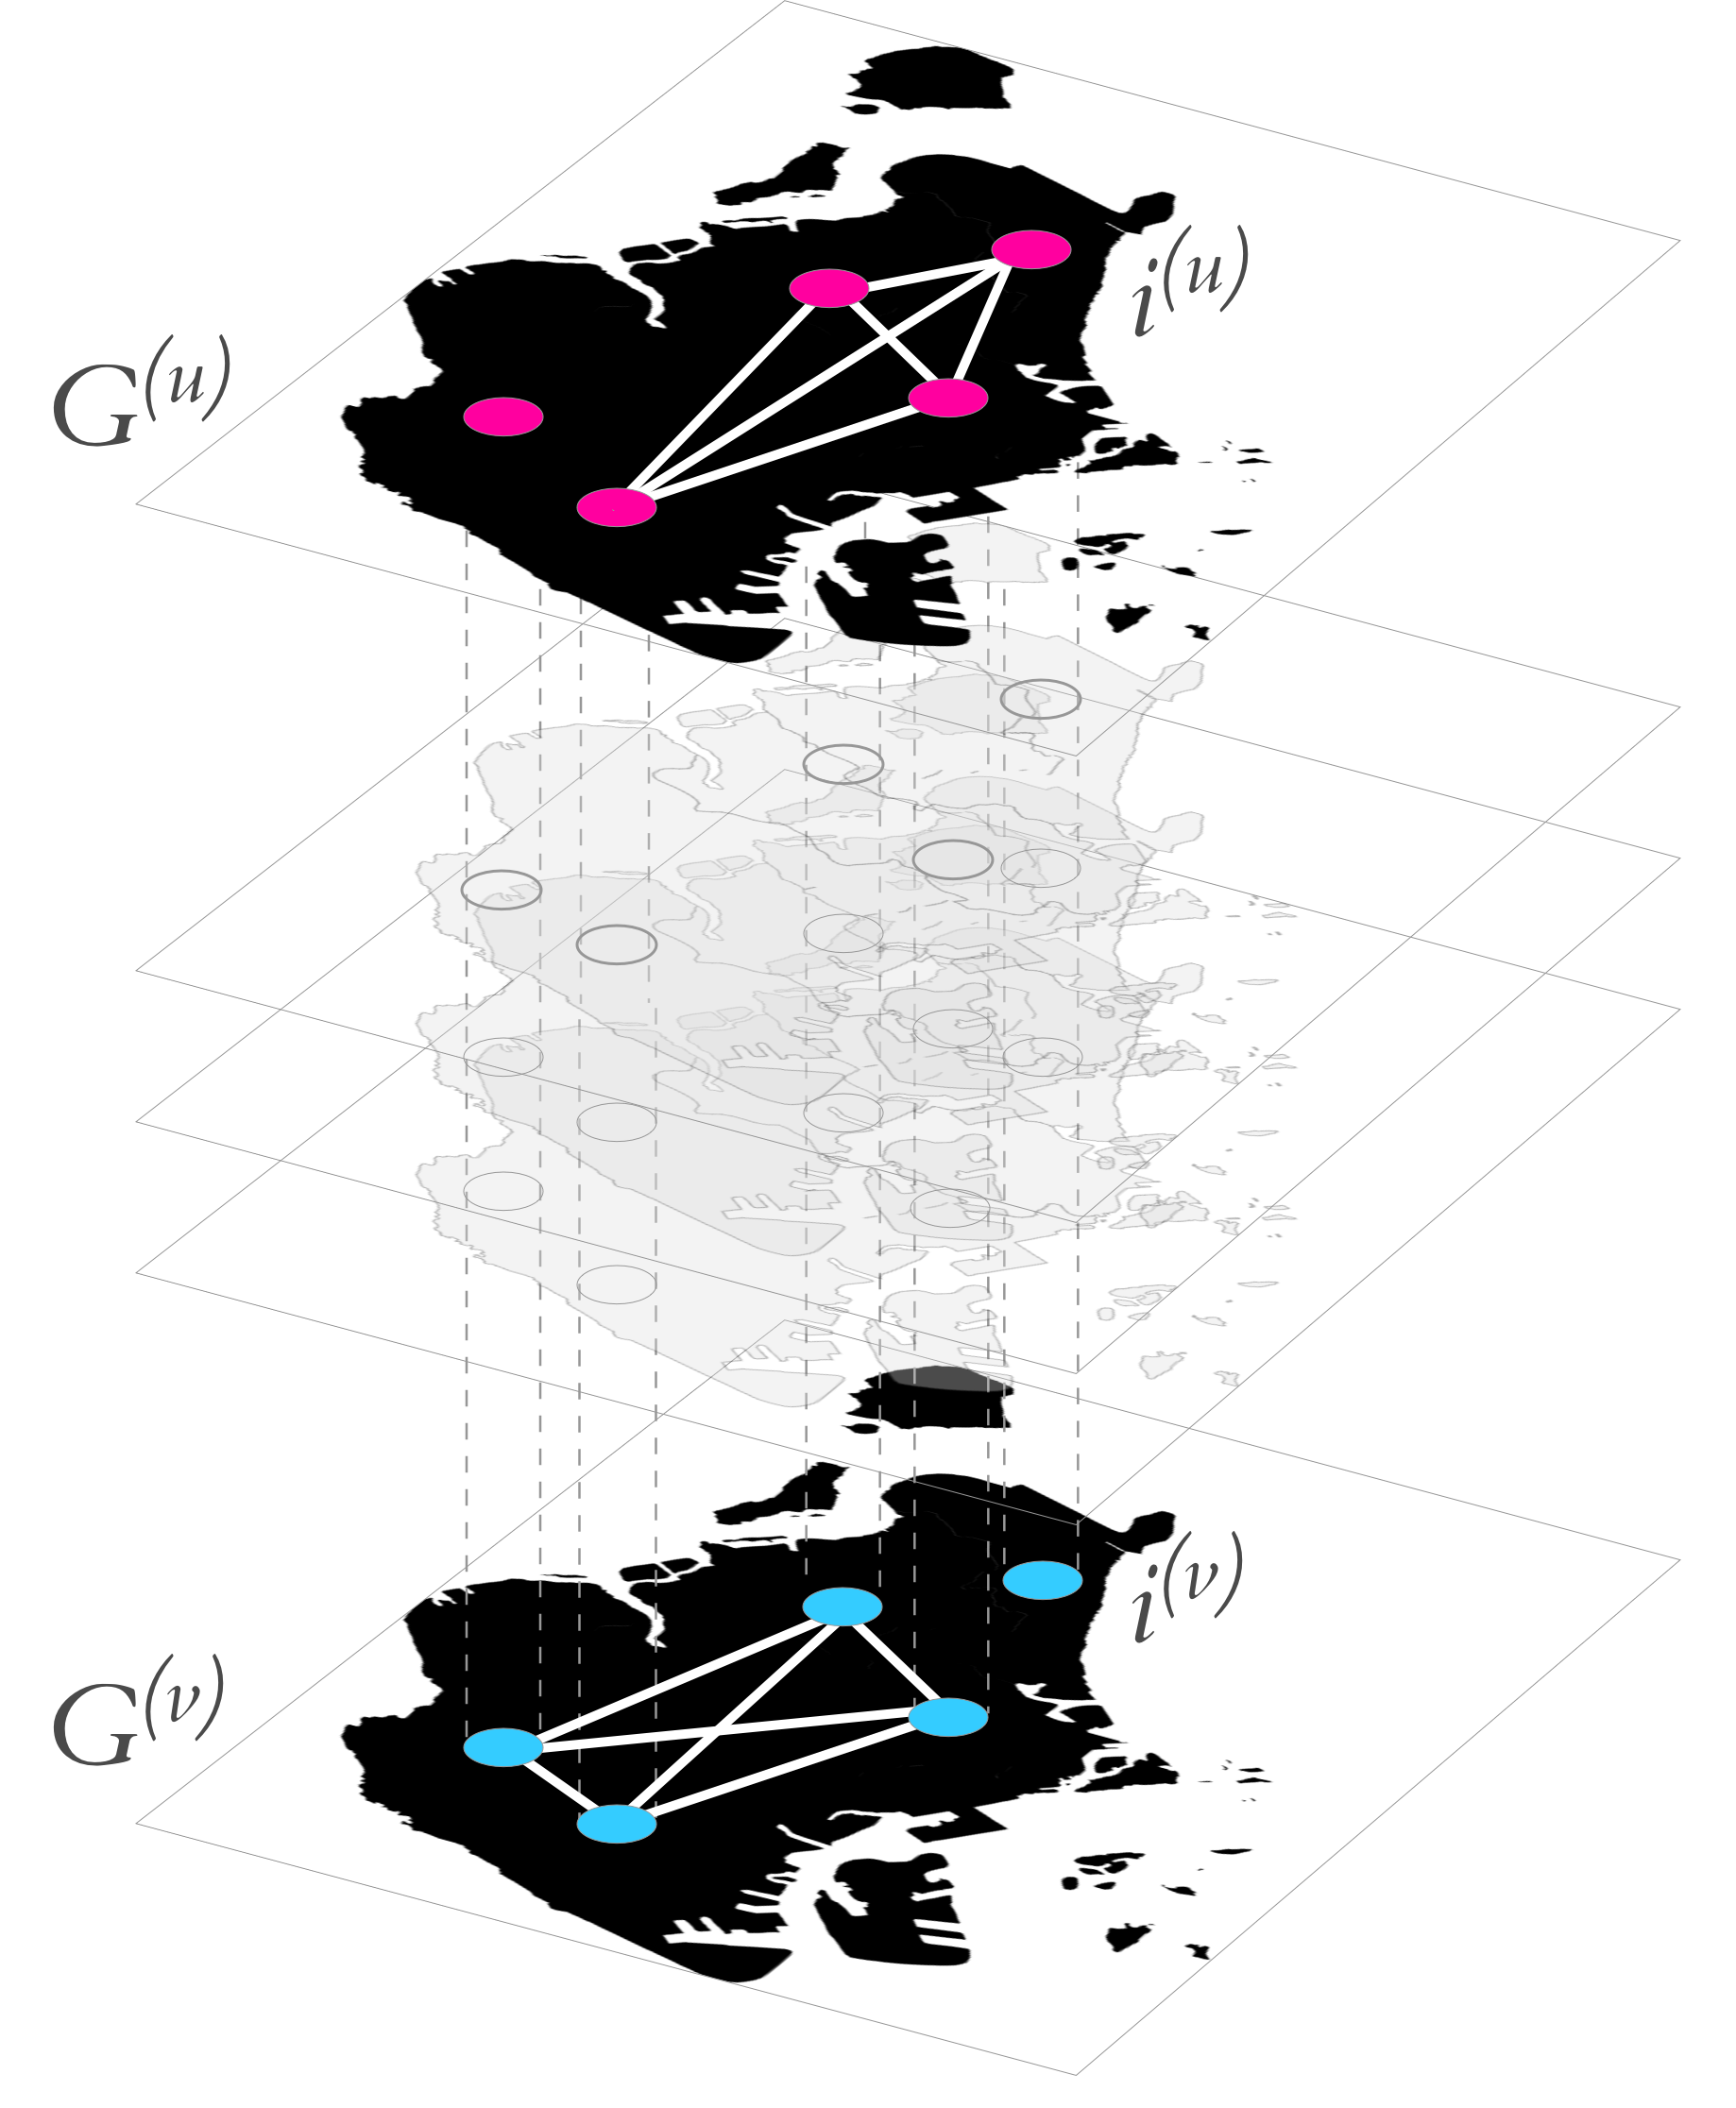
In our framework, each bus line represents a layer of the network; each layer consists of all the Singapore’s administrative areas (according to a government sanctioned classification available at data.gov.sg888https://data.gov.sg/dataset/master-plan-2014-subzone-boundary-web); each zone is a node of the multiplex. Further, each bus line fully connects to every zone in which a bus line has a stop with all the others zones in which the same bus line has a stop. In this configuration, disruptive events that involves only limited zones, which may not necessarily disconnect the entire line if a reroute is prompted, are taken into account. The model is indeed built in such a way that edges can be removed gradually depending on the nature of the disruptive event we want to simulate. In figure 4 we schematically represent the network structure used to model and analyze the Singapore’s bus transport network. As depicted, each layer share with the others the same nodes but changes the connections between the zones depending on the bus line it represents.
Even in this specific network configuration, the metrics introduced in section IV maintain their significance. The relevance of each layer depends, in fact, on the relative number of neighbours in a layer with respect to the multiple degree of the node. In particular, the shape of the connectivity, implemented from the definition proposed in [10] ensures that the Heel-ness of a node consistently depend on the node’s layer relevance and the node’s connection redundancy instead that only on the connection intensity. We stress that, if this would have been the case, fully connected layers would have brought to an initial connectivity measure that would have encoded only operational information, i.e. information about the mobility flow passing trough links, for all the nodes that share the same bus lines independently on the possible different size of the disconnected component they might cause after a disruptive event involving one or all of their connections. This highlight the importance of a combined approach that considers both the structure of the multilayer network, i.e. relevance and redundancy of the connections, and the network usage, i.e. the information about mobility flows over different links.
VI-B Experiments
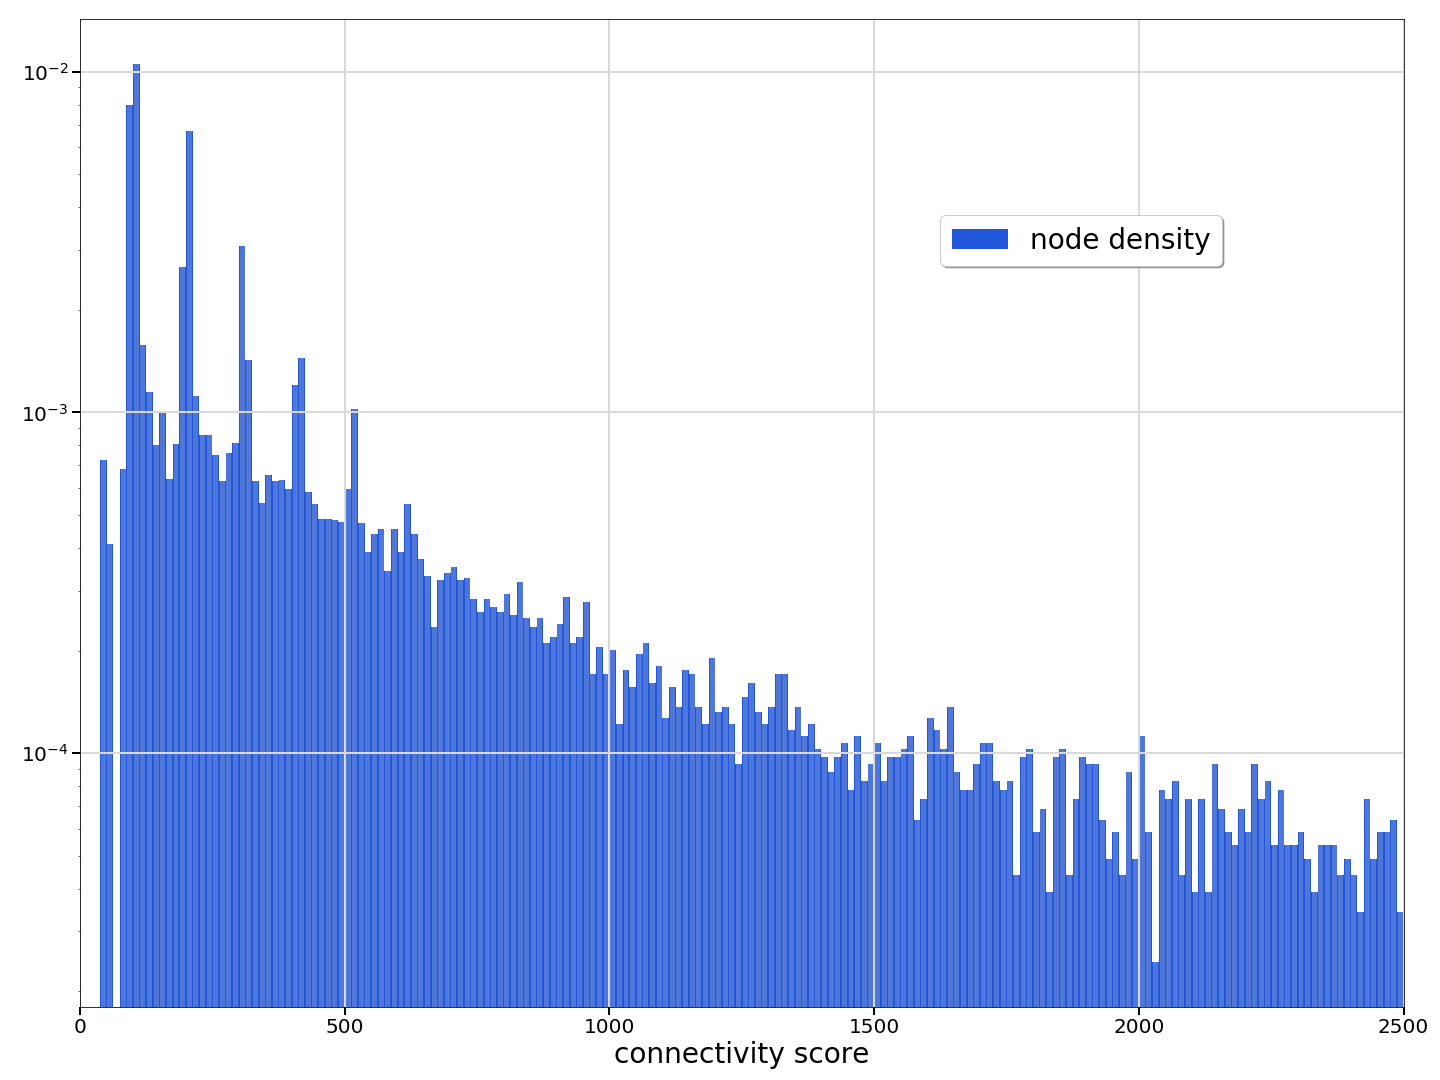
Moving from of the aforementioned considerations we conducted an extensive connectivity assessment by observing Singapore’s urban network resilience to the removal of high and low connectivity links separately. We use this case study to test the behavior of multilayer node connectivity, as defined in IV, on a real transport network. To this extent we compute the connectivity for every node in the network and we sort them accordingly to the obtained score. In figure 5 we show the connectivity for the network in its initial configuration. We can see that there are two dominant behaviors.
The left side of the histogram consists of areas with a low connectivity score. These are the areas dominated by the contributions given by the number of layers who share a connection showing different peaks. Each peak corresponds to the different number of shared layers. The right side consists of those urban zones that are geographically central and functionally important urban nodes; the number of layers that two such nodes share is no more dominating the contribution to the connectivity score, while its increasing importance is given by the length of the different bus lines and number of nodes they are connected with.
As illustrated in Figure 5, connectivity can be used to classify and sort nodes depending on the strength and importance of their ties. This allows us to test the weak ties theory for transport networks.
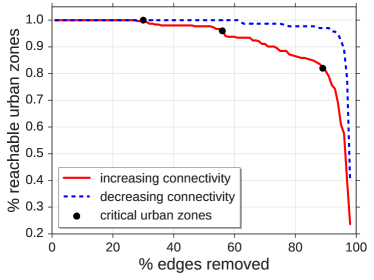
We start by removing the weakest tie in the network, and the subsequent in decreasing order of weakness, iterating the computation after each removal. The expected outcome is a faster network percolation than achieved adopting an opposite strategy, i.e. removing the stronger ties of the network first. The result of this experiment are presented in Figure 6. The relative size of the largest network component changes with the removal of a given percentage of links. The values are sorted by increasing (red solid line) or decreasing (blue dashed line) connectivity-score order. The red line shows the different speed of percolation faced by the same system under targeted attacks with different strategies.
Additionally, it is worth noting how the network faces a first significant disruption after the removal of more than 50% of total number of edges. This finding holds even with the adoption of a more effective disruptive strategy. Such result highlights the high degree of resilience exhibited by Singapore’s bus network, which is consistent with the city’s highly efficient transport network [7]. Further studies might benefit thus from replicating the above experiments in other locales with different transport systems, to check whether a similar pattern is present and how it behaves to disruptive events.
VII Discussion and Implications
Our simulated experiment has been conducted, due to data availability, only on the bus transport layer. However, it is straightforward to extend our framework to multiple transportation systems (e.g., metro and train). Testing the network resilience to the aforementioned stress conditions in a truly multimodal perspective represents thus an important tool at disposal of transport planners to assess (i) the current state of the transport network; (ii) to plan future operations; (iii) and to keep running the system at its overall optimal capacity.
In particular, we found that Singapore has a resilient urban network, as all the nodes are still reachable when removing up to 30% of the links. Moreover, the deletion of links in decreasing order of connectivity affect less the network’s global connectivity, as more than 97% of the urban zones are still reachable after the removal of 90% of the links (Figure 6, blue dashed line). In contrast, when deleting the links in increasing order of connectivity the network crumbles faster, as almost 20% of urban zones become unreachable after the removal of 90% of the links (Figure 6, red solid line). These results suggest that the proposed connectivity and risk metrics can profitably be deployed to discover those urban connections whose existence is crucial for the network resilience. Moreover, those metrics can also help to evaluate the impact of changes and intervention in the city’s mobility (e.g., the closure of a bus line). Figure 6 highlights the points where the accelerated network disassembling commences, i.e., the Urban Achilles Heel: up to those values the transport system exhibits a fair resilience, but surpassing such thresholds provokes a rapid network fall-out.
Independently on the specific results obtained for the Singapore’s transport network, we believe that our approach and our application can be used in several situations, both from a geographical and structural point of view.
Application deployment
Considering for instance the level of complexity and the structural organization of Singapore [7], one of the most developed cities in the eastern hemisphere, our model simulation showcases a relatively sound resilience to potential catastrophic events. While this is an interesting result in itself, another valuable aspect of our application is its ease of reproducibility in urban contexts characterized by more fragile infrastructural systems. In cities and urban areas with newer or less developed transport systems the application of the proposed methodology might in fact yield higher impact results.
From from a data availability standpoint our application can easily be deployed to other contexts. Out of the four major sources of information presented in section III, namely a) Transport Data, b) Administrative Boundaries, c) Mobility Flows and d) Flooding Data only the very last one is specifically tied to the Singapore’s context and the use-case introduced. Other data sources, such as Administrative Boundaries can in fact be commonly found either through local authorities official data portals, or via open data alternatives such as OpenStreetMap999https://www.openstreetmap.org/. The pivotal source, i.e. Transport Data, can additionally be found across different urban settings also through open data standards such as the General Transit Feed Specification (GTFS), which ”…allows public transportation agencies to provide real-time updates about their fleet to application developers”. GTFS is de facto the standard for exposing and consuming public transit data; can be globally found and integrated through ad hoc search engines such as TransitLand101010https://transit.land/; and come with a robust track-record of academic research and industry applications. [29, 16, 28].
Lastly, in a final effort to extend the scalability of our application to different contexts and use-cases, we devise possible implications of our tool by distinguishing different typologies of users, namely urban planners and policy makers, and humanitarian agencies.
Urban planners and policy-makers
Current approaches in transport network resilience focus on developing comprehensive frameworks or policies that largely prioritize efficiency and reducing delays, rather than considering the impact of stressful events on the network [17]. While these approaches are perfectly understandable from a policy’s stand-point, they might often leave real-world transport systems vulnerable to changing conditions. These conditions might also be exacerbated in complex urban environments such as Singapore. Thus, the insights provided by testing such scenario might prove extremely useful instead in preventing catastrophic events and improving the overall resilience of the system.
Humanitarian Organizations
The possibility to prototype scenarios and test the mutable conditions of a system has direct implications for other cities; other kinds of disruptive events; and other sectors, such as the humanitarian response. The latter is in fact an area of application where the ability to prevent damaging phenomena by containing negative impacts and providing an adequate rapid response is absolutely crucial [34]. By providing a clean interface and a tool able to scale over a wide portfolio of settings, our application is suited to address challenges where timing is the key factor, such as pre-event preparedness prevention or post-event rescue team deployment.
VIII Conclusion
Transport planning is a difficult arena to operate in. This is due to the inherently ”wicked nature” of the issues at stake coupled with the complexity of urban environments [9, 36]. Advancements in understanding human mobility have recently been made through the use of computational methodologies (see for instance [11, 33, 4, 1]). However, the need to operationalize and distill such methods into actionable tools tailored to real-world problems is still present. In particular, the humanitarian sector might benefit from the application of models and methods coming from the new science of data. Our proposed Achilles application is a step forward in this direction, providing an easy-to-use interface on top of complex models that allow non-expert users, such as non-profit organizations, to rapidly prototype different stress scenarios. It represents thus a tentative example of how data science can be put to good use to tackle issues of social relevance. In the presented experiments we tested the case of Singapore, particularly suited due to its natural geography and the frequent disruption thereby caused on the bus transport network system by floods. Since the application is built deploying data that are not site-specific (e.g. O-D matrices), it is scalable to different environments, making it suitable to be applied even in fragile contexts. Further, due to its flexible architecture Achilles accommodates new data sources with ease, adapting its modelling capacity to meet local needs. As unpredictable stress events might present themselves in the future, transport planners need to be vary of mutable conditions. This requires not only a close monitoring of transport networks under normal operational settings, but the ability to quickly respond to new challenges [22]. The solution we advance lies precisely in this direction.
References
- [1] Mohammed N Ahmed, Gianni Barlacchi, Stefano Braghin, Francesco Calabrese, Michele Ferretti, Vincent Lonij, Rahul Nair, Rana Novack, Jurij Paraszczak, and Andeep S Toor. A multi-scale approach to data-driven mass migration analysis. In SoGood@ ECML-PKDD, 2016.
- [2] Jacopo A. Baggio, Shauna B. BurnSilver, Alex Arenas, James S. Magdanz, Gary P. Kofinas, and Manlio De Domenico. Multiplex social ecological network analysis reveals how social changes affect community robustness more than resource depletion. Proceedings of the National Academy of Sciences, 113(48):13708–13713, 2016.
- [3] Hugo Barbosa-Filho, Marc Barthelemy, Gourab Ghoshal, Charlotte R. James, Maxime Lenormand, Thomas Louail, Ronaldo Menezes, José J. Ramasco, Filippo Simini, and Marcello Tomasini. Human Mobility: Models and Applications. Physics Reports, 2018.
- [4] Gianni Barlacchi, Marco De Nadai, Roberto Larcher, Antonio Casella, Cristiana Chitic, Giovanni Torrisi, Fabrizio Antonelli, Alessandro Vespignani, Alex Pentland, and Bruno Lepri. A multi-source dataset of urban life in the city of milan and the province of trentino. Scientific data, 2:150055, 2015.
- [5] Gianni Barlacchi, Christos Perentis, Abhinav Mehrotra, Mirco Musolesi, and Bruno Lepri. Are you getting sick? predicting influenza-like symptoms using human mobility behaviors. EPJ Data Science, 6(1):27, Oct 2017.
- [6] Gianni Barlacchi, Alberto Rossi, Bruno Lepri, and Alessandro Moschitti. Structural semantic models for automatic analysis of urban areas. In Joint European Conference on Machine Learning and Knowledge Discovery in Databases, pages 279–291. Springer, 2017.
- [7] Paul Barter and Edward Dotson. Urban transport institutions and governance and integrated land use and transport, singapore. Case Study Prepared for Global Report on Human Settlements, 2013.
- [8] Marc Barthelemy. The structure and dynamics of cities. Cambridge University Press, 2016.
- [9] Michael Batty. The size, scale, and shape of cities. Science, 319(5864):769–771, 2008.
- [10] M. Berlingerio, M. Coscia, F. Giannotti, A. Monreale, and D. Pedreschi. Foundations of multidimensional network analysis. In 2011 International Conference on Advances in Social Networks Analysis and Mining, pages 485–489, July 2011.
- [11] Serdar Çolak, Antonio Lima, and Marta C González. Understanding congested travel in urban areas. Nature Communications, 7:10793, 2016.
- [12] Manlio De Domenico, Antonio Lima, Marta C González, and Alex Arenas. Personalized routing for multitudes in smart cities. EPJ Data Science, 4(1):1, 2015.
- [13] Manlio De Domenico, Albert Solé-Ribalta, Emanuele Cozzo, Mikko Kivelä, Yamir Moreno, Mason A. Porter, Sergio Gómez, and Alex Arenas. Mathematical formulation of multilayer networks. Phys. Rev. X, 3:041022, Dec 2013.
- [14] Manlio De Domenico, Albert Solé-Ribalta, Sergio G mez, and Alex Arenas. Navigability of interconnected networks under random failures. Proceedings of the National Academy of Sciences, 111(23):8351–8356, 2014.
- [15] Marco De Nadai, Jacopo Staiano, Roberto Larcher, Nicu Sebe, Daniele Quercia, and Bruno Lepri. The death and life of great italian cities: A mobile phone data perspective. In Proceedings of the 25th International Conference on World Wide Web, WWW ’16, pages 413–423, Republic and Canton of Geneva, Switzerland, 2016. International World Wide Web Conferences Steering Committee.
- [16] Brian Ferris, Kari Watkins, and Alan Borning. Location-aware tools for improving public transit usability. IEEE Pervasive Computing, (1):13–19, 2009.
- [17] Alexander A. Ganin, Maksim Kitsak, Dayton Marchese, Jeffrey M. Keisler, Thomas Seager, and Igor Linkov. Resilience and efficiency in transportation networks. Science Advances, 3(12):1–9, 2017.
- [18] Fosca Giannotti, Mirco Nanni, Dino Pedreschi, Fabio Pinelli, Chiara Renso, Salvatore Rinzivillo, and Roberto Trasarti. Unveiling the complexity of human mobility by querying and mining massive trajectory data. The VLDB Journal, 20(5):695–719, October 2011.
- [19] Marta C Gonzalez, Cesar A Hidalgo, and Albert-Laszlo Barabasi. Understanding individual human mobility patterns. nature, 453(7196):779, 2008.
- [20] M.S. Granovetter. The Strength of Weak Ties. The American Journal of Sociology, 78(6):1360–1380, 1973.
- [21] Torsten Hägerstrand. What about people in regional science? Papers of the Regional Science Association, 24(1):6–21, Dec 1970.
- [22] W. H. Ip and Dingwei Wang. Resilience evaluation approach of transportation networks. Proceedings of the 2009 International Joint Conference on Computational Sciences and Optimization, CSO 2009, 2:618–622, 2009.
- [23] AK Jain, MN Murty, and PJ Flynn. Estimating origin-destination flows using mobile phone location data. ACM Computing Surveys, 31(3):264–323, 1999.
- [24] S. Jiang, J. Ferreira, and M. C. González. Activity-based human mobility patterns inferred from mobile phone data: A case study of singapore. IEEE Transactions on Big Data, 3(2):208–219, June 2017.
- [25] Shan Jiang, Yingxiang Yang, Siddharth Gupta, Daniele Veneziano, Shounak Athavale, and Marta C. González. The timegeo modeling framework for urban mobility without travel surveys. Proceedings of the National Academy of Sciences, 113(37):E5370–E5378, 2016.
- [26] Matthew James Kelley. The semantic production of space: Pervasive computing and the urban landscape. Environment and Planning A, 46(4):837–851, 2014.
- [27] Rob Kitchin and Martin Dodge. Code/space: Software and everyday life. Mit Press, 2011.
- [28] Xiaoyue Cathy Liu, Guohui Zhang, et al. An efficient general transit feed specification (gtfs) enabled algorithm for dynamic transit accessibility analysis. PloS one, 12(10):e0185333, 2017.
- [29] Tianyi Ma, Gianmario Motta, and Kaixu Liu. Delivering real-time information services on public transit: A framework. IEEE Transactions on Intelligent Transportation Systems, 18(10):2642–2656, 2017.
- [30] Luca Pappalardo, Salvatore Rinzivillo, and Filippo Simini. Human mobility modelling: Exploration and preferential return meet the gravity model. Procedia Computer Science, 83:934 – 939, 2016. The 7th International Conference on Ambient Systems, Networks and Technologies (ANT 2016) / The 6th International Conference on Sustainable Energy Information Technology (SEIT-2016) / Affiliated Workshops.
- [31] Luca Pappalardo, Giulio Rossetti, and Dino Pedreschi. How well do we know each other? detecting tie strength in multidimensional social networks. In 2012 IEEE/ACM International Conference on Advances in Social Networks Analysis and Mining, pages 1040–1045, Aug 2012.
- [32] Luca Pappalardo and Filippo Simini. Data-driven generation of spatio-temporal routines in human mobility. Data Mining and Knowledge Discovery, 32(3):787–829, May 2018.
- [33] Luca Pappalardo, Filippo Simini, Salvatore Rinzivillo, Dino Pedreschi, Fosca Giannotti, and Albert-László Barabási. Returners and explorers dichotomy in human mobility. Nature Communications, 6, 09 2015.
- [34] K. T. Pham, P. Sattigeri, A. Dhurandhar, A. C. Jacob, M. Vukovic, P. Chataigner, J. Freire, A. Mojsilović, and K. R. Varshney. Real-time understanding of humanitarian crises via targeted information retrieval. IBM Journal of Research and Development, 61(6):7:1–7:12, Nov 2017.
- [35] Aura Reggiani, Thomas De Graaff, and Peter Nijkamp. Resilience: an evolutionary approach to spatial economic systems. Networks and Spatial Economics, 2(2):211–229, 2002.
- [36] Horst W J Rittel and Melvin M. Webber. Dilemmas in a general theory of planning. Policy Sciences, 4(2):155–169, 1973.
- [37] Alberto Rossi, Gianni Barlacchi, Monica Bianchini, and Bruno Lepri. Modeling taxi drivers’ behaviour for the next destination prediction. arXiv preprint arXiv:1807.08173, 2018.
- [38] Matthias C Scheffel, Claus G Gruber, Thomas Schwabe, and Robert G Prinz. Optimal multi-topology routing for ip resilience. AEU-International Journal of Electronics and Communications, 60(1):35–39, 2006.
- [39] Filippo Simini, Marta C. Gonzalez, Amos Maritan, and Albert-Laszlo Barabasi. A universal model for mobility and migration patterns. Nature, 484(7392):96–100, 4 2012.
- [40] United Nations. World Urbanization Prospects: The 2014 Revision. Technical report, Department of Economic and Social Affairs Population Division, New York, NY, USA, 2014.
- [41] Yanyan Xu and Marta C. González. Collective benefits in traffic during mega events via the use of information technologies. Journal of The Royal Society Interface, 14(129), 2017.
- [42] George Kingsley Zipf. The p 1 p 2/d hypothesis: on the intercity movement of persons. American sociological review, 11(6):677–686, 1946.