Time dependent fracture under unloading in a fiber bundle model
Abstract
We investigate the fracture of heterogeneous materials occurring under unloading from an initial load. Based on a fiber bundle model of time dependent fracture, we show that depending on the unloading rate the system has two phases: for rapid unloading the system suffers only partial failure and it has an infinite lifetime, while at slow unloading macroscopic failure occurs in a finite time. The transition between the two phases proved to be analogous to continuous phase transitions. Computer simulations revealed that during unloading the fracture proceeds in bursts of local breakings triggered by slowly accumulating damage. In both phases the time evolution starts with a relaxation of the bursting activity characterized by a universal power law decay of the burst rate. In the phase of finite lifetime the initial slowdown is followed by an acceleration towards macroscopic failure where the increasing rate of bursts obeys the (inverse) Omori law of earthquakes. We pointed out a strong correlation between the time where the event rate reaches a minimum value and of the lifetime of the system which allows for forecasting of the imminent catastrophic failure.
I Introduction
In applications, materials are often subject to constant or slowly varying external loads which fall below their fracture strength. Such sub-critical loads usually give rise to time dependent deformation and failure in a finite time Herrmann and Roux (1990); Busse et al. (2006); Alava et al. (2006). Creep rupture (constant load) and fatigue failure (varying load) set serious limitations on the applicability of materials in construction components, and they are often responsible e.g. for the instability of steep slopes in mountains leading to the emergence of natural catastrophes such as landslides and collapse of rock walls de Blasio (2011). Sub-critical fracture of heterogeneous materials proceeds in bursts of local rupture events, which can be registered in the form of acoustic signals. Acoustic emission measurements provide a valuable insight into the dynamics of fracture processes addressing also the possibility of forecasting the imminent final collapse Guarino et al. (1998); Nataf et al. (2014).
Failure of materials can also occur due to unloading from a previously applied stress level. Excavation during underground engineering rapidly releases stress which can result in rock bursts Wang et al. (2015). Similar conditions may also occur on much larger length and time scales at the emergence of earthquakes: crustal unloading due to near-surface mass redistribution (water, ice or quarried material) can affect the subsurface stress field, altering seismic activity and being also responsible for rupture activation and induced earthquakes González et al. (2012). Fracture processes under unloading present a high degree of complexity, which makes it difficult to achieve a general understanding.
To consider this problem, in the present paper we investigate the process of sub-critical fracture, which occurs when unloading from an initial load. We use a fiber bundle model of time dependent deformation and rupture, which captures the slow damaging of loaded fibers and their immediate breaking when the local load exceeds the fibers’ fracture strength. In the model, we focus on the case when a constant sub-critical load gives rise to failure in a finite time so that unloading may prevent the final breakdown. We show by analytical calculations and computer simulations that the system has two phases, i.e. at rapid unloading only partial failure occurs and the sample has an infinite lifetime. However, slow unloading results in global failure in a finite time. We demonstrate that the transition between the phases of finite and infinite lifetime occurs at a well-defined unloading rate, and it is analogous to continuous phase transitions. The unloading process is accompanied by breaking bursts of fibers with a varying rate. We show by computer simulations that in the regime of finite lifetime the initial relaxation is followed by a short acceleration period towards failure. Based on the pattern of the time varying burst rate we propose a method to forecast the impending failure under unloading.
II Fiber bundle model of time dependent fracture
To investigate the effect of unloading on the process of sub-critical fracture we use a fiber bundle model (FBM), which has been introduced recently for the time dependent fracture of heterogeneous materials Kun et al. (2009, 2008); Halász et al. (2012). In the model, the sample is represented by a parallel set of fibers which can only be loaded along the fibers’ direction. The fibers have linearly elastic behavior with a constant Young modulus . Subjecting the bundle to a constant load below the fracture strength of the system, the fibers break due to two physical mechanisms: immediate breaking occurs when the local load on fibers exceeds their fracture strength , , where is the number of fibers. Under a sub-critical load this breaking mechanism would lead to a partially failed configuration with an infinite lifetime. Time dependence arises such that those fibers, which remained intact under a given load, undergo an aging process accumulating damage . We assume that the rate of damaging has a power law dependence on the local load ()
| (1) |
where is a constant and the exponent controls the characteristic time scale of the aging process with . The total amount of damage accumulated up to time can be obtained by integrating over the entire loading history of fibers . Fibers can sustain only a finite amount of damage so that when exceeds the local damage threshold , the fiber breaks.
After each breaking event, the load of the failed fiber gets redistributed over the remaining intact ones. In the present study we focus on the case of equal load sharing (ELS), i.e. when a fiber breaks its load is equally shared by all remaining fibers. ELS has the consequence that no stress fluctuations can emerge in the system, since all the fibers keep the same load. Heterogeneity of the material is entirely represented by the randomness of the failure thresholds of fibers , of the two breaking modes. For simplicity, both thresholds were sampled from a uniform distribution between zero and one , and without any correlation.
It has been demonstrated that even in the simplest case of a constant sub-critical load a highly complex fracture process emerges: when the load is set weak fibers break immediately Kun et al. (2007, 2008). The load of broken fibers gets redistributed over the intact ones, which may induce further breaking events followed again by load redistribution. As the consequence of successive breaking and redistribution steps, an avalanche is triggered which stops when all the remaining intact fibers are strong enough to keep the external load. The time evolution of the bundle starts from this partially fractured initial state. Loaded fibers accumulate damage and break slowly, one-by-one due to damaging. Since damage breakings are also followed by load redistribution, they gradually increase the load on intact fibers, and in turn, can trigger sudden bursts of immediate breaking Kun et al. (2007, 2008). Eventually, the time evolution of the fracture process sets in as a series of sudden bursts, analogous to acoustic outbreaks in real experiments, separated by quite periods of slow damaging. In the model, loaded fibers always accumulate damage, and eventually break, hence, at any finite load which is kept constant, the system has a finite lifetime . It has been shown in Refs. Kun et al. (2007, 2009) that in the sub-critical regime the lifetime of the bundle decreases as a power law of , while super-critical loads give rise to immediate global failure.
The model has been successfully applied to describe the time evolution of damage induced creep rupture under a constant load Kun et al. (2007, 2009); Danku and Kun (2013a), the statistics of crackling bursts Kun et al. (2008); Halász et al. (2012); Danku and Kun (2014), the average temporal profile Danku and Kun (2013b), and the fractal geometry of bursts Danku et al. (2015) emerging during the fracture process.
III Time evolution of damage
In order to investigate the fracture process of the bundle under unloading, we assume that the externally applied load decreases with time according to a linear profile
| (2) |
where denotes the initial sub-critical load and the parameter is the rate of unloading. For simplicity, we start the analysis with the case when damage accumulation is the only breaking mechanism of fibers so that no avalanches of immediate breaking can be triggered. It has the advantage that the most important characteristics of the time evolution of the bundle can be deduced analytically.
During the time evolution of the system the degree of degradation of the bundle can be quantified by the fraction of broken fibers , where denotes the total number of fibers broken up to time . The rate of breaking can be obtained from the damage law Eq. (1) as
| (3) |
where denotes the probability density function of damage thresholds. Since equal load sharing is assumed, the load of single fibers at time reads as
| (4) |
where the nominator and the denominator take into account the decreasing externally applied stress, and the reduction of the load bearing cross section of the bundle, respectively. The above expressions demonstrate that the time evolution of the bundle is controlled by two competing mechanisms, namely, the decreasing external load favors the slowdown of fracturing, however, fiber breaking gives rise to the increase of the load on single fibers, which accelerates the failure process. The competition is controlled by the rate of unloading .
For uniformly distributed damage thresholds, with the density function , the evolution equation Eq. (3) can be solved analytically
| (5) |
which fulfills the initial condition .
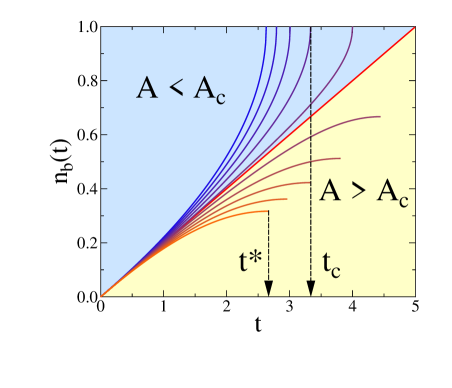
The curves are presented in Fig. 1 for the damage accumulation exponent at several values of the unloading rate , keeping the initial load fixed . Depending on the value of , two qualitatively different regimes of the time evolution can be identified in the figure: for slow unloading the fraction of broken fibers grows with an increasing rate and reaches one at a finite time , where global failure of the bundle occurs. The reason is that for low the fibers are loaded for a sufficiently long time to accumulate enough damage to break. This mechanism implies that for decreasing the lifetime of the bundle decreases, and in the limit of it tends to the lifetime of constant external load obtained in Refs. Kun et al. (2007, 2009). For rapid unloading the fibers can accumulate only a lower amount of damage, and hence, by the time
| (6) |
when the external load reaches zero, a finite fraction of fibers survives. Consequently, the curves approach their limit values with a decreasing rate. It has to be emphasized that in this regime the time evolution of the system terminates at , but the partially failed state attained eventually has an infinite lifetime.
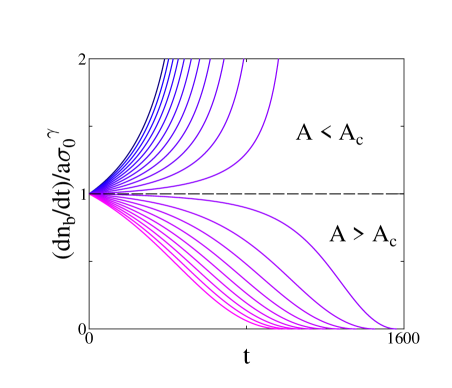
Substituting Eq. (5) into Eq. (3) the time dependent breaking rate can be cast into the final form
| (7) |
which is illustrated in Fig. 2 for several values of . It can be observed that the behavior of the breaking rate confirms the existence of two phases, i.e. for slow unloading the system accelerates towards global failure and has a finite lifetime , while for fast unloading partial failure is approached by slowdown and the system has an infinite lifetime. The transition between the two phases occurs at a well-defined critical unloading rate .
The lifetime of the bundle can be obtained as the time where the breaking rate Eq. (7) diverges
| (8) |
It can be seen that is only finite if the unloading rate falls below the characteristic value
| (9) |
which defines the critical point , separating the finite and infinite lifetime regimes of the system. The critical unloading rate depends on the initial load and on the exponent , which controls the load dependence of the aging process.
It is a very interesting question how the transition between the two phases occurs, when the control parameter is varied. Starting from Eq. (8), it can be simply shown that in the limiting case of the value of converges to , which is the lifetime of the bundle under the constant load Kun et al. (2009). For increasing unloading rate , as the critical point is approached from below, increases and converges to a finite maximum . The behavior of as a function of the unloading rate Eq. (8) is illustrated in Fig. 3. It follows from Eq. (8) that although remains finite at , its derivative exhibits a power law divergence as a function of the distance from the critical point
| (10) |
The critical exponent depends only on the damage accumulation exponent .

Above the critical point , the lifetime becomes infinite because the unloading is so fast that some fraction of fibers remains intact by the time , when the external load reaches zero.
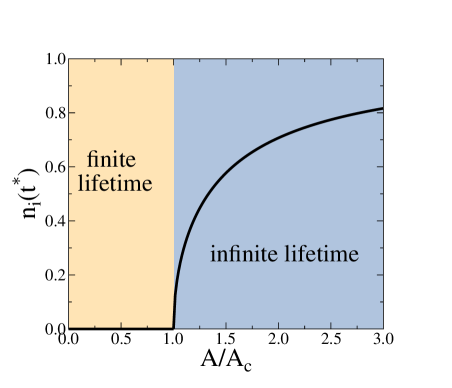
The final state of the time evolution can be characterized by the fraction of intact fibers at the end of the unloading process. In the regime of finite lifetime holds, which implies that for since the failure of the bundle has been completed. Above the critical point partial failure occurs giving rise to a finite fraction of surviving fibers . It follows from Eq. (5) that increases with the distance from according to a power law
| (11) |
where the value of the critical exponent is . The above quantitative analysis shows that the transition between the phases of finite and infinite lifetime occurs at analogous to a continuous phase transition Nishimori and Ortiz (2011). The fraction of intact fibers can be considered as the order parameter of the transition, which is illustrated in Fig. 4.
IV Breaking bursts triggered by damage sequences
When both breaking mechanisms, i.e. immediate breaking and slow damage accumulation, are turned on, the fracture process becomes even more complex: as fibers break due to damage the load on intact fibers gradually increases. Such load increments may be sufficient to induce immediate breaking of fibers, which in turn can generate a cascade of immediate breaking. Due to the interplay of slow damaging and immediate breaking of fibers, the fracture process is composed of sudden bursts (avalanches) of fiber breakings, which are triggered by slowly evolving damage sequences. The complexity of this fracture process can only be explored by means of computer simulations.
IV.1 Computer implementation
Global load sharing implies that both the load of single fibers and the damage accumulated up to time are the same for all the fibers. It has the consequence that for both breaking mechanisms fibers break in the increasing order of their respective breaking thresholds. Since the system has only quenched disorder, the computer implementation of the model starts with sorting the randomly generated breaking thresholds and () into increasing order.
During the fracture process, after each damage induced breaking it has to be checked whether the resulting load increment is sufficient to trigger immediate failure of fibers. If the bundle remained stable then the next fiber will break again due to damage accumulation. The time of the next damage breaking with the damage threshold can be obtained analytically from the integral of the damage law Eq. (1)
| (12) |
where is the threshold of the previous damage breaking which occurred at time . Here denotes the total number of broken fibers at time , which remains constant from the time to . After the damaging fiber has been removed from the bundle, its load gets redistributed increasing the load on intact fibers to
| (13) |
where . If the load increment induces immediate breakings, an avalanche may emerge through breaking and load redistribution steps, which stops when all remaining fibers are strong enough to keep the enhanced load. The size of an avalanche is defined as the total number of fibers breaking in the failure cascade triggered by the preceding damage event. It is important that the avalanche propagation is considered to be much faster than damage accumulation that’s why no time is associated to the avalanche duration. The separation of time scales of damaging and bursting has the consequence that the fracture of the bundle proceeds as a series of bursts of immediate breakings triggered by damage sequences. In the simulations the temporal evolution of the system is followed until either all fibers break , or the external load decreases to zero . This technique made us possible to perform computer simulations of the system varying the number of fibers up to fibers.
IV.2 Finite size scaling
To explore the complexity of the breaking process, simulations were carried out varying the parameters of the model in broad ranges. The analytic results of the damage limit of the model in Section III were obtained for an infinitely large system. Simulations at finite system sizes revealed that breaking avalanches do not alter the global qualitative behavior of the system, only quantitative details of the fracture process change.
Since in avalanches a large number of fibers can break simultaneously, avalanche triggering gives rise to an acceleration of the fracture process: at the same value of the control parameter the lifetime of the bundle becomes shorter, while the critical point shifts to a higher value compared to the analytic results of Eqs. (8,9). Higher critical point means that even for faster unloading global failure can occur due to the presence of avalanches. In the following the critical point of the system in the presence of avalanches will be denoted by to distinguish it from the corresponding value of the purely damage driven case .
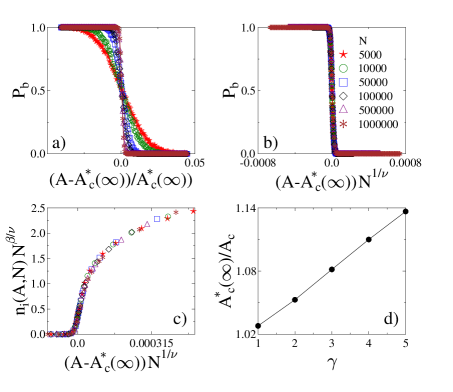
In order to understand how the value of depends on the system size, we determined the probability of global failure as a function of varying the number of fibers in a broad range. For each system size the value of was obtained as the fraction of samples which suffered global failure repeating the simulations times with different realizations of disorder. Figure 5 shows that for small failure can occur with a considerable probability in a broad range of the control parameter . As the system size increases the transition becomes sharper and a well-defined critical point emerges. Figure 5 presents the same data rescaled with the system size using the finite size scaling form of continuous phase transition
| (14) |
Here denotes the critical point of the infinite system in the presence of avalanche triggering, while the exponent is the correlation length exponent of the transition. In the figure best collapse is achieved with .
The order parameter of the transition , i.e. the fraction of intact fibers at the end of unloading, has a similar dependence on the system size . Figure 5 demonstrates that rescaling the data of with the number of fibers according to the scaling form
| (15) |
curves of different system sizes can be collapsed on a master curve. Good quality data collapse is obtained using the same value of the correlation length exponent as for the failure probability . For the ratio of the order parameter and correlation length exponents the value was obtained, which gives consistent with the analytic value of the damage driven case for used in Fig. 5.
Based on the above finite size scaling analysis we determined the asymptotic value of the critical unloading rate for several values of the exponent of the damage accumulation law. In Figure 5 the ratio of and the analytic value of is presented as a function . It can be observed that the critical point is always higher when avalanches are triggered and the difference from the damage driven case increases with .
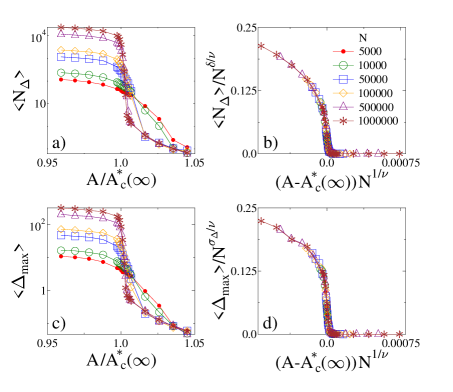
To quantify the role of breaking avalanches in the fracture process, we calculated the average total number of avalanches and the average size of the largest avalanche as a function of covering both phases. Figures 6 and show that both quantities are decreasing functions of the unloading rate , i.e. avalanches of largest number and size are triggered when the external load is kept constant , however, unloading at any rate reduces the avalanche activity. Similar to the behavior of and , these quantities also show the sharpening of the transition between the phases of finite and infinite lifetime with increasing . Rescaling the data with the number of fibers according to the finite size scaling form Eq. (15), the curves of different system sizes can be collapsed on the top of each other. The exponents and , controlling the cutoff size and number of avalanches as the critical point is approached from below, are defined as
| (16) | |||||
| (17) |
Using the same value of as before, and tuning the new exponents to achieve best collapse, we obtained the values and . Simulations revealed that the correlation length exponent , and the exponents describing the avalanche activity and , are universal, they do not depend on the parameters of the model. These exponents are controlled by the range of load redistribution, which is fixed here by the equal load sharing rule Hansen et al. (2015); Hidalgo et al. (2009); Kun et al. (2008). This is also the reason why the size distribution of bursts exhibits the usual power law behavior with the universal exponent (not shown in figures). Since the exponents and control the cutoff and the integral of the burst size distribution, respectively, they satisfy the scaling relation Danku and Kun (2016). Substituting the above numerical values, our exponents approximately fullfill the relation.
V Rate of breaking bursts
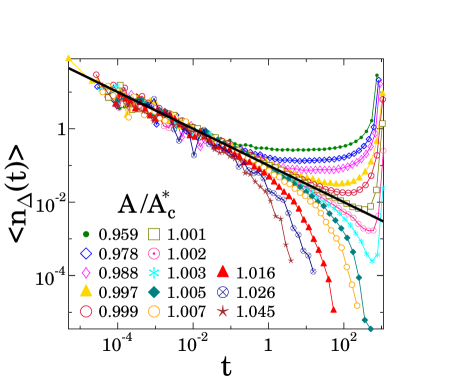
In order to characterize how the bursting activity evolves at a given value of the unloading rate , we determined the average rate of bursts as a function of time. Figure 7 presents the event rate for a system of fibers at several values of below and above the critical point . It is interesting to note that in both phases the unloading process is initially accompanied by a decreasing rate of bursts. A power law functional form is evidenced
| (18) |
where the value of the exponent proved to be independent of the initial load , of the unloading rate , and of the damage accumulation exponent . In the phase of partial failure the power law decay of the burst rate is followed by a rapid exponential decrease, while in the phase finite lifetime reaches a minimum at a time which is then followed by an acceleration towards failure.
The curves of Figure 7 were obtained by logarithmically binning the time starting from the beginning of the process, which implies finer bins at early times and coarser ones close to failure. To improve the resolution of the analysis in the close vicinity of failure, we re-binned the data of the phase of finite lifetime in terms of the time measured from the critical point , using again logarithmic binning. This way we can zoom on the acceleration regime of the time evolution, however, the minimum of the event rate and the entire relaxation phase, dominating in Fig. 7, fall in the last few bins.
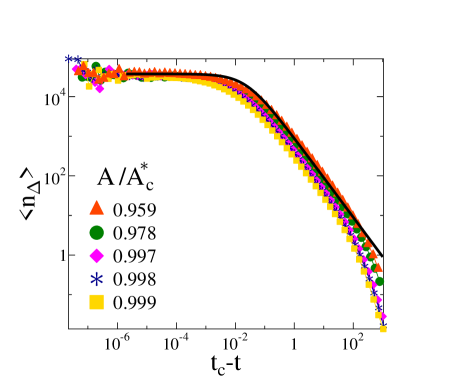
It can be observed in Fig. 8 that as the event rate increases when failure is approached, it gets saturated close to . The functional form of the curves can be well approximated by the Omori law of earthquakes
| (19) |
where denotes the saturation rate, is the characteristic time distance from where saturation sets in, and is the exponent, which controls the power law decay beyond . Simulations performed varying the parameters , , and in broad ranges revealed that the exponent exhibits a high degree of universality, i.e. best fit of the data is provided by the Omori exponent in all cases. It is interesting to note that for earthquakes the Omori law describes the relaxation of the system following major shocks, while in our case it provides a good quality quantitative description of the acceleration of the system towards macroscopic failure. The value of our Omori exponent falls close to the typical value of earthquakes Ojala et al. (2004).
VI Forecasting global failure
It is a crucial question whether the imminent global failure of the bundle can be forecasted. In order to foresee failure, signatures have to be identified early enough, which allow for a quantitative prediction of the time of final collapse . Breaking events induced by slow damage accumulation can hardly be monitored in reality Lockner (1993); Lennartz-Sassinek et al. (2013), however, avalanches of fiber breakings are sudden outbreaks which generate acoustic waves Meinders and Vliet (2008); Rosti et al. (2010); Jiang et al. (2017). Based on acoustic emission measurements the fracture process can be decomposed as a time series of discrete fracturing events, which correspond to the breaking avalanches of our model Baró et al. (2013); Castillo-Villa et al. (2013).
We have seen above that in the phase of finite lifetime global failure is preceded by a short acceleration period, which sets on after the time of minimum event rate has been passed. The inset of Fig. 9 demonstrates that the value of can be measured with a good confidence even in a single system without averaging. It follows that in case a correlation exists between the lifetime and the time of minimum event rate , the value of could be used to predict the failure time .
We performed computer simulations at a fixed system size of fibers and determined the two characteristic times and for a large number of individual systems at several unloading rates .
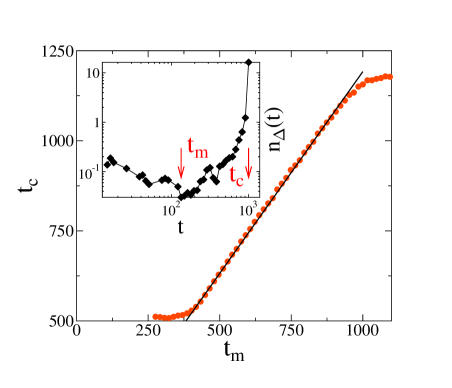
To quantify the correlation of the two time scales we binned irrespective of the corresponding unloading rate , and calculated the average failure time for each bin. In Fig. 9 the average failure time is plotted as a function of the average minimum time. The correlation of the two quantities can be very well described by a linear functional form
| (20) |
where the multiplication factor was obtained by fitting . The result implies that when the event rate has passed its minimum then the failure time can be estimated according to the relation Eq. (20). The value of falling close to 1 shows that the time evolution of the system is strongly asymmetric, the acceleration period is only about 10 percent of the duration of the slowdown. This short acceleration period may still be sufficient to mitigate consequences of the final collapse of the system.
To quantify the reliability of the forecasting method, we determined the probability distribution of the relative error of the lifetime estimates defined as
| (21) |
Here is the measured lifetime of a single sample and was substituted to make an estimate based on the corresponding . The inset of Fig. 10 presents the distribution for several values of the control parameter where each curve was obtained using 1000 samples. It can be observed that is asymmetric and for values far from the critical point even the most probable error is negative. The result implies that in this parameter range the method underestimates the lifetime of samples with a relatively broad scatter. However, approaching the critical unloading rate the distributions get narrower and shift towards positive values, which indicate the improvement of forecasting. We also determined the average of the absolute value of the relative error as a function of . Figure 10 shows that
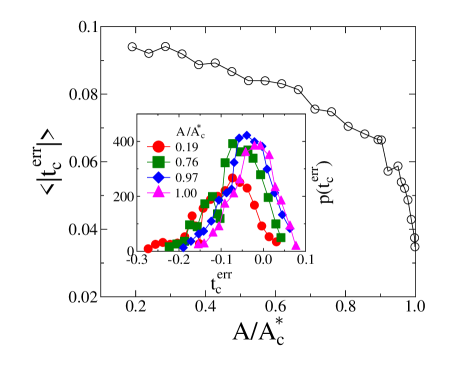
far from the critical unloading rate the relative error is above 10%. Since the acceleration period has a comparable duration relative to the lifetime of the sample, the reliability of forecasting is low in this parameter range. However, in the vicinity of the critical point the quality of estimates rapidly improves, since the relative error drops down to a few procent.
Similar forecasting methods have been suggested for creep rupture processes under a constant external load Monkman and Grant (1956); Sornette (2002); Kovács et al. (2008); Koivisto et al. (2016), but these alternatives mainly focus on specific features of the evolution of the deformation rate as a function of time . The Monkman-Grant (MG) relation of materials expresses the sample creep life as a power law of the minimum strain rate Monkman and Grant (1956). Although the MG relation was determined on an empirical ground, for some cases it has been derived analytically from models of damage enhanced creep such as the visco-elastic fiber bundle model Kovács et al. (2008). A linear relation between the lifetime of creeping samples and the time of minimum strain rate was pointed out, similar to Eq. (20) for fiber composites. Careful experiments revealed a universality of the multiplication factor significantly larger than our one Nechad et al. (2005a, b). Recently, a similar relation was suggested to describe the lifetime of loaded paper sheets where the creep process proved to be more anisotropic with Koivisto et al. (2016).
VII Discussion
Based on a model of damage enhanced creep rupture we investigated the time evolution of the rupture process emerging under unloading from an initial load. When fiber breaking is only induced by aging, the time evolution of the system can be explored by analytical calculations. We showed analytically that the system has two phases: for slow unloading global failure occurs in a finite time, while rapid unloading gives rise to partial failure and an infinite lifetime of the bundle. The transition between the two phases occurs at a critical unloading rate analogous to continuous phase transitions. The critical unloading rate depends on the parameters of the damage law of the model such that at higher initial loads a faster unloading is required to prevent failure. The phase structure of the system can be characterized by the fraction of intact fibers when unloading is completed playing the role of the order parameter of the system. This quantity is identically zero in the phase of finite lifetime, while it takes a finite non-zero value when partial failure occurs. Approaching the transition from the phase of partial failure, the order parameter goes to zero according to a power law of the distance from the critical point. Analytical calculations revealed that the order parameter exponent of the transition is not universal in the sense that it depends on the exponent of the damage law of the model.
When both breaking mechanisms are active, a highly complex fracture process emerges, where slowly proceeding damage sequences trigger bursts of immediate breakings. Computer simulations revealed that avalanche triggering does not change the overall character of the system, however, the rupture process gets faster and the critical unloading rate shifts to a higher value. Based on finite size scaling of the simulation results, we determined the asymptotic critical point of the system in the limit of infinite bundle size. The beginning of the unloading process is accompanied by a relaxation of the bursting activity quantified by a power law decrease of the event rate. In the phase of finite lifetime, macroscopic failure is preceded by a short acceleration period described by the (inverse) Omori law. The Omori exponent of our fracture process has the same value as the one of earthquakes. The critical exponents characterizing the bursting activity of the rupture process proved to be universal, they are only affected by the range of load sharing between fibers.
We pointed out a simple linear relation between the time where the burst rate reaches its minimum and the lifetime of the sample, which can be exploited to forecast the imminent catastrophic failure of the system. Simulations showed that the forecasting method has a good reliability in the vicinity of the critical unloading rate. In laboratory or field measurements using the evolution of the time series of acoustic outbreaks as information source suggested by our results, may be advantageous compared to monitoring the strain rate used by other methods of forecasting.
It is an important characteristics of our model that the external load is always below the fracture strength of the system, and hence, failure is driven by the slow aging of loaded fibers even when both breaking mechanisms are active. It follows that at any constant external load the bundle would have a finite lifetime. Unloading from an initial load gives rise to a competition of two mechanisms: the decreasing external load results in slowdown of the time evolution, while fiber breaking reduces the load bearing capacity which accelerates the fracture process. The competition is controlled by the unloading rate in such a way that sufficiently fast unloading can prevent global failure. Such loading situations may arise in geological systems, when e.g. the direction of the motion of tectonic plates gets reversed giving rise to slow unloading of plate boundaries.
Although, our study only considered the case of a linearly decreasing external load, the application of the model to more complex time dependences, including also cyclic loading, is straightforward. As the simplest extension of our calculations, it is worth analysing how the system evolves when the external load linearly increases. In this case, the bundle always fails globally, however, as the loading rate increases the slow damage mechanism plays a diminishing role, and eventually the fracture process is entirely controlled by the immediate breaking of fibers. Cyclic loading is composed of loading and unloading periods, where an interesting competion of damage and immediate breaking can be expected. Work on this is in progress.
Acknowledgements.
The project is co-financed by the European Union and the European Social Fund. The work is supported by the EFOP-3.6.1-16-2016-00022 project. This research was supported by the National Research, Development and Innovation Fund of Hungary, financed under the K-16 funding scheme Project no. K 119967. R.K. was supported by the ÚNKP-17-2 New National Excellence Program of the Ministry of Human Capacities”. The research was financed by the Higher Education Institutional Excellence Programme of the Ministry of Human Capacities in Hungary, within the framework of the Energetics thematic programme of the University of Debrecen.References
- Herrmann and Roux (1990) H. J. Herrmann and S. Roux, eds., Statistical models for the fracture of disordered media, Random materials and processes (Elsevier, Amsterdam, 1990).
- Busse et al. (2006) G. Busse, B. Kröplin, and F. K. Wittel, eds., Damage and its evolution in fiber-composite materials (ISD Verlag, 2006).
- Alava et al. (2006) M. Alava, P. K. Nukala, and S. Zapperi, Adv. Phys. 55, 349–476 (2006).
- de Blasio (2011) F. V. de Blasio, Introduction to the Physics of Landslides (Springer Verlag, Heidelberg, 2011).
- Guarino et al. (1998) A. Guarino, A. Garcimartin, and S. Ciliberto, Eur. Phys. J. B 6, 13 (1998).
- Nataf et al. (2014) G. F. Nataf, P. O. Castillo-Villa, J. Baró, X. Illa, E. Vives, A. Planes, and E. K. H. Salje, Physical Review E 90, 022405 (2014).
- Wang et al. (2015) M. Wang, Z. Zhu, and J. Xie, Adv. Mat. Sci. Eng. (2015).
- González et al. (2012) P. J. González, K. F. Tiampo, M. Palano, F. Cannavó, and J. Fernández, Nature Geoscience 5, 821 (2012).
- Kun et al. (2009) F. Kun, Z. Halász, J. S. Andrade, and H. J. Herrmann, J. Stat. Mech. 2009, P01021 (2009).
- Kun et al. (2008) F. Kun, H. A. Carmona, J. S. Andrade Jr., and H. J. Herrmann, Phys. Rev. Lett. 100, 094301 (2008).
- Halász et al. (2012) Z. Halász, Z. Danku, and F. Kun, Phys. Rev. E 85, 016116 (2012).
- Kun et al. (2007) F. Kun, M. H. Costa, R. N. C. Filho, J. S. A. Jr, J. B. Soares, and H. J. Herrmann, J. Stat. Mech. 2007, P02003 (2007).
- Danku and Kun (2013a) Z. Danku and F. Kun, Sci. Rep. 3, 2688 (2013a).
- Danku and Kun (2014) Z. Danku and F. Kun, Front. Phys. 2 (2014).
- Danku and Kun (2013b) Z. Danku and F. Kun, Phys. Rev. Lett. 111, 084302 (2013b).
- Danku et al. (2015) Z. Danku, F. Kun, and H. J. Herrmann, Phys. Rev. E 92, 062402 (2015).
- Nishimori and Ortiz (2011) H. Nishimori and G. Ortiz, Elements of Phase Transitions and Critical Phenomena, 1st ed. (Oxford University Press, Oxford, 2011).
- Hansen et al. (2015) A. Hansen, P. Hemmer, and S. Pradhan, The Fiber Bundle Model: Modeling Failure in Materials, Statistical Physics of Fracture and Breakdown (Wiley, 2015).
- Hidalgo et al. (2009) R. C. Hidalgo, F. Kun, K. Kovács, and I. Pagonabarraga, Phys. Rev. E 80, 051108 (2009).
- Danku and Kun (2016) Z. Danku and F. Kun, J. Stat. Mech.: Theor. Exp. 2016, 073211 (2016).
- Ojala et al. (2004) I. O. Ojala, I. G. Main, and B. T. Ngwenya, Geophys. Res. Lett. 31, L24617 (2004).
- Lockner (1993) D. Lockner, Int. J. Rock Mech. Min. Sci. & Geomech. Abstr. 30, 883 (1993).
- Lennartz-Sassinek et al. (2013) S. Lennartz-Sassinek, I. G. Main, Z. Danku, and F. Kun, Phys. Rev. E 88, 032802 (2013).
- Meinders and Vliet (2008) M. B. J. Meinders and T. v. Vliet, Phys. Rev. E 77, 036116 (2008).
- Rosti et al. (2010) J. Rosti, J. Koivisto, and M. J. Alava, J. Stat. Mech. 2010, P02016 (2010).
- Jiang et al. (2017) X. Jiang, H. Liu, I. G. Main, and E. K. H. Salje, Phys. Rev. E 96, 023004 (2017).
- Baró et al. (2013) J. Baró, A. Corral, X. Illa, A. Planes, E. K. H. Salje, W. Schranz, D. E. Soto-Parra, and E. Vives, Phys. Rev. Lett. 110, 088702 (2013).
- Castillo-Villa et al. (2013) P. O. Castillo-Villa, J. Baró, A. Planes, E. K. H. Salje, P. Sellappan, W. M. Kriven, and E. Vives, J. Phys.: Cond. Matt. 25, 292202 (2013).
- Monkman and Grant (1956) F. C. Monkman and N. J. Grant, Proc. Am. Sc. Test. Mater. 56, 593 (1956).
- Sornette (2002) D. Sornette, PNAS 99, 2522 (2002).
- Kovács et al. (2008) K. Kovács, S. Nagy, F. Kun, H. J. Herrmann, and I. Pagonabarraga, Phys. Rev. E 77, 036102 (2008).
- Koivisto et al. (2016) J. Koivisto, M. Ovaska, A. Miksic, L. Laurson, and M. J. Alava, Phys. Rev. E 94, 023002 (2016).
- Nechad et al. (2005a) H. Nechad, A. Helmstetter, R. E. Guerjouma, and D. Sornette, J. Mech. Phys. Solids 53, 1099 (2005a).
- Nechad et al. (2005b) H. Nechad, A. Helmstetter, R. E. Guerjouma, and D. Sornette, Phys. Rev. Lett. 94, 045501 (2005b).