Large Lyman- opacity fluctuations and low CMB in models of late reionization with large islands of neutral hydrogen extending to
Abstract
High-redshift QSO spectra show large spatial fluctuations in the Ly opacity of the intergalactic medium on surprisingly large scales at . We present a radiative transfer simulation of cosmic reionization driven by galaxies that reproduces this large scatter and the rapid evolution of the Ly opacity distribution at . The simulation also reproduces the low Thomson scattering optical depth reported by the latest CMB measurement and is consistent with the observed short near-zones and strong red damping wings in the highest-redshift QSOs. It also matches the rapid disappearance of observed Ly emission by galaxies at . Reionization is complete at in our model, and 50% of the volume of the Universe is ionized at . Agreement with the Ly forest data in such a late reionization model requires a rapid evolution of the ionizing emissivity of galaxies that peaks at . The late end of reionization results in a large scatter in the photoionisation rate and the neutral hydrogen fraction at redshifts as low as with large residual neutral ‘islands’ that can produce very long Gunn-Peterson troughs resembling those seen in the data.
keywords:
dark ages – reionization, first stars – intergalactic medium – radiative transfer – galaxies: high-redshift – quasars: absorption lines1 Introduction
The effective optical depth () of Lyman- (Ly) absorption in QSO spectra at redshift is observed to exhibit large spatial fluctuations (Fan et al., 2006; Willott et al., 2007; Becker et al., 2015; Barnett et al., 2017; Tang et al., 2017; Bosman et al., 2018; Eilers et al., 2018). Becker et al. (2015) showed that the dispersion in at these redshifts is significantly larger than that expected from density fluctuations alone (Lidz et al., 2006; Lidz et al., 2007; Mesinger, 2010). Although this suggests that the observed Ly data are probing a fluctuating UV background due to patchy reionization, Becker et al. (2015) found that the scatter in is also greater than that in models with a fluctuating UV background with a spatially uniform mean free path of ionizing photons.
Using a semi-numerical reionization model, Davies & Furlanetto (2016) showed that fluctuations in the mean free path due to spatial variation in the photoionisation rate and gas density can explain the observed distribution of at , albeit with a rather short mean free path that decreases rapidly with distance from (bright) ionizing sources and that is in the mean a factor of smaller than that expected from an extrapolation of measurements at – (Worseck et al., 2014). The model by Davies & Furlanetto (2016) also does not address the rather rapid evolution of the Ly opacity distribution at . Chardin et al. (2015, 2017) presented a model where the observed large fluctuations arise due to fluctuations in a UV background with a significant contribution from rare, bright sources such as quasars that have a mean separation greater than the mean free path. Despite the resulting large fluctuations of the photoionisation rate the “rare-source model" of Chardin et al. (2015) struggled, however, to reproduce the long (up to 110 cMpc) and dark () Ly absorption troughs seen down to (Becker et al., 2015) unless the space density of intermediate-brightness quasars is higher than that inferred from QSO surveys (Kulkarni et al., 2018) by a factor 3–10 (Chardin et al., 2017). The required large contribution of QSOs to the ionizing emissivity at 1 Ry appears also to be in conflict with the observed He opacity and measurements of the temperature of the IGM (D’Aloisio et al., 2017; Puchwein et al., 2018) unless unlike normal QSOs the rare ionizing sources have little emission at energies larger than 1 Ry. Another explanation for the large fluctuations in was proposed by D’Aloisio et al. (2015), who argued that spatial variation in gas temperature can lead to the observed scatter in due to the temperature dependence of the recombination rate, albeit with a reionization history that is more extended than suggested by recent CMB and Ly absorption and emission data (see Keating et al. 2018 for a discussion).
While efforts are underway to observationally determine which of these models describes the origin of the fluctuations (Becker et al., 2018; Davies et al., 2018b), it is clearly necessary to self-consistently model spatial variation in the UV background, the mean free path of ionizing photons, and the gas temperature in radiative transfer simulations of reionization. In this Letter, we present results from such a simulation that allows us to probe scales larger than the rapidly increasing mean free path during the overlap of H regions. This has become possible by pushing our simulations to particles/cells with a box size of 160 Mpc that allow us to sample a large enough cosmological volume at sufficient resolution while enabling us to avoid several simplifying assumptions made in the models described above. After deriving the spatial distribution of the neutral hydrogen fraction, the photoionization rate, and the gas temperature, we investigate the distribution of and compare it to data. We present the details of our simulation in Section 2. Section 3 discusses the fluctuations in our model. Our CDM cosmological model has , , , , , , and (Planck Collaboration XVI, 2014).
2 Simulation set-up and calibration
We perform single-frequency cosmological radiative transfer using the ATON code (Aubert & Teyssier, 2008, 2010), following an approach similar to Chardin et al. (2015) and Keating et al. (2018). Cosmological density fields obtained from hydrodynamical simulations are post-processed by ATON.
Our cosmological hydrodynamical simulation was performed using the p-gadget-3 code, which is derived from the gadget-2 code (Springel et al., 2001; Springel, 2005). We used a box size of 160 cMpc with gas and dark matter particles with a dark matter particle mass of M and gas particle mass of M. The initial conditions are identical to those of the 160–2048 simulation from the Sherwood simulation suite (Bolton et al., 2017). These initial conditions were evolved from to . We saved 38 snapshots at 40 Myr intervals. In order to speed up the simulation, we used the QUICK_LYALPHA option in p-gadget-3 to convert gas particles with temperature less than K and overdensity of more than a thousand to star particles (Viel et al., 2004). This approximation does not affect the reionization process as the mean free path of ionizing photons is determined by self-shielded regions with a typical overdensity of – (Pawlik et al., 2009; Chardin et al., 2018). We grid the gas density on a cartesian grid with the number of grid cells equal to the number of SPH particles, yielding a grid resolution of 78.125 ckpc. ATON is then used to perform radiative transfer in post-processing. ATON solves the radiative transfer equation by using a moment-based description with the M1 approximation for the Eddington tensor (Gnedin & Abel, 2001; Aubert & Teyssier, 2008) and self-consistently derives the fraction of ionized hydrogen and the gas temperature on the grid. The adiabatic cooling of gas due to cosmic expansion is accounted for. The hydrodynamic response of the gas due to the changes in temperature is neglected. However, we do not expect this to seriously affect the results, as the pressure smoothing scale at redshifts for our chosen UV background is less than 100 ckpc (Kulkarni et al., 2015; Oñorbe et al., 2017), approximately equal to the cell size of our grid. Ionizing sources are placed at the centres of mass of haloes with masses above M.
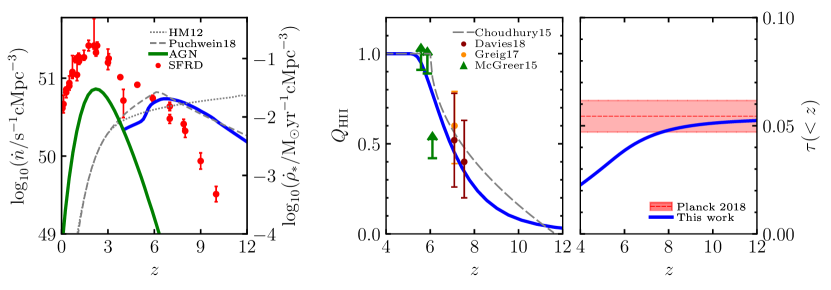
We assume that the ionizing luminosity of a source, , is proportional to its halo mass and require that the total volume emissivity , where is the box volume, matches a pre-selected emissivity evolution (cf. Chardin et al., 2015). Our chosen emissivity, shown in the left panel of Figure 1, peaks at redshift and drops towards higher redshifts somewhat more slowly than current estimates of the evolution of the cosmic star formation rate density. This is strikingly different from the evolution adopted by Chardin et al. (2015) and Keating et al. (2018), in which the emissivity at is much higher. The emissivity assumed here drops by a factor of two between and . As we discuss below, this decrease at allows us to reproduce the observed mean Ly transmission at these redshifts, while the decrease in the emissivity towards higher redshift at results in a rather late reionization. Note that the emissivity model required to match the Ly forest opacity as well as the Planck Collaboration VI (2018) Thompson scattering optical depth is similar to the fiducial model for the ionizing emissivity of galaxies in Puchwein et al. (2018). As in the Puchwein et al. (2018) model, the difference in the evolutionary trends of the emissivity and the cosmic star formation rate density (Figure 1) can be attributed to the evolution of the escape fraction of ionizing photons from galaxies, possibly due to changes in morphology, stellar populations, and dust content of these galaxies (Rosdahl et al., 2018; Trebitsch et al., 2017; Kimm et al., 2017; Paardekooper et al., 2015; Kimm & Cen, 2014; Yajima et al., 2011). We use a single photon frequency to reduce the computational cost and assume that all sources have a blackbody spectrum with 70,000 K (Keating et al., 2018). This yields an average photon energy of 23.83 eV in the optically thick limit. We have varied these assumptions and found our results to be robust. We will discuss more details in future work.
3 Large Ly opacity fluctuations
Figure 1 shows the evolution of the volume-averaged ionized hydrogen fraction . Reionization is considerably late in our simulation compared to most models in the literature (e.g., Haardt & Madau, 2012), and is comparable to the ‘Very Late’ model shown by Choudhury et al. (2015) to be consistent with the rapid disappearence of Ly emission of high-redshift galaxies. Half of the cosmic volume is reionized at . The duration of reionization, as quantified by the difference in the redshifts at which 5% and 95% cosmic volume is reionized, , is 3.89. Reionization is complete at . This evolution is also in excellent agreement with the determination of at and by Davies et al. (2018a) and at by Greig et al. (2017) from the red damping wing and the short near-zones in the two highest redshift QSOs known. Figure 1 also shows the electron scattering optical depth in our model, , in excellent agreement with the most recent determination of from Planck Collaboration VI (2018). Note that following Planck Collaboration VI 2018, we assume here that He reionizes instantaneously at .
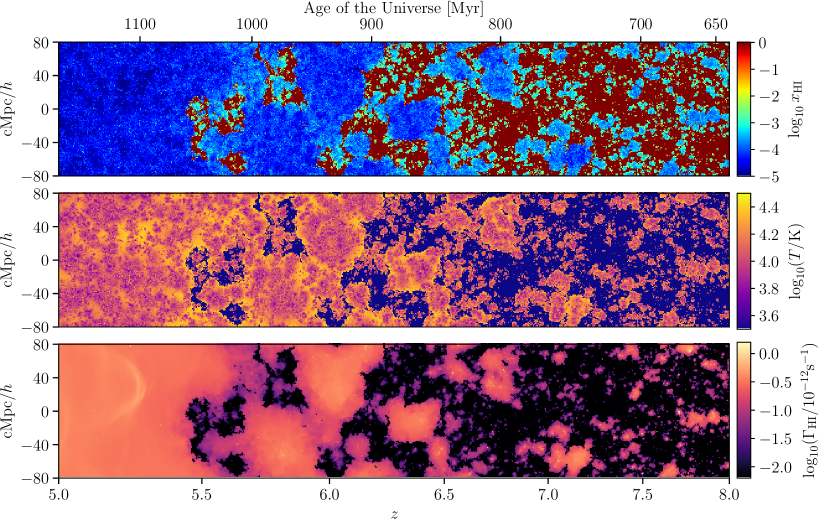
Figure 2 shows the neutral hydrogen fraction , gas temperature , and the hydrogen photoionization rate from to . These lightcones nicely illustrate the patchy and delayed nature of reionization in our simulation, with ‘islands’ of neutral hydrogen several tens of megaparsecs in length persisting down to . Large coherent spatial variation of the neutral fraction are seen at even lower redshifts (). These are accompanied by large-scale, coherent fluctuations (a factor of 3–4 at ) in the gas temperature that persist all the way down to (cf. Keating et al., 2018). Note that the photoionisation rate is significantly reduced in the vicinity of the remaining neutral islands likely due to a combination of these regions only being recently ionized and having a reduced mean free path for photons arriving from the direction of the neutral islands. Note further that the last neutral islands to be reionized attain the highest temperatures and switch from exhibiting the largest effective optical depth to exhibiting the lowest effective optical depth at a given redshift very quickly.
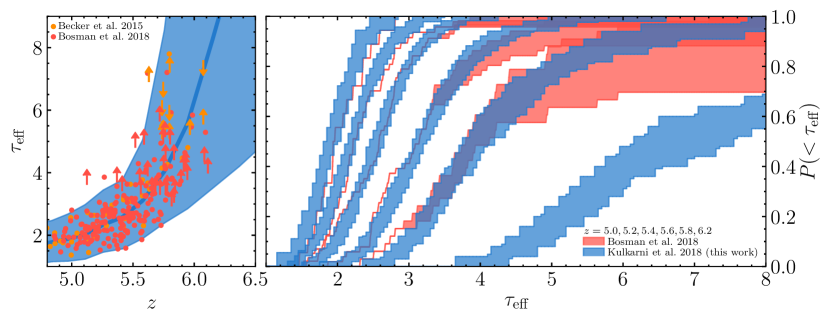
Observations traditionally quantify effective optical depths over spectral chunks corresponding to 50 cMpc. At , this corresponds to Myr. As seen in Figure 2, the IGM evolves rapidly over this time scale at these redshifts. To incorporate this rapid evolution in our simulated spectra, we interpolate lines of sight in time between different snapshots. Figure 3 shows the resultant evolution of in our model in comparison with measurements from Bosman et al. (2018) and Becker et al. (2015). Our simulated spectra match the data very well down to . The late end of reionization and the persistence of large neutral hydrogen islands down to result in sightlines that still have at . Figure 3 also shows the cumulative distribution function of in six redshift bins from to and at . At –, we compare our results with the measurements by Bosman et al. (2018) who present their results as ‘optimistic’ and ‘pessimistic’ limits on the distribution. Lower limits on are treated as measurements in the optimistic case, whereas these are assumed to have values greater than in the pessimistic case. When comparing the simulation with data, we draw 50 samples with the same size and redshift distribution as that of the data in Bosman et al. (2018) and show the 68% scatter in Figure 3. At , where no measurements are available yet, we used a sample size of 25. The values reported by Eilers et al. (2018) are systematically higher than those measured by Bosman et al. (2018), but it is certainly possible to match the Eilers et al. (2018) data if we delay reionization in our model further. We also note that increasing the spatial resolution does not change our results, although for a factor-of-2 higher resolution we find that a small enhancement (%) in the emissivity is required as more high-density absorbers are resolved. Similarly, changing the photon energy in our simulation does not affect the opacity fluctuations. Since the simulation is calibrated to the mean Ly transmission, a change in the photon energy only marginally changes the ionization fraction and the required ionizing photon emissivity without altering the opacity distribution.
4 Discussion and Conclusions
We have presented a radiative transfer simulation of cosmic reionization by galaxies that closely agrees with the measurements of the effective Ly opacity of the intergalactic medium at –. Our reionization history also agrees very well with the electron scattering optical depth measurements from CMB experiments, as well as constraints on the ionization state of the IGM from QSO near-zones at and the rapid disappearance of Ly emission from high-redshift galaxies. This very good agreement with a wide range of data is owed to reionization occuring rather late in the model with a rapid evolution in ionizing emissivity that is peaked at suggesting that the contribution of galaxies to the ionizing emissivity at is small. The reionization history in this model results in a broad scatter in the neutral hydrogen fraction and large neutral hydrogen ‘islands’ persisting to redshifts as low as . As we will discuss in future work, these large late remaining neutral islands can result in long Gunn-Peterson troughs resembling those seen in the data. The simulation also shows large spatially coherent fluctuations of the temperature-density relation that persist down to . Unlike other proposed models, our modelling solves the mystery of the large scatter of the Ly opacity on surprisingly large scales without requiring ionizing sources or properties of the IGM in tension with current observations and/or theoretical expectations. Published Ly data already now provides very tight constraints on the ionization and thermal history of the IGM at . With further improved Ly absorption/emission data and by adding information from Ly and metal absorption data it should soon be possible to fully map out the exact history of the second half () of cosmic reionization or more.
Acknowledgements
This work used the Cambridge Service for Data Driven Discovery (CSD3) operated by the University of Cambridge (www.csd3.cam.ac.uk), provided by Dell EMC and Intel using Tier-2 funding from the Engineering and Physical Sciences Research Council (capital grant EP/P020259/1), and DiRAC funding from the Science and Technology Facilities Council (www.dirac.ac.uk). This work further used the COSMA Data Centric system operated Durham University on behalf of the STFC DiRAC HPC Facility. This equipment was funded by a BIS National E-infrastructure capital grant ST/K00042X/1, DiRAC Operations grant ST/K003267/1 and Durham University. DiRAC is part of the National E-Infrastructure. We thank Joseph Hennawi and Anna-Christina Eilers for data and discussions. We acknowledge support from ERC Advanced Grant 320596 ‘Emergence’.
References
- Aubert & Teyssier (2008) Aubert D., Teyssier R., 2008, MNRAS, 387, 295
- Aubert & Teyssier (2010) Aubert D., Teyssier R., 2010, ApJ, 724, 244
- Barnett et al. (2017) Barnett R., Warren S. J., Becker G. D., Mortlock D. J., Hewett P. C., McMahon R. G., Simpson C., Venemans B. P., 2017, A&A, 601, A16
- Becker et al. (2011) Becker G. D., Bolton J. S., Haehnelt M. G., Sargent W. L. W., 2011, MNRAS, 410, 1096
- Becker et al. (2015) Becker G. D., Bolton J. S., Madau P., Pettini M., Ryan-Weber E. V., Venemans B. P., 2015, MNRAS, 447, 3402
- Becker et al. (2018) Becker G. D., Davies F. B., Furlanetto S. R., Malkan M. A., Boera E., Douglass C., 2018, ApJ, 863, 92
- Bolton et al. (2017) Bolton J. S., Puchwein E., Sijacki D., Haehnelt M. G., Kim T.-S., Meiksin A., Regan J. A., Viel M., 2017, MNRAS, 464, 897
- Bosman et al. (2018) Bosman S. E. I., Fan X., Jiang L., Reed S., Matsuoka Y., Becker G., Haehnelt M., 2018, MNRAS,
- Chardin et al. (2015) Chardin J., Haehnelt M. G., Aubert D., Puchwein E., 2015, MNRAS, 453, 2943
- Chardin et al. (2017) Chardin J., Puchwein E., Haehnelt M. G., 2017, MNRAS, 465, 3429
- Chardin et al. (2018) Chardin J., Kulkarni G., Haehnelt M. G., 2018, MNRAS, 478, 1065
- Choudhury et al. (2015) Choudhury T. R., Puchwein E., Haehnelt M. G., Bolton J. S., 2015, MNRAS, 452, 261
- D’Aloisio et al. (2015) D’Aloisio A., McQuinn M., Trac H., 2015, ApJ, 813, L38
- D’Aloisio et al. (2017) D’Aloisio A., Upton Sanderbeck P. R., McQuinn M., Trac H., Shapiro P. R., 2017, MNRAS, 468, 4691
- Davies & Furlanetto (2016) Davies F. B., Furlanetto S. R., 2016, MNRAS, 460, 1328
- Davies et al. (2018a) Davies F. B., et al., 2018a, arXiv:1802.06066 [astro-ph.CO]
- Davies et al. (2018b) Davies F. B., Becker G. D., Furlanetto S. R., 2018b, ApJ, 860, 155
- Eilers et al. (2018) Eilers A.-C., Davies F. B., Hennawi J. F., 2018, ApJ, 864, 53
- Fan et al. (2006) Fan X., et al., 2006, AJ, 132, 117
- Gnedin & Abel (2001) Gnedin N. Y., Abel T., 2001, New Astron., 6, 437
- Greig et al. (2017) Greig B., Mesinger A., Haiman Z., Simcoe R. A., 2017, MNRAS, 466, 4239
- Haardt & Madau (2012) Haardt F., Madau P., 2012, ApJ, 746, 125
- Keating et al. (2018) Keating L. C., Puchwein E., Haehnelt M. G., 2018, MNRAS, 477, 5501
- Kimm & Cen (2014) Kimm T., Cen R., 2014, ApJ, 788, 121
- Kimm et al. (2017) Kimm T., Katz H., Haehnelt M., Rosdahl J., Devriendt J., Slyz A., 2017, MNRAS, 466, 4826
- Kulkarni et al. (2015) Kulkarni G., Hennawi J. F., Oñorbe J., Rorai A., Springel V., 2015, ApJ, 812, 30
- Kulkarni et al. (2018) Kulkarni G., Worseck G., Hennawi J. F., 2018, arXiv:1807.09774 [astro-ph.GA]
- Lidz et al. (2006) Lidz A., Oh S. P., Furlanetto S. R., 2006, ApJ, 639, L47
- Lidz et al. (2007) Lidz A., McQuinn M., Zaldarriaga M., Hernquist L., Dutta S., 2007, ApJ, 670, 39
- Madau & Dickinson (2014) Madau P., Dickinson M., 2014, ARA&A, 52, 415
- McGreer et al. (2015) McGreer I. D., Mesinger A., D’Odorico V., 2015, MNRAS, 447, 499
- Mesinger (2010) Mesinger A., 2010, MNRAS, 407, 1328
- Oñorbe et al. (2017) Oñorbe J., Hennawi J. F., Lukić Z., 2017, ApJ, 837, 106
- Oesch et al. (2014) Oesch P. A., et al., 2014, ApJ, 786, 108
- Oesch et al. (2018) Oesch P. A., Bouwens R. J., Illingworth G. D., Labbé I., Stefanon M., 2018, ApJ, 855, 105
- Paardekooper et al. (2015) Paardekooper J.-P., Khochfar S., Dalla Vecchia C., 2015, MNRAS, 451, 2544
- Pawlik et al. (2009) Pawlik A. H., Schaye J., van Scherpenzeel E., 2009, MNRAS, 394, 1812
- Planck Collaboration VI (2018) Planck Collaboration VI 2018, arXiv:1807.06209 [astro-ph.CO]
- Planck Collaboration XVI (2014) Planck Collaboration XVI 2014, A&A, 571, A16
- Puchwein et al. (2018) Puchwein E., Haardt F., Haehnelt M. G., Madau P., 2018, arXiv:1801.04931 [astro-ph.GA]
- Rosdahl et al. (2018) Rosdahl J., et al., 2018, MNRAS, 479, 994
- Springel (2005) Springel V., 2005, MNRAS, 364, 1105
- Springel et al. (2001) Springel V., Yoshida N., White S. D. M., 2001, New Astron., 6, 79
- Tang et al. (2017) Tang J.-J., et al., 2017, MNRAS, 466, 4568
- Trebitsch et al. (2017) Trebitsch M., Blaizot J., Rosdahl J., Devriendt J., Slyz A., 2017, MNRAS, 470, 224
- Viel et al. (2004) Viel M., Haehnelt M. G., Springel V., 2004, MNRAS, 354, 684
- Willott et al. (2007) Willott C. J., et al., 2007, AJ, 134, 2435
- Worseck et al. (2014) Worseck G., et al., 2014, MNRAS, 445, 1745
- Yajima et al. (2011) Yajima H., Choi J.-H., Nagamine K., 2011, MNRAS, 412, 411