11email: cesarmunoz@astro-udec.cl 22institutetext: European Southern Observatory, Casilla 19001, Santiago, Chile. 33institutetext: Space Telescope Science Institute, 3700 San Martin Drive, Baltimore, MD 21218, USA. 44institutetext: Instituto de Astronomía, Universidad Católica del Norte, Av. Angamos 0610, Antofagasta, Chile. 55institutetext: Instituto de Investigación Multidisciplinario en Ciencia y Tecnología, Universidad de La Serena. Avenida Raúl Bitrán S/N, La Serena, Chile 66institutetext: Departamento de Física y Astronomía, Facultad de Ciencias, Universidad de La Serena. Av. Juan Cisternas 1200, La Serena, Chile
Chemical analysis of NGC 6528: one of the most metal-rich bulge globular cluster
Abstract
Context. The Bulge Globular Clusters (GCs) are key tracers of this central ancient component of our Galaxy. It is essential to understand their formation and evolution to study that of the bulge, as well as their relationship with the other Galactic GC systems (halo and disk GCs). High resolution spectroscopy is a powerful tool for such studies, allowing us to obtain a detailed chemical characterization and kinematics of the clusters and to compare their chemical patterns with those of their halo and disk counterparts.
Aims. Our main goals are to obtain detailed abundances for a sample of seven red giant members of NGC 6528 in order to characterize its chemical composition and study the relationship of this GC with the bulge, and with other bulge, halo and disk GCs. Moreover, we analyze this cluster’s behavior associated with the Multiple Populations (MPs) phenomenon.
Methods. We obtained the stellar parameters and chemical abundances of light elements (Na, Al), iron-peak elements (V, Cr, Mn, Fe, Co, Ni, Cu), -elements (O, Mg, Si, Ca, Ti) and heavy elements (Zr, Ba, Eu) in seven red giant members of NGC 6528 using high resolution spectroscopy from FLAMES-UVES.
Results. We obtained in six stars of our sample a mean iron content of [Fe/H]=-0.140.03 dex, in good agreement with other studies. We found no significant internal iron spread. We detected one candidate variable star, which was excluded from the mean in iron content, we derived a metallicity in this star of [Fe/H]=-0.550.04 dex. Moreover, we found no extended O-Na anticorrelation but instead only an intrinsic Na spread. In addition, NGC 6528 does not exhibit a Mg-Al anticorrelation, and no significant spread in either Mg or Al. The and iron-peak elements show good agreement with the bulge field star trend. The heavy elements are slightly dominated by the r-process. The chemical analysis suggests an origin and evolution similar to that of typical old Bulge field stars. Finally, we find remarkable agreement in the chemical patterns of NGC 6528 and another bulge GC, NGC 6553, suggesting a similar origin and evolution.
Key Words.:
stars:abundances-globular clusters: individual: NGC 65281 Introduction
The detailed study of each main component of our Galaxy is critical to understand their formation and evolution, as well as that of the Galaxy as a whole. This is graphically illustrated by the many current and new surveys that seek to enlighten our Galactic knowledge, such as: the VVV survey (Minniti et al. 2010), the Gaia-ESO survey (Gilmore et al. 2012), SDSS-IV (Blanton et al. 2017), and The Gaia mission.
One of the main components of our Galaxy is the bulge, which, being likely the oldest Galactic component (e.g. Cescutti et al. 2017), provides us with invaluable information about the origin and subsequent evolution of our Galaxy. One of the key tracers of the bulge is the large number of GCs concentrated there, as first famously realized by Shapley, which we now recognize form an independent GC system from that of the halo (Minniti 1995). Despite the observational difficulties associated with detailed investigations of such GCs, particularly crowding in this dense central region of the Galaxy and strong and variable reddening, their importance is such that more and more studies are exploring these fundamental objects.
In general, the GCs that have been studied in the more accessible halo and disk have been characterized by inhomogeneities in their light-element content (C, N, O, Na, Mg and/or Al), most prominently appearing as O-Na and Mg-Al anticorrelations. In fact, the O-Na anticorrelation has been found in almost all Galactic GCs(Carretta et al. 2009a), with Ruprecht 106 (Villanova et al. 2013) being the most likely exception, and has even been suggested as a defining characteristic of GCs (Carretta et al. 2009a, b, 2010b).
These chemical patterns must be due to the self-enrichment that GCs suffer in the early stages of their formation, allowing the formation of multiple generations of stars within the GC (Gratton et al. 2004). Suggested ‘polluters include intermediate mass AGB stars (D’Antona et al. 2002, 2016), fast rotating massive MS stars (Decressin et al. 2007; Krause et al. 2013) and massive binaries (de Mink et al. 2010; Izzard et al. 2013).
The spread in iron content is another peculiarity that has been observed in a smaller fraction of GCs, although in some cases this needs to be corroborated with more detailed studies, as in the case of NGC 3201 (Simmerer et al. 2013; Muñoz et al. 2013; Mucciarelli et al. 2015). In general, some massive GCs in particular display iron variations, most notably Omega Cen (Johnson et al. 2008; Marino et al. 2011a), M22 (Marino et al. 2011b; Da Costa et al. 2009), M54 (Carretta et al. 2010a) and Terzan 5 (Origlia et al. 2011).
The study of Bulge GCs, although lagging behind until now because of observational issues, has seen increasing efforts recently, allowing important improvements in our previously very scanty knowledge of these key objects. In our first paper on bulge GCs, focused on NGC 6440 (Muñoz et al. 2017), we found that apparentlRy the evolution of some bulge GCs is not so similar to that of the halo GCs as often postulated. Additionally, the bulge GCs show great agreement with the overall chemistry of bulge field stars (Muñoz et al. 2017). However, the main problems limiting study of bulge GCs remain the large and variable extinction and high crowding.
In this second paper, we have studied the bulge GC NGC 6528. It is located at (l=), at a distance of 0.6 Kpc from the Galactic center with a nominal reddening of E(B-V)= 0.54 (Harris 1996, 2010 edition). It is a rather well-studied bulge GC, lying in Baade’s window and very near another bulge GC, NGC 6522. NGC 6528 has been studied by several authors with different instruments and techniques. Carretta et al. (2001) studied four Red Horizontal Branch (RHB) stars using high resolution spectrogrpah HIRES from the Keck telescope. Origlia et al. (2005) studied four Red Giant Branch (RGB) stars using the Near Infrared Spectrometer (NIRSPEC) spectrograph at Keck II, and they achieved to measure the chemical abundances for six different elements. Also, Schiavon et al. (2017) reported chemical abundances for six elements, which were obtained by Sloan Digital Sky Survey (SDSS)-III. Saviane et al. (2012) studied this cluster using the Calcium triplet technique, Lagioia et al. (2014) analyzed this cluster using optical photometry from HST, Cohen et al. (2017) used near-infrared photometry, Dias et al. (2015) studied a large sample of GCs among them NGC 6528 with low-resolution spectroscopy and Zoccali et al. (2004) used high-resolution spectroscopy and they found overall metallicity Z. It is particularly interesting that Mauro et al. (2014) found a possible iron spread in this GC based on the low resolution Ca triplet spectra of seven stars obtained by Saviane et al. (2012). We have made a detailed chemical characterization of this GC, measuring the abundance of 18 elements including light elements, alpha elements, iron-peak and heavy elements, yielding a much more detailed picture of the chemical evolution of this GC than previous available.
In section 2 we describe the observations and data reduction, in section 3 we explain the methodology we used to calculate atmospheric parameters, errors and chemical abundances. In section 4 we present our results concerning the variability in one star of our sample and abundances for iron-peak elements, alpha elements, the Na-O anticorrelation, the Mg-Al relations and heavy elements. Our findings are used in Sec. 5 to shed light on the origin of NGC 6528. Finally, in Section 6 our conclusions are presented.
2 Observations and data reduction
We observed red giants towards NGC 6528 with the fiber-fed multiobject FLAMES spectrograph mounted at the ESO VLT/UT2 telescope in Cerro Paranal (Chile) (ESO program ID 093.D-0286, PI S. Villanova). We here analyze the seven stars observed with the blue and red arms of the high-resolution spectrograph UVES. FLAMES-UVES data have a spectral resolution of about R47000. The data were taken with central wavelength 580 nm, which covers the wavelength range 476-684 nm. Our S/N is about 30 at 650 nm.
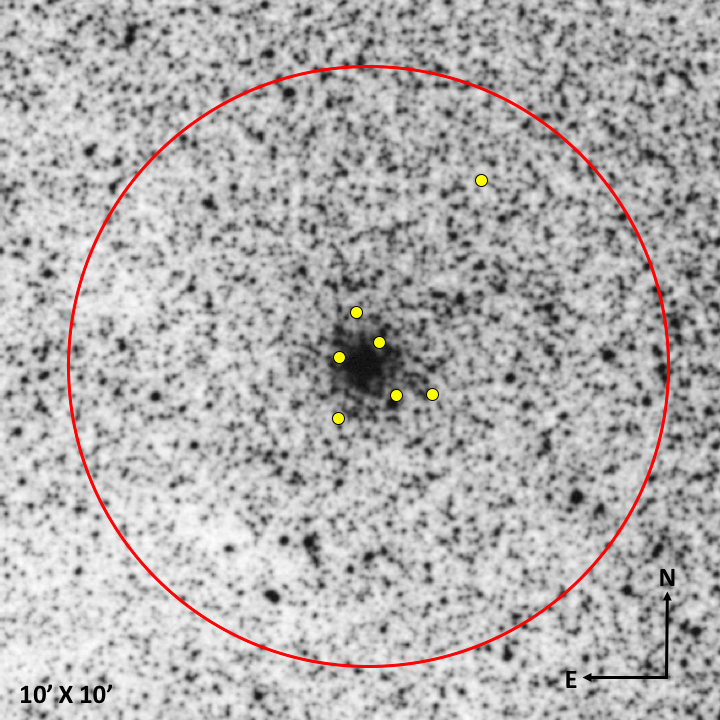
Six of the seven targets observed with FLAMES@UVES came from the membership list of NGC 6528 previously published in Saviane et al. (2012) and Mauro et al. (2014) using FORS2 and VVV. Star #1 is not part of any previous study, but was selected as a likely member based on its position in the CMD. Our subsequent analysis shows that all seven stars are indeed members taking into account the radial velocity, metallicity, CMD position and detailed chemical patterns. Their spatial distribution is shown in Figure 1
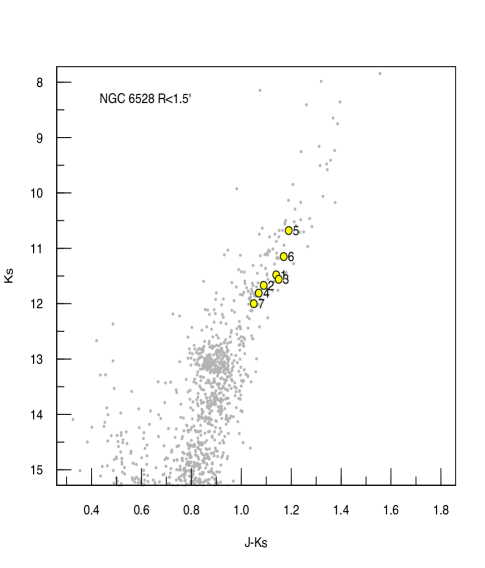
All the stars of our sample belong to the upper RGB, as can be clearly seen in the CMD of the cluster (Figure 2). Star #5 will be discussed in section 4.1.
Data reduction was performed using the ESO CPL based FLAMES/UVES Pipeline version 5.3.0111http://www.eso.org/sci/software/pipelines/ for extracting the individual fiber spectra. Data reduction includes bias subtraction, flat-field correction, wavelength calibration, and spectral rectification.
We subtracted the sky using the Sarith package in IRAF and measured radial velocities using the FXCOR package in IRAF and a synthetic spectrum as a template. The mean heliocentric radial velocity for our seven targets is 210.8 2.5 km . Our velocity dispersion is 6.7 km .
Our mean radial velocity is compatible with the values in the literature: Saviane et al. (2012) with four stars found a value of 205 2 km , Harris (1996, 2010 edition) quotes a value of 206.6 1.4 km , Carretta et al. (2001) found a value of 210 km , Schiavon et al. (2017) reported a mean radial velocity of 213 km for two stars and Origlia et al. (2005) found a value of 210 km in a sample of four RGB stars. Table 1 lists the stellar parameters of our sample: ID, the J2000 coordinates (RA and Dec), J, H, Ks magnitudes from VVV PSF photometry (de-reddened), calibrated on the system of 2MASS (Mauro et al. 2014; Cohen et al. 2017), heliocentric radial velocity, Teff, log(g), metallicity and micro-turbulent velocity (). Moreover, Table 2 shows the metallicity values from Saviane et al. (2012), Mauro et al. (2014) and Liu et al. (2017).
| ID | Ra | DEC | J | H | Ks | RVH | Teff | log(g) | [Fe/H] | |
|---|---|---|---|---|---|---|---|---|---|---|
| (h:m:s) | (:′:′′ ) | (mag) | (mag) | (mag) | (km ) | [K] | dex | [km/s] | ||
| 1 | 18:04:42.16 | -30:00:49.70 | 12.62 | 11.72 | 11.49 | 198.93 0.21 | 4133 | 1.67 | -0.16 | 1.14 |
| 2 | 18:04:51.32 | -30:04:05.68 | 12.76 | 11.92 | 11.67 | 209.910.14 | 4357 | 2.00 | -0.12 | 1.43 |
| 3 | 18:04:47.76 | -30:03:47.05 | 12.71 | 11.82 | 11.56 | 215.30 0.16 | 4232 | 2.03 | -0.24 | 1.52 |
| 4 | 18:04:50.13 | -30:02:38.05 | 12.88 | 12.02 | 11.81 | 216.080.20 | 4369 | 2.14 | -0.11 | 1.42 |
| 5 | 18:04:45.38 | -30:03:46.94 | 11.87 | 10.95 | 10.68 | 209.70 0.23 | 4118 | 1.58 | -0.55 | 1.79 |
| 6 | 18:04:51.17 | -30:03:14.95 | 12.32 | 11.43 | 11.15 | 218.71 0.19 | 4120 | 1.39 | -0.20 | 1.27 |
| 7 | 18:04:48.75 | -30:03:01.88 | 13.05 | 12.23 | 12.00 | 206.91 0.18 | 4299 | 1.86 | -0.03 | 1.12 |
| ID. | [Fe/H]this_work | [Fe/H]S12 | [Fe/H]M14 | [Fe/H]L17 |
|---|---|---|---|---|
| 1 | -0.160.06 | - | - | - |
| 2 | -0.120.06 | - | -0.15 0.14 | - |
| 3 | -0.240.06 | - | -0.27 0.14 | -0.070.12 |
| 4 | -0.110.06 | -0.38 0.16 | -0.500.14 | - |
| 5 | -0.550.06 | - | -0.17 0.14 | -0.15 0.09 |
| 6 | -0.200.06 | -0.220.16 | -0.44 0.14 | -0.170.12 |
| 7 | -0.030.06 | -0.570.16 | -0.64 0.14 | - |
3 Atmospheric Parameters and Abundances
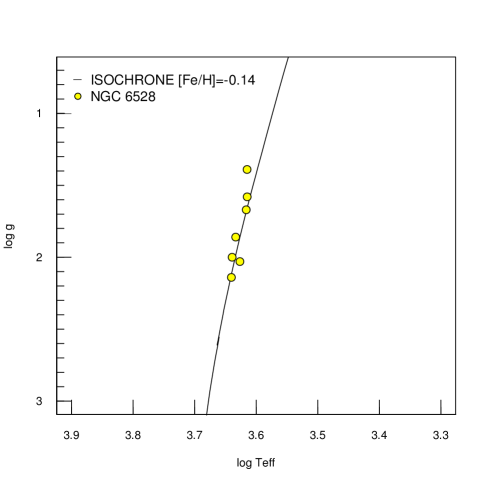
We have analyzed our sample of seven members of NGC 6528 using the local thermodynamic equilibrium (LTE) program MOOG (Sneden 1973). The procedure which we used in this paper to calculate the atmospheric parameters is the same that was described in our previous study of NGC 6440 (Muñoz et al. 2017). In Figure 4 we show the good agreement between our stellar parameters and an isochrone of similar metallicity as we derive ([Fe/H]=-0.14 dex) and age of 11 Gyr (Dotter et al. 2008).
Although NGC 6528 lies towards the bulge, its location in Baade’s Window means the extinction is not as high as for other nearby regions with similar Galactic coordinates. The mean color excess quoted by Harris (1996, 2010 edition) is E(B-V)=0.54 and Momany et al. (2003) found a very similar value of E(B-V)=0.55. Moreover, like the majority of bulge GCs, it is assumed to have differential reddening and certainly high crowding being in Baade’s Window, which complicates the identification of member stars. We determined the stellar parameters directly from the spectra, so our measurement of abundances is not affected by the effects of reddening.
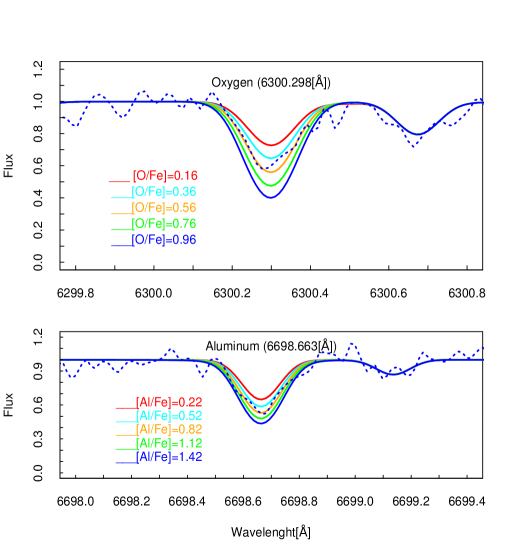
We used equivalent widths (EWs) of the spectral lines to obtain the abundances for Ca, Ti, Fe, Co and Ni; the detailed explanation of the method we used to measure the EWs is given in Marino et al. (2008). Spectrum synthesis was used to determine the abundances of the other elements (O, Na, Mg, Al, Si, Sc, V, Cr, Mn, Cu, Zr, Ba and Eu), whose lines are affected by blending. We calculated five synthetic spectra of different abundance for each line, and estimated the best-fitting value as the one that minimizes the rms scatter. An example of this method is showed in Figure 3 for two lines (Oxygen and Aluminum). Only lines not contaminated by telluric lines were used. The adopted solar abundances we used are reported in Table 3.
We performed an internal error analysis varying , log(g), [Fe/H], and and redetermining abundances of each element for star #3 of our sample, assumed to be representative of the entire sample. Parameters were varied by =+41 K, log(g)=+0.14 dex, =+0.05 dex, and =+0.13 , which we estimated as our typical internal errors. The amount of variation of the parameter was calculated using three stars representative of our sample (#1,#3, and #4) with relatively low, intermediate and high effective temperature respectively, according to the procedure that was performed by Marino et al. (2008), which we follow in this study. Moreover, the procedure was used previously in several studies with excellent results (Muñoz et al. 2013, 2017; Mura-Guzmán et al. 2018).
The error introduced by the uncertainty on the EW () was calculated by dividing the rms scatter by the square root of the number of the lines used for a given element and a given star. For elements whose abundance was obtained by spectrum-synthesis, the error is given in the output of the fitting procedure.
Finally, the error for each [X/Fe] ratio as a result of uncertainties in atmospheric parameters and are listed in Table 4. The total internal error () is given by:
| (1) |
In Table 4 we compare the total internal error for each element with the observed error (standard deviation of the sample).
| El. | 1 | 2 | 3 | 4 | 5 | 6 | 7 | Cluster | Sun |
|---|---|---|---|---|---|---|---|---|---|
| O/Fe | 0.07 | 0.00 | 0.31 | 0.15 | 0.11 | -0.09 | -0.09 | +0.070.05 | 8.83 |
| 0.03 | 0.04 | 0.04 | 0.06 | 0.05 | 0.03 | 0.05 | |||
| Na/Fe | 0.10 | -0.02 | 0.31 | 0.75 | 0.82 | 0.60 | 0.19 | +0.390.13 | 6.32 |
| 0.08 | 0.07 | 0.06 | 0.07 | 0.06 | 0.04 | 0.07 | |||
| Mg/Fe | 0.34 | 0.37 | 0.24 | 0.20 | 0.29 | 0.28 | 0.11 | +0.260.03 | 7.56 |
| 0.03 | 0.05 | 0.05 | 0.06 | 0.07 | 0.04 | 0.06 | |||
| Al/Fe | 0.44 | 0.32 | 0.54 | 0.56 | 0.49 | 0.40 | 0.33 | +0.440.04 | 6.43 |
| 0.04 | 0.04 | 0.04 | 0.05 | 0.07 | 0.04 | 0.05 | |||
| Si/Fe | 0.16 | -0.17 | -0.06 | 0.20 | -0.10 | -0.07 | -0.12 | -0.020.05 | 7.61 |
| 0.08 | 0.06 | 0.06 | 0.07 | 0.06 | 0.04 | 0.08 | |||
| Ca/Fe | 0.01 | -0.10 | 0.02 | 0.02 | 0.10 | 0.21 | -0.05 | +0.030.04 | 6.39 |
| 0.07 | 0.06 | 0.04 | 0.06 | 0.05 | 0.05 | 0.06 | |||
| Sc/Fe | 0.32 | 0.22 | 0.38 | 0.41 | -0.12 | 0.04 | 0.11 | +0.190.07 | 3.12 |
| 0.07 | 0.06 | 0.06 | 0.07 | 0.07 | 0.04 | 0.07 | |||
| Ti/Fe | 0.44 | 0.24 | 0.47 | 0.52 | 0.60 | 0.73 | 0.45 | +0.490.06 | 4.94 |
| 0.03 | 0.04 | 0.04 | 0.06 | 0.05 | 0.06 | 0.06 | |||
| V/Fe | 0.13 | 0.17 | 0.22 | 0.19 | 0.33 | 0.25 | 0.23 | +0.220.02 | 4.00 |
| 0.06 | 0.06 | 0.06 | 0.06 | 0.05 | 0.04 | 0.06 | |||
| Cr/Fe | 0.07 | -0.07 | 0.31 | 0.10 | 0.18 | 0.26 | -0.03 | +0.120.05 | 5.63 |
| 0.10 | 0.10 | 0.10 | 0.11 | 0.06 | 0.06 | 0.08 | |||
| Mn/Fe | 0.40 | 0.04 | 0.27 | 0.04 | 0.45 | 0.17 | 0.08 | +0.210.06 | 5.37 |
| 0.09 | 0.07 | 0.09 | 0.09 | 0.07 | 0.08 | 0.09 | |||
| Fe/H | -0.16 | -0.12 | -0.24 | -0.11 | -0.55 | -0.20 | -0.03 | -0.200.06 | 7.50 |
| 0.03 | 0.02 | 0.02 | 0.03 | 0.04 | 0.03 | 0.03 | |||
| Co/Fe | 0.74 | 0.52 | 0.64 | 0.61 | 0.54 | 0.83 | 0.53 | +0.630.04 | 4.93 |
| 0.08 | 0.08 | 0.09 | 0.10 | 0.09 | 0.08 | 0.10 | |||
| Ni/Fe | 0.25 | 0.15 | 0.22 | 0.16 | 0.13 | 0.41 | 0.22 | +0.220.04 | 6.26 |
| 0.05 | 0.06 | 0.08 | 0.06 | 0.06 | 0.08 | 0.08 | |||
| Cu/Fe | 0.15 | 0.01 | 0.49 | 0.31 | 0.44 | 0.47 | 0.52 | +0.340.07 | 4.19 |
| 0.09 | 0.11 | 0.12 | 0.13 | 0.10 | 0.10 | 0.12 | |||
| Zr/Fe | -0.19 | -0.22 | -0.14 | -0.17 | -0.05 | -0.19 | -0.15 | -0.160.02 | 2.25 |
| 0.05 | 0.04 | 0.06 | 0.06 | 0.04 | 0.04 | 0.06 | |||
| Ba/Fe | 0.04 | 0.07 | 0.08 | 0.06 | 0.00 | 0.08 | 0.10 | +0.060.01 | 2.34 |
| 0.06 | 0.05 | 0.06 | 0.07 | 0.04 | 0.04 | 0.06 | |||
| Eu/Fe | 0.30 | 0.25 | 0.37 | 0.31 | 0.13 | 0.16 | 0.26 | +0.250.03 | 0.52 |
| 0.04 | 0.05 | 0.05 | 0.05 | 0.04 | 0.04 | 0.06 |
The errors presented for each abundance, in columns 2-8, was calculated by dividing the rms scatter by the square root of the number of the lines used for a given element and a given star. For elements whose abundance was obtained by spectrum-synthesis, the error is the output of the fitting procedure.
| ID | |||||||
|---|---|---|---|---|---|---|---|
| -0.02 | 0.03 | -0.06 | -0.04 | 0.04 | 0.09 | 0.14 | |
| 0.04 | -0.03 | -0.04 | -0.04 | 0.06 | 0.10 | 0.33 | |
| 0.05 | 0.05 | 0.07 | 0.05 | 0.05 | 0.12 | 0.09 | |
| 0.03 | 0.02 | 0.05 | -0.02 | 0.04 | 0.08 | 0.10 | |
| 0.05 | 0.06 | 0.04 | 0.04 | 0.06 | 0.11 | 0.14 | |
| -0.01 | 0.01 | 0.05 | -0.01 | 0.04 | 0.07 | 0.10 | |
| 0.03 | -0.05 | 0.00 | 0.04 | 0.06 | 0.09 | 0.19 | |
| -0.01 | -0.01 | 0.05 | -0.01 | 0.04 | 0.07 | 0.15 | |
| 0.02 | 0.07 | 0.05 | 0.06 | 0.06 | 0.12 | 0.06 | |
| 0.00 | 0.00 | 0.05 | 0.00 | 0.10 | 0.11 | 0.14 | |
| 0.00 | 0.03 | 0.06 | -0.05 | 0.09 | 0.12 | 0.17 | |
| 0.01 | 0.02 | 0.03 | 0.03 | 0.02 | 0.05 | 0.16 | |
| 0.02 | -0.03 | 0.06 | 0.02 | 0.09 | 0.12 | 0.12 | |
| 0.02 | -0.03 | 0.05 | 0.02 | 0.08 | 0.10 | 0.09 | |
| 0.12 | 0.06 | 0.05 | 0.10 | 0.12 | 0.21 | 0.19 | |
| 0.11 | 0.07 | 0.06 | 0.08 | 0.17 | 0.12 | 0.05 | |
| 0.05 | 0.04 | 0.06 | -0.01 | 0.06 | 0.11 | 0.03 | |
| 0.01 | 0.06 | 0.03 | 0.03 | 0.05 | 0.09 | 0.08 |
4 Results
Here we discuss our results in detail, compare them with previous studies of this cluster and also make a general comparison with other bulge globular clusters analysed up to now.
4.1 Variability
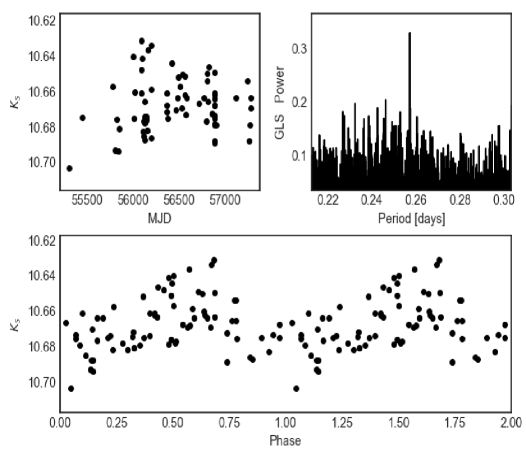
We have checked the variability of all our stars using the VVV survey data (Minniti et al. 2010; Saito et al. 2012), which gives us multicolor photometry in five bands: Z (0.87 um), Y(1.02 um), J (1.25 um), H (1.64 um) and Ks (2.14 um). The survey covers an area of 562 square degrees, with 196 tiles that cover the bulge and 152 covering the adjacent southern plane. NGC 6528 is located on tile b278 whose central coordinates are RA: 18:04:40.94 DEC: -30:13:18.5 (J2000). The VVV catalogue of aperture photometry for each epoch was obtained from the Cambridge Astronomical Survey Unit (CASU555http://apm49.ast.cam.ac.uk/). The catalogue have position, fluxes and flag which indicate the most probable morphological classification. In this last case, the flag ”-1”, which was chosen for this analysis, denote the best-quality photometry of stellar objects, other flags in the catalogue are ”0” (noise), ”-2” (borderline stellar), ”-7” (sources containing bad pixels), and ”-9” (saturated source).
In order to detect any periodic signals, we computed the Generalized Lomb Scargle (GLS) (Zechmeister & Kürster 2009) and Phase Dispersion Minimization (PDM) (Stellingwerf 1978) algorithms of each star using aperture photometry. As a result, we detected significant variability in star #5.
After this previous confirmation, we verified the variability in this star using PSF photometry. Because the time series contains multiple points for each epoch, we performed the average for epochs with a few seconds of separation. We obtained a total of 73 epoch in the Ks band from April 2010 to September 2015, in a range of 10.6311 ¡ Ks ¡ 10.7035 mag. We found a period of 0.25729 days, as shown in figure 5. The amplitude of the light curve was determined by the Fourier fit, yielding 0.05 mag.
We couldn’t identify the type of variable, since it is difficult to classify variability type, due to the few features showed in Ks bands (Catelan et al. 2013; Alonso-García et al. 2015).
4.2 Iron
We found a mean [Fe/H] value for all our sample of seven stars of [Fe/H]= dex. However, the scatter observed is =0.16, which is significantly larger than the total expected spread of only 0.05 dex and is thus not due to errors in the atmospheric parameters, which are small in comparison with the scatter (see table 4). However, it is important to note that our sample is small, only seven stars, and thus small sample statistics could be at fault. Moreover, one of the stars shows a very extreme metallicity compared to the others (star #5, see table 1). This star is indeed the variable candidate (see Figure 5 and section 4.1). It is quite possibile that the variability has affected the measurement of the iron abundance of this star in some way, causing a large offset with respect to the cluster mean. Another detailed spectroscopic analysis of this star is needed to investigate possible variability effects on the metallicity derivation. We note that, according to its radial velocity, position in the CMD and atmospheric parameters, this star is very likely a cluster member.
Nonetheless, if we remove star #5 from the sample, assuming that it is an outlier (presumably due to the variability), we obtain a metallicity average of [Fe/H]= dex and a scatter of 0.07, essentially what is expected from errors alone. Therefore, we need a larger sample to conclusively prove or disprove an intrinsic metallicity spread. We note that Mauro et al. (2014) found a mean of [Fe/H]=-0.180.14 dex with a spread of 0.20 dex using low resolution CaT spectra together with NIR photometry for a similar sample of stars (see table 2), and suggested a possible intrinsic variation. However, their uncertainties are larger than ours. Note that they found star #5 to have a metallicity virtually identical with their mean value.
Comparing our results with Saviane et al. (2012) we note that we have three stars in common (see table 2). Star #7 shows a significant difference between the two studies while the other two stars do not. If we use the metallicity scale of Dias et al. (2016a, b) for NGC 6528 the average is [Fe/H]=-0.130.07, in excellent agreement with our results.
Schiavon et al. (2017) found a metallicity of -0.19 dex in two stars. Origlia et al. (2005) measured the abundance of four stars using near infrared spectroscopy and found a mean metallicity of -0.17 dex. Zoccali et al. (2004) derived a value of -0.10 dex in three stars and Harris (1996, 2010 edition) quotes a metallicity of -0.11 dex for NGC 6528. Liu et al. (2017) found a metallicity of 0.04 dex with a scatter of 0.07 dex, their S/N is similar to ours. Moreover, we have three stars in common (see table 2), with good agreement for star #3 and #6. Again, their value for star #5 is not unusual compared to their other two stars. And Carretta et al. (2001) mesaured the metallicity in four RHB stars in NGC 6528, they found a metallicity of 0.07 dex with the total errors of 0.1 dex. In general, we conclude that our mean metallicity is in good agreement with previous results. Even if [Fe/H] for star #5 is lower than the mean, its [El./Fe] ratios agrees with the rest of the sample.
4.3 Iron-peak elements
The iron peak elements, although they have not been widely studied in bulge GCs, are very useful tools to better understand better their chemical evolution. They are produced mainly by SNe and massive stars, the most important polluters of the ISM.
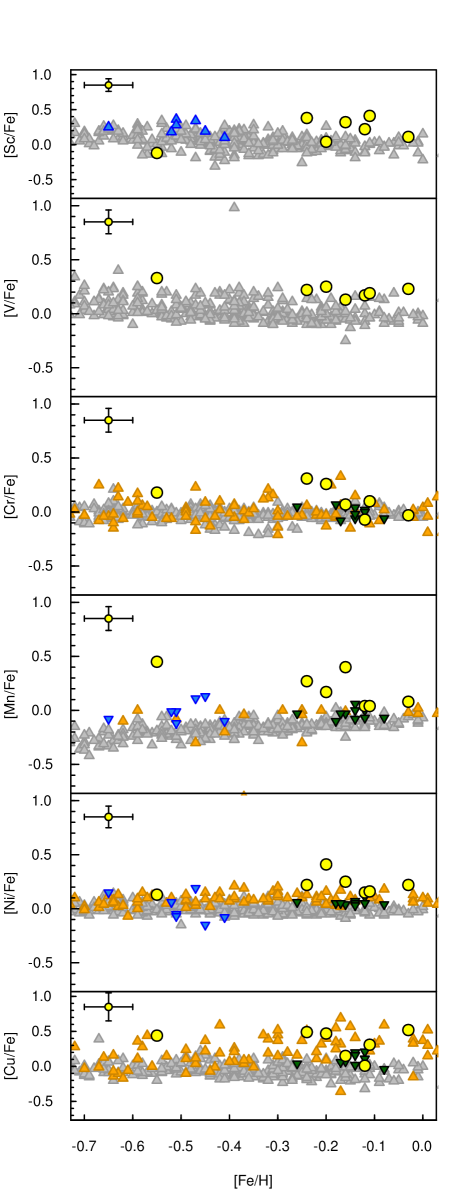
In this study, we have measured the abundance of six iron-peak elements: Fe, Sc, V, Cr, Mn and Ni (see table 3 and figure 6). We here analyze the other elements besides Fe.
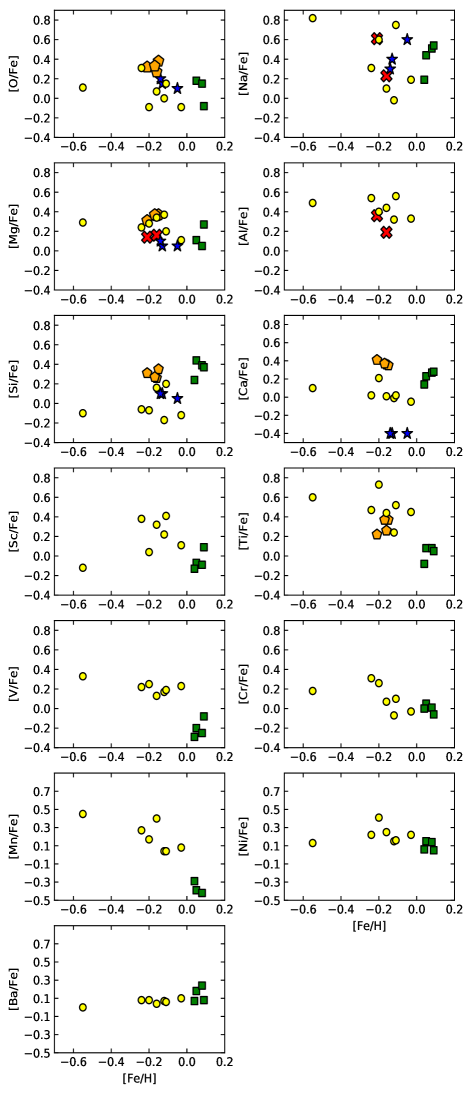
In figure 6 we plot iron-peak element abundance versus [Fe/H] comparing with two Bulge GCs: NGC 6553 (Tang et al. 2017) and with our previous study of NGC 6440 (Muñoz et al. 2017). We find for NGC 6528 a super-solar abundance for all the iron peak elements, although slightly more moderate for the case of V and Ni. In general, NGC 6528 shows good agreement with NGC 6553 (Tang et al. 2017) and with bulge field stars from Barbuy et al. (2013) and Johnson et al. (2014).
Although we do not have bulge field star measurements for Sc or V, we notice that NGC 6528 follow the Galactic disk field star trend but at higher abundance, which is typical behavior of bulge stars.
We found an overabundance in [Mn/Fe]=0.210.06 dex for NGC 6528 (see Figure 6). This overabundance of Mn is an indication of a formation site rich in Mn, which is mainly produced in SNeIa (Iwamoto et al. 1999; Kobayashi et al. 2006; Cescutti et al. 2008). Nickel shows in general very good agreement with the bulge field and with NGC 6553.
The nucleosynthetic origin of copper is not very clear (McWilliam & Smecker-Hane 2005). Some authors suggest SNeIa do not contribute significantly to Cu synthesis (Shetrone et al. 2003). Nevertheless, Matteucci et al. (1993) and Mishenina et al. (2002) indicate that SNeIa could be an important producer of copper. In the case of NGC 6528, we found a very good agreement with NGC 6553 and bulge field stars (See figure 6).
In summary, NGC 6528 shows good agreement with NGC 6553 for each element compared (Cr, Ni and Cu) and good agreement with bulge field stars as well. The super-solar value found for all iron-peak elements measured in this study could be an indication of a strong early pollution by SNe explosions, mainly SNeIa. However, the detailed origins of many of these elements remain unclear.
Carretta et al. (2001) derivated the abundances for the iron-peak elements (Sc, V, Cr, Mn, and Ni) in four RHB stars. Comparing it with our result, we found a significative difference. Although taking into account the errors in both studies, we can found compatibility between Sc, Cr, and Ni (see Figure 13).
Moreover, our finding show good compatibility with the result of Barbuy et al. (2016), they concluded that abundances of HP1 agree with enrichment by SNII at early epoch, our result show a good agreement with enrichment by SNIa, which happen later. These results are indication that NGC6528 is younger that HP1, which would be expected by its metallicity. In fact, the age measurement by Ortolani et al. (2011) for HP1 is 13 gyr and Lagioia et al. (2014) found a age of 11 gyr for NGC 6528.
4.4 elements
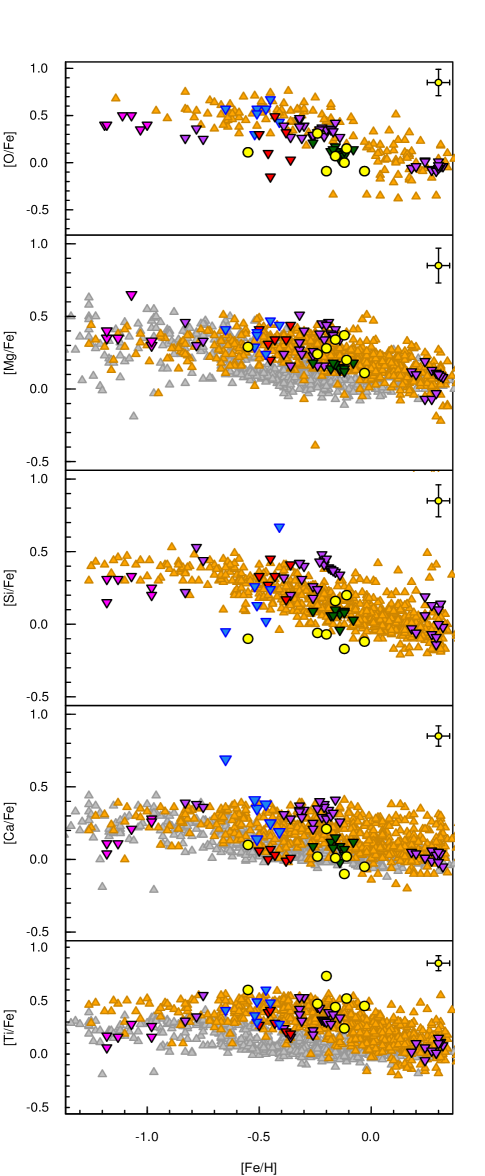
We measured five elements (O, Mg, Si, Ca and Ti). We found that the abundances for O, Si and Ca listed in Table 3 (see figure 7) are essentially solar. However, Mg and Ti are definitively enhanced (see table 3 and Figure 7). We use Mg, Si, Ca, and Ti to estimate a mean abundance. We obtain:
[/Fe]=
Origilia et al (2005) using NIR spectroscopy for four members of NGC 6528 found a value for [/Fe] +0.33 0.01, higher than our value. They obtain the abundances using the same elements used in this study (Mg, Si, Ca and Ti). Carretta et al. (2001) measured the alpha abundances in their sample of RHB star, and their values are higher than our, in particular in the case of Titanium, the other elements (Mg, Si, and Ca) are compatible considering the errors. Also, Zoccali et al. (2004) found a value [/Fe] +0.1, consistent with our results (see Figure 13).
It is interesting to note that NGC 6528 shows good agreement with the Bulge field stars with regard to elements. In the case of O, Si and Ca, the cluster follows the trend for the lower part of the field star distribution, while Mg is in the middle of this distribution and Ti in the upper envelope. This certainly is indicative of a similar origin (see section 5).
Notably, the typical elements that generally show a substantial spread among GCs, O and Mg, do not show evidence for an intrinsic variation in NGC 6528, very reminiscent of the behavior we found for the bulge GC NGC 6553.
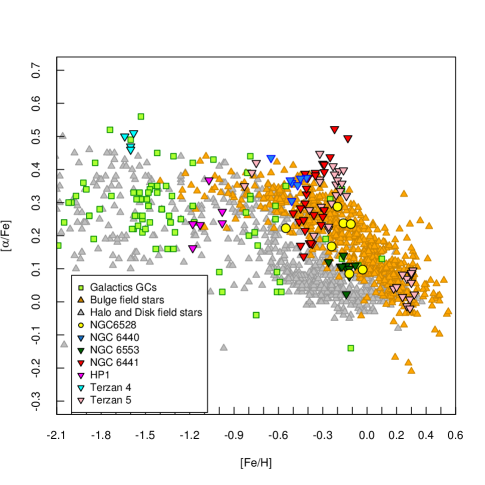
In general, we see that all the metal rich bulge GCs that we include in this study (NGC 6440, NGC 6441, Terzan 5, NGC 6553 and NGC 6528) show good agreement with the tendency of the bulge field stars (See Figures 7 and 8).
As mentioned in our work on NGC 6440 (Muñoz et al. 2017), the alpha elements in NGC 6528 also show a peculiar behavior. In the graph of [/Fe] versus [Fe/H], NGC 6528 is located at a higher metallicity than the so-called knee, which marks the change between a high rate of pollution of the -elements from SNeII to a pollution coming mainly from SNeIa with less production of alpha-elements. The patterns, which are observed in O, Si and Ca, would indicate that NGC 6528 was formed in an area mainly polluted by SNeIa. However, Mg and Ti remain at SNeII-enhanced levels despite the high metallicity of this GC. This argument is supported by Zoccali et al. (2004) for O, Ca and Mg, also by Carretta et al. (2001) for O and Mg, and by Schiavon et al. (2017) for the case of Mg. On the other hand, the argument is not well supported by Origlia et al. (2005) (see Figure 13). It is necessary take into account that for all the studies, including ours, the samples are small to be conclusive about it.
4.5 Na-O anticorrelation
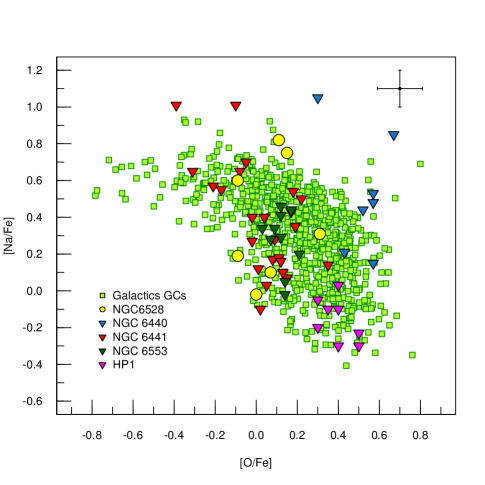
This is the most famous anticorrelation among GCs, the prime evidence associated with MPs in GCs (Carretta et al. 2009a, b; Gratton et al. 2012). However, note that at least one GC, Ruprecht 106, apparently does not show this anticorrelation, although it is likely an extragalactic GC (Villanova et al. 2013). According to the models (Ventura & D’Antona 2006), the GCs that show this anticorrelation form a first generation of stars followed by a second generation which is much more Na-rich and O-poor. The nature of the polluters and the details of the pollution process are currently hotly debated. We did not find an extended O-Na anticorrelation, especially in the case of Oxygen. Comparing the scatter in our measurement, we found a significant intrinsic spread in Na (=0.33) while in the case of the Oxygen (=0.14) is very similar to the expected observational errors (=0.09). This behavior is strange because commonly the Galactic GCs show a large spread in both Oxygen and Sodium.
Origlia et al. (2005) obtained the abundance of Oxygen for four giants, and the average is [O/Fe]=0.31 dex without significative dispersion. In spite of their value is higher than our, are consistent take into account the errors of both (see Figure 13). Carretta et al. (2001) found a mean of Oxygen of [O/Fe]=0.07 dex in three stars, in the case of Na, Carretta found a mean of [Na/Fe]=0.40 dex in four stars, their values are in excellent agreement with our findings (see Figure 13). Zoccali et al. (2004) measured the abundance of Oxygen for three RGB stars in NGC 6528. They found an average of [O/Fe]=0.15 dex with very low dispersion. In addition, they found a mean for [Na/Fe]=0.43 dex with a large dispersion. Although these results are only for three stars, their behavior is consistent with our results (see Figure 13). Finally, Schiavon et al. (2017) report the chemical abundances for Na in two stars with a value of 0.23 dex and 0.61 dex, despite that are only two stars reported, these are in concordance with our measurement for Na (see Figure 13).
When we study the Na-O anti-correlation for additional bulge GCs (see figure 9), we note that NGC 6528 (this study), NGC 6440, NGC 6553 and HP1 show a vertical O-Na trend, marked by a significant spread in Na, but not in Oxygen. In fact, the bulge GCs show a low intrinsic oxygen scatter, consistent with no true spread. We must bear in mind that the samples are in general small. Therefore, we need to check this behavior with a larger sample. If this trend holds, it would highlight a chemical evolution difference in the bulge GCs compared to typical halo GCs.
4.6 Mg-Al
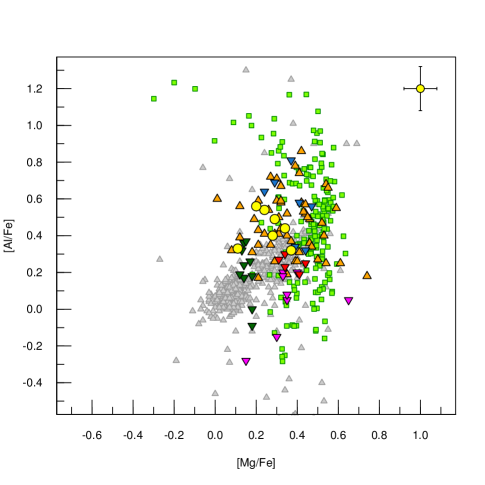
Carretta et al. (2009b) found a Mg-Al anticorrelation in a large sample of Galactic GCs. The Mg-Al chain plays an important role in this correlation, However, very high temperatures are necessary to achieve it. Aluminum shows a large spread in many Galactic GCs, particularly those with a metallicity lower than [Fe/H] = - 1.1 dex (Mészáros et al. 2015). Also, Pancino et al. (2017) verify that the Mg-Al anticorrelation extension depends on cluster mass and metallicity.
Carretta et al. (2001) measured the abundances of Magnesium in three RHB stars, the average obtained is [Mg/Fe]=0.14 dex. Origlia et al. (2005) obtained the abundances of Magnesium in four giants stars, the average obtained is [Mg/Fe]=0.35 dex. Zoccali et al. (2004) found a mean in Magnesium of [Mg/Fe]=0.07 dex, in three stars. Finally, Schiavon et al. (2017) reported the chemical abundances for Magnesium and Aluminum in two stars, the averages found by them are: [Mg/Fe]= 0.15 dex and [Al/Fe]=0.28 dex. These studies have small samples or in other cases have measurement only for Magnesium, in this context our results are compatible with these studies (see Figure 13).
We find no Mg-Al anticorrelation in NGC 6528 (see Figure 10). Indeed, we find no significant spread in Al (=0.10) or in Mg (=0.09), similar to the case for NGC 6553 and NGC 5927 (Mura-Guzmán et al. 2018), another metal-rich GC from the disk, but in contrast with NGC 6440, which does show a Mg-Al anticorrelation. From our study (Muñoz et al. 2017), this bulge globular cluster does not show a large extension in the Mg-Al anticorrelation, but it has a significant spread in Al (=0.18), unlike NGC 6528.
4.7 Neutron-Capture elements
Analyzing these elements helps us to understand better the processes involved in the creation of MPs in GCs. E.g., low-mass AGB stars produce mainly s-elements like Ba (Gallino et al. 1998; Straniero et al. 2006), and SNeII explosions are associated mainly with r-process element production.
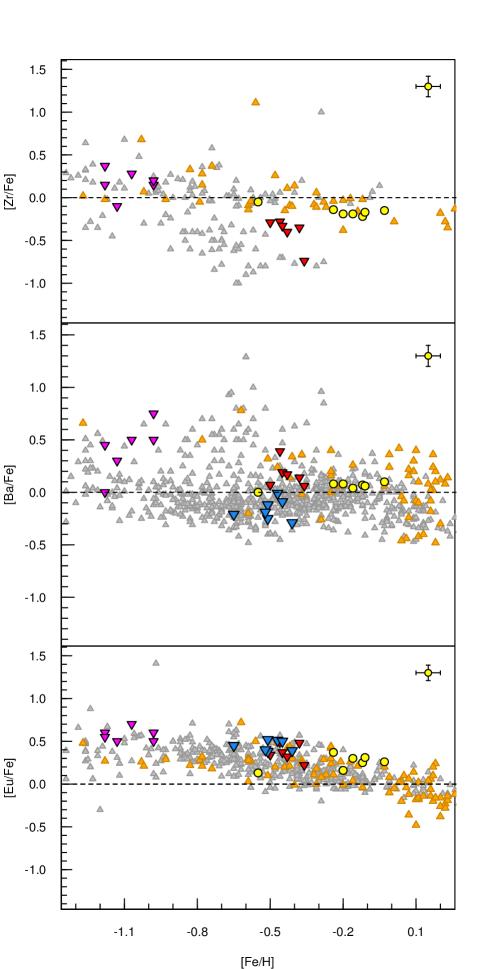
We measured three heavy elements: Zr, Ba and Eu. We find that the abundance of Ba for NGC 6528 is slightly super-solar ([Ba/Fe]=0.06 dex), showing a similar value to that of NGC 6441 (see Figure 11). Carretta et al. (2001) obtained the Ba abundances in four RHB stars in good agreement with our results (see Figure 13).
For [Eu/Fe], the bulge field stars show a decrease with [Fe/H]. The decrease is due to the production of iron by SNeIa (Ballero et al. 2007). In the case of Europium, we found a supersolar value ([Eu/Fe]=0.25), in very good agreement with the bulge field star trend and with other bulge GCs including NGC 6440 and NGC 6441 (see figure 11).
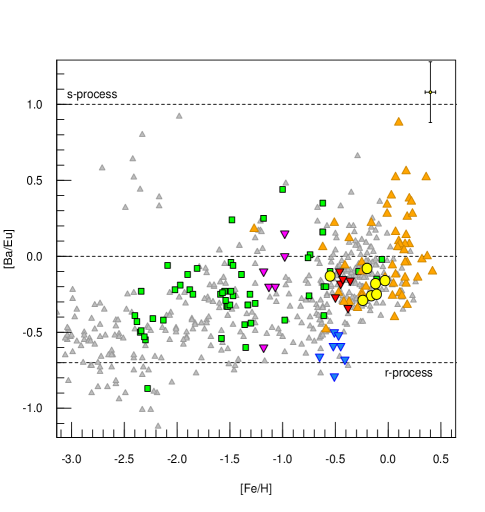
In Figure 12 we observe [Ba/Eu] versus [Fe/H] which allows us to establish the relative importance between s-process versus r-process. In the case of NGC 6528, we found a value of [Ba/Eu] subsolar, similar to the values shown by NGC 6441, which suggests that the heavy elements have been produced mainly by explosive events in SNeII. We also noticed very good agreement with the bulge (see figure 12).
Our results are compatible with the results found by Van der Swaelmen et al. (2016), which found a turnover in metallicity around [Fe/H] -0.6 dex, indicating an enrichment from SNe Ia. In this same context, Van der Swaelmen compared thick disk stars (Bensby et al. 2004) with a sample from bulge microlensed stars (Bensby et al. 2013), he found a small difference in the chemical enrichment between bulge and thick disk stars, apparently associated with a different SN II/SN Ia ratios along time.
The decreasing of Zr with the metallicity for the bulge field stars is evident in figure 11, this trend was detected by Johnson et al. (2012). Our sample of 7 stars of NGC 6528 shows good agreement with the pattern of Zr in this regime of metallicity. Also, we found that our sample is depleted in Zr ([Zr/Fe]=-0.16).
5 Conclusions
This is the second paper of a series of papers about metal rich bulge GCs. In this paper, we have presented a detailed chemical characterization of NGC 6528 from seven red giant members. Using VLT FLAMES/UVES high resolution spectra, we measured 18 chemical elements and we performed a detailed error analysis. This allowed us to make a robust comparison with our first study on NGC 6440 as well as with many other Milky Way objects (bulge field stars, disk field stars, halo field stars, Galactic GCs). The most important results of this study are summarized in the following:
-
•
We found a candidate variable star (star #5) in our sample. It turns out to be the most metal poor of the sample ([Fe/H]=-0.55 dex), which may be due to its variaability, but all its chemical patterns show good agreement with the other members of NGC 6528.
-
•
We obtained a mean iron abundance of [Fe/H]=-0.140.06 dex in good agreement with previous literature values. We did not find a significant spread in iron, although our sample is small (after deleting the one dubious outlier).
-
•
We measure five iron-peak elements. These show very good agreement with the bulge field stars trend, especially with the bulge GC NGC 6553.
-
•
The alpha-elements also show good agreement with bulge field stars and NGC 6553.
-
•
We did not find an extended O-Na anticorrelation. This relationship is more vertical, similar to other Bulge GCs, suggesting that only Na varies and O is fixed.
-
•
We have found no Mg-Al anticorrelation. Neither did we find a real spread in either Al or in Mg.
-
•
Heavy elements follow the trend of the bulge field stars and the bulge GCs.
-
•
Ba/Eu] versus [Fe/H] shows good agreement with NGC 6441. Moreover, it is dominated by r-process material.
-
•
The origin of NGC 6528 is undoubtedly similar to the Bulge of the Milky Way, and especially to that of the bulge GC NGC 6553.
In all of the chemical comparisons we have made, NGC 6528 exhibits very good agreement with the general bulge chemical patterns, with the only minor exception being Mn. This behavior, together with its metallicity, could be indicative of a strong original contamination by SN.
The alpha-elements in the bulge field stars is a good indicator about the origin, because exhibits an overabundance in these elements (McWilliam & Rich 1994; Zoccali et al. 2006). In agreement with high rate of star formation in a early epoch, probably in the first Gyr (Lagioia et al. 2014). Our discovery for NGC 6528 and for the majority of the bulge GCs analyzed in this study are compatible with this behavior.
Furthermore, we note that in the case of the O-Na anticorrelation, several of the Bulge GCs show only a Na variation without a significant O spread (Hp1, NGC 6440, NGC6528, NGC6553), again indicating a possible similar origin and evolution for these bulge GCs, and apparently different from that of Halo GCs. In particular, we highlight that for each chemical pattern in which we compared NGC 6528 with NGC 6553, we found very good agreement, indicating a similar evolution and origin.
According to Dinescu et al. (2003) the velocity of NGC 6528 is indication of a radial orbit confined to the galactic plane. Also, its rotation velocity show good agreement with the velocity predicted for the Milky Way bar (Dinescu et al. 2003).
NGC 6528 is an GC with a age of 11 Gyr (Lagioia et al. 2014) and one of the most metal rich galactic GC ([Fe/H]=0.14), all the pattern, chemically and dynamically, support the idea of NGC 6528 is a bulge GCs with the similar origin and evolution of the bulge of the Milky Way.
Finally, the most interesting of the above results are the lack of any Na-O or Mg-Al anticorrelation and the homogeneity of the O, Mg and Al abundances, although the sample size is limited. This trend is in general in good agreement with other Bulge GCs (NGC 6441, NGC 6553, NGC 6440). This could indicate a different evolution from that of the typical halo or disk GCs. As usual, additional studies, with much larger samples of clusters as well as stars per cluster, will be needed to clearly define and understand these trends.
Acknowledgements.
This work is Based on observations collected at the European Organisation for Astronomical Research in the Southern Hemisphere under ESO programme ID 093.D-0286. We gratefully acknowledge use of data from ESO Public Survey programme ID 172.B-2002 taken with the VISTA telescope. We gratefully acknowledge support from the Chilean BASAL Centro de Excelencia en Astrofísica y Tecnologías Afines (CATA). S.V. gratefully acknowledges the support provided by FONDECYT reg. n. 1170518. C.C.C. is supported by CONICYT (Chile) throught Programa Nacional de Becas de Doctorado 2014 (CONICYT-PCHA/Doctorado Nacional/2014-21141084).D.G. also acknowledges financial support from the Dirección de Investigación y Desarrollo de la Universidad de La Serena through the Programa de Incentivo a la Investigación de Académicos (PIA-DIDULS). We would also like to thank the referee for his valuable comments and corrections.References
- Alonso-García et al. (2015) Alonso-García, J., Dékány, I., Catelan, M., et al. 2015, AJ, 149, 99
- Barbuy et al. (2016) Barbuy, B., Cantelli, E., Vemado, A., et al. 2016, A&A, 591, A53
- Barbuy et al. (2013) Barbuy, B., Hill, V., Zoccali, M., et al. 2013, A&A, 559, A5
- Barklem et al. (2005) Barklem, P. S., Christlieb, N., Beers, T. C., et al. 2005, A&A, 439, 129
- Bensby et al. (2004) Bensby, T., Feltzing, S., & Lundström, I. 2004, A&A, 415, 155
- Bensby et al. (2013) Bensby, T., Yee, J. C., Feltzing, S., et al. 2013, A&A, 549, A147
- Blanton et al. (2017) Blanton, M. R., Bershady, M. A., Abolfathi, B., et al. 2017, AJ, 154, 28
- Carretta et al. (2009a) Carretta, E., Bragaglia, A., Gratton, R., & Lucatello, S. 2009a, A&A, 505, 139
- Carretta et al. (2010a) Carretta, E., Bragaglia, A., Gratton, R. G., et al. 2010a, ApJ, 714, L7
- Carretta et al. (2009b) Carretta, E., Bragaglia, A., Gratton, R. G., et al. 2009b, A&A, 505, 117
- Carretta et al. (2010b) Carretta, E., Bragaglia, A., Gratton, R. G., et al. 2010b, A&A, 516, A55
- Carretta et al. (2001) Carretta, E., Cohen, J. G., Gratton, R. G., & Behr, B. B. 2001, AJ, 122, 1469
- Catelan et al. (2013) Catelan, M., Minniti, D., Lucas, P. W., et al. 2013, ArXiv e-prints [arXiv:1310.1996]
- Cayrel et al. (2004) Cayrel, R., Depagne, E., Spite, M., et al. 2004, A&A, 416, 1117
- Cescutti et al. (2008) Cescutti, G., Matteucci, F., Lanfranchi, G. A., & McWilliam, A. 2008, A&A, 491, 401
- Cohen et al. (2017) Cohen, R. E., Moni Bidin, C., Mauro, F., Bonatto, C., & Geisler, D. 2017, MNRAS, 464, 1874
- Da Costa et al. (2009) Da Costa, G. S., Held, E. V., Saviane, I., & Gullieuszik, M. 2009, ApJ, 705, 1481
- D’Antona et al. (2002) D’Antona, F., Caloi, V., Montalbán, J., Ventura, P., & Gratton, R. 2002, A&A, 395, 69
- D’Antona et al. (2016) D’Antona, F., Vesperini, E., D’Ercole, A., et al. 2016, MNRAS, 458, 2122
- de Mink et al. (2010) de Mink, S. E., Pols, O. R., Langer, N., & Izzard, R. G. 2010, in IAU Symposium, Vol. 266, Star Clusters: Basic Galactic Building Blocks Throughout Time and Space, ed. R. de Grijs & J. R. D. Lépine, 169–174
- Decressin et al. (2007) Decressin, T., Meynet, G., Charbonnel, C., Prantzos, N., & Ekström, S. 2007, A&A, 464, 1029
- Dias et al. (2016a) Dias, B., Barbuy, B., Saviane, I., et al. 2016a, A&A, 590, A9
- Dias et al. (2015) Dias, B., Barbuy, B., Saviane, I., et al. 2015, A&A, 573, A13
- Dias et al. (2016b) Dias, B., Saviane, I., Barbuy, B., et al. 2016b, The Messenger, 165, 19
- Dinescu et al. (2003) Dinescu, D. I., Girard, T. M., van Altena, W. F., & López, C. E. 2003, AJ, 125, 1373
- Dotter et al. (2008) Dotter, A., Chaboyer, B., Jevremović, D., et al. 2008, ApJS, 178, 89
- François et al. (2007) François, P., Depagne, E., Hill, V., et al. 2007, A&A, 476, 935
- Fulbright (2000) Fulbright, J. P. 2000, AJ, 120, 1841
- Gilmore et al. (2012) Gilmore, G., Randich, S., Asplund, M., et al. 2012, The Messenger, 147, 25
- Gonzalez et al. (2012) Gonzalez, O. A., Rejkuba, M., Zoccali, M., et al. 2012, A&A, 543, A13
- Gratton et al. (2004) Gratton, R., Sneden, C., & Carretta, E. 2004, ARA&A, 42, 385
- Gratton et al. (2012) Gratton, R. G., Carretta, E., & Bragaglia, A. 2012, A&A Rev., 20, 50
- Gratton et al. (2007) Gratton, R. G., Lucatello, S., Bragaglia, A., et al. 2007, A&A, 464, 953
- Gratton et al. (2006) Gratton, R. G., Lucatello, S., Bragaglia, A., et al. 2006, A&A, 455, 271
- Harris (1996) Harris, W. E. 1996, AJ, 112, 1487
- Iwamoto et al. (1999) Iwamoto, K., Brachwitz, F., Nomoto, K., et al. 1999, ApJS, 125, 439
- Izzard et al. (2013) Izzard, R. G., de Mink, S. E., Pols, O. R., et al. 2013, Mem. Soc. Astron. Italiana, 84, 171
- Johnson et al. (2008) Johnson, C. I., Pilachowski, C. A., Simmerer, J., & Schwenk, D. 2008, ApJ, 681, 1505
- Johnson et al. (2012) Johnson, C. I., Rich, R. M., Kobayashi, C., & Fulbright, J. P. 2012, ApJ, 749, 175
- Johnson et al. (2014) Johnson, C. I., Rich, R. M., Kobayashi, C., Kunder, A., & Koch, A. 2014, AJ, 148, 67
- Kobayashi et al. (2006) Kobayashi, C., Umeda, H., Nomoto, K., Tominaga, N., & Ohkubo, T. 2006, ApJ, 653, 1145
- Krause et al. (2013) Krause, M., Charbonnel, C., Decressin, T., Meynet, G., & Prantzos, N. 2013, A&A, 552, A121
- Lagioia et al. (2014) Lagioia, E. P., Milone, A. P., Stetson, P. B., et al. 2014, ApJ, 782, 50
- Lecureur et al. (2007) Lecureur, A., Hill, V., Zoccali, M., et al. 2007, A&A, 465, 799
- Liu et al. (2017) Liu, C., Ruchti, G., Feltzing, S., & Primas, F. 2017, A&A, 601, A31
- Marino et al. (2011a) Marino, A. F., Milone, A. P., Piotto, G., et al. 2011a, ApJ, 731, 64
- Marino et al. (2011b) Marino, A. F., Sneden, C., Kraft, R. P., et al. 2011b, A&A, 532, A8
- Marino et al. (2008) Marino, A. F., Villanova, S., Piotto, G., et al. 2008, A&A, 490, 625
- Matteucci et al. (1993) Matteucci, F., Raiteri, C. M., Busson, M., Gallino, R., & Gratton, R. 1993, A&A, 272, 421
- Mauro et al. (2014) Mauro, F., Moni Bidin, C., Geisler, D., et al. 2014, A&A, 563, A76
- McWilliam & Rich (1994) McWilliam, A. & Rich, R. M. 1994, ApJS, 91, 749
- McWilliam & Smecker-Hane (2005) McWilliam, A. & Smecker-Hane, T. A. 2005, ApJ, 622, L29
- Mészáros et al. (2015) Mészáros, S., Martell, S. L., Shetrone, M., et al. 2015, AJ, 149, 153
- Minniti (1995) Minniti, D. 1995, AJ, 109, 1663
- Minniti et al. (2010) Minniti, D., Lucas, P. W., Emerson, J. P., et al. 2010, New A, 15, 433
- Mishenina et al. (2002) Mishenina, T. V., Kovtyukh, V. V., Soubiran, C., Travaglio, C., & Busso, M. 2002, A&A, 396, 189
- Momany et al. (2003) Momany, Y., Ortolani, S., Held, E. V., et al. 2003, A&A, 402, 607
- Muñoz et al. (2013) Muñoz, C., Geisler, D., & Villanova, S. 2013, MNRAS, 433, 2006
- Muñoz et al. (2017) Muñoz, C., Villanova, S., Geisler, D., et al. 2017, A&A, 605, A12
- Mucciarelli et al. (2015) Mucciarelli, A., Lapenna, E., Massari, D., Ferraro, F. R., & Lanzoni, B. 2015, ApJ, 801, 69
- Mura-Guzmán et al. (2018) Mura-Guzmán, A., Villanova, S., Muñoz, C., & Tang, B. 2018, MNRAS, 474, 4541
- Origlia et al. (2013) Origlia, L., Massari, D., Rich, R. M., et al. 2013, ApJ, 779, L5
- Origlia & Rich (2004) Origlia, L. & Rich, R. M. 2004, AJ, 127, 3422
- Origlia et al. (2011) Origlia, L., Rich, R. M., Ferraro, F. R., et al. 2011, ApJ, 726, L20
- Origlia et al. (2005) Origlia, L., Valenti, E., & Rich, R. M. 2005, MNRAS, 356, 1276
- Ortolani et al. (2011) Ortolani, S., Barbuy, B., Momany, Y., et al. 2011, ApJ, 737, 31
- Pancino et al. (2017) Pancino, E., Romano, D., Tang, B., et al. 2017, A&A, 601, A112
- Pritzl et al. (2005) Pritzl, B. J., Venn, K. A., & Irwin, M. 2005, AJ, 130, 2140
- Reddy et al. (2006) Reddy, B. E., Lambert, D. L., & Allende Prieto, C. 2006, MNRAS, 367, 1329
- Reddy et al. (2003) Reddy, B. E., Tomkin, J., Lambert, D. L., & Allende Prieto, C. 2003, MNRAS, 340, 304
- Saito et al. (2012) Saito, R. K., Minniti, D., Dias, B., et al. 2012, A&A, 544, A147
- Saviane et al. (2012) Saviane, I., da Costa, G. S., Held, E. V., et al. 2012, A&A, 540, A27
- Schiavon et al. (2017) Schiavon, R. P., Johnson, J. A., Frinchaboy, P. M., et al. 2017, MNRAS, 466, 1010
- Shetrone et al. (2003) Shetrone, M., Venn, K. A., Tolstoy, E., et al. 2003, AJ, 125, 684
- Simmerer et al. (2013) Simmerer, J., Ivans, I. I., Filler, D., et al. 2013, ApJ, 764, L7
- Sneden (1973) Sneden, C. 1973, ApJ, 184, 839
- Stellingwerf (1978) Stellingwerf, R. F. 1978, ApJ, 224, 953
- Tang et al. (2017) Tang, B., Cohen, R. E., Geisler, D., et al. 2017, MNRAS, 465, 19
- Van der Swaelmen et al. (2016) Van der Swaelmen, M., Barbuy, B., Hill, V., et al. 2016, A&A, 586, A1
- Venn et al. (2004) Venn, K. A., Irwin, M., Shetrone, M. D., et al. 2004, AJ, 128, 1177
- Ventura & D’Antona (2006) Ventura, P. & D’Antona, F. 2006, A&A, 457, 995
- Villanova et al. (2013) Villanova, S., Geisler, D., Carraro, G., Moni Bidin, C., & Muñoz, C. 2013, ApJ, 778, 186
- Zechmeister & Kürster (2009) Zechmeister, M. & Kürster, M. 2009, A&A, 496, 577
- Zoccali et al. (2004) Zoccali, M., Barbuy, B., Hill, V., et al. 2004, A&A, 423, 507
- Zoccali et al. (2006) Zoccali, M., Lecureur, A., Barbuy, B., et al. 2006, A&A, 457, L1