A long decay of X-ray flux and spectral evolution in the supersoft Active galactic nucleus GSN 069
Abstract
GSN 069 is an optically identified very low-mass AGN which shows supersoft X-ray emission. The source is known to exhibit huge X-ray outburst, with flux increased by more than a factor of compared to the quiescence state. We report its long-term evolution in the X-ray flux and spectral variations over a time-scale of decade, using both new and archival X-ray observations from the XMM-Newton and Swift . The new Swift observations detected the source in its lowest level of X-ray activity since outburst, a factor of 4 lower in the 0.2-2 keV flux than that obtained with the XMM-Newton observations nearly 8 years ago. Combining with the historical X-ray measurements, we find that the X-ray flux is decreasing slowly. There seemed to be spectral softening associated with the drop of X-ray flux. In addition, we find evidence for the presence of a weak, variable hard X-ray component, in addition to the dominant thermal blackbody emission reported before. The long decay of X-ray flux and spectral evolution, as well as the supersoft X-ray spectra, suggest that the source could be a tidal disruption event, though a highly variable AGN cannot be fully ruled out. Further continued X-ray monitoring would be required to test the TDE interpretation, through better determining the flux evolution in the decay phase.
Subject headings:
accretion, accretion disks — black hole physics — X-rays: individual (GSN 069) — X-rays: galaxies1. Introduction
The typical X-ray spectrum of Seyfert 1 galaxies consists of a hard power-law emission with an exponential cutoff at an energy above 100 keV (Nandra & Pounds 1994), plus a soft excess below 2 keV. It is believed that the hard powerlaw component is produced by the inverse Compton scattering of the seed photons from a cold accretion disk in a hot, optically thin corona (Sunyaev & Titarchuk 1980). The nature of soft excess emission is quite elusive to date. Although it usually can be fitted with a blackbody, the temperature appears to be roughly constant ( keV), and is much too high to be explained by the standard accretion disk model (Gierliński & Done 2004; Ai et al. 2011).
Recently, Terashima et al. (2012) reported the discovery of a remarkable supersoft AGN (J1231+1106), which completely lacks emission at energies 2keV. Its X-ray spectrum can be represented purely by a soft thermal component with a blackbody temperature of 0.13–0.15 keV, by analog with the accretion disk dominated spectrum typically seen in the high/soft state of X-ray binaries (XRBs). Note that similar supersoft emission was also reported in the AGN GSN 069 (Miniutti et al. 2013, M13), and RX J1302+2746 (Sun, Shu & Wang 2013, Sun13), but with a lower blackbody temperature roughly consistent with the disk model prediction. While ‘supersoft’ AGNs with the soft X-ray photon index have been initially identified with the ROSAT data (e.g., Boller et al. 2010), they are not as extreme in the X-rays as the AGNs we mentioned according to the apparent lack of hard X-rays above 2 keV. The discovery of this special class of AGNs is thus important to illuminate accretion physics in a poorly explored regime of parameter space (Ho et al. 2012; Shu et al. 2017).
While such supersoft X-ray spectra are rare among AGNs, they are more commonly seen in tidal disruption event (TDE, see Komossa 2015 for a review). Such an event occurs when a star approaches too close to a SMBH and is tidally disrupted (Rees 1988). Subsequently fall-back accretion can form a transient accretion disk whose thermal emission falls into the X-ray band for a BH mass M⊙, resulting in a supersoft X-ray spectrum. Indeed, two out of three known supersoft AGNs, J1231+1106 and GSN 069, display large amplitude X-ray variability by a factor of 15 to 240, respectively. This leads to a recent work to claim that J1231+1106 could be associated with a TDE, though its flux decay seems much slower than most other TDE candidates (Lin et al. 2017a). The nature of soft X-ray burst in GSN 069 is still poorly constrained. While observed large variability of more than a factor of 240, further one-year (2010-2011) Swift monitoring campaign did not find significant decay in the flux, which is inconsistent with typical TDEs.
In this Letter, we report the results from archival Swift and XMM observations of GSN 069 since 2011, which have not been analyzed before. In particular, we have obtained new Swift follow-up observations of the source at the end of 2017, revealing a significant decrease in the X-ray flux. Table 1 lists the details of all X-ray observations. In Section 2, we describe the observations and data reductions. In Section 3, we present detailed analysis and main results. Discussions on the source properties are given in Section 4.
2. Data analysis
| Instrument | Date | Flux† | Count rates | Refs. |
|---|---|---|---|---|
| ( cts/s) | ||||
| RASS | 1990 | (1) | ||
| ROSAT-PSPC | 1993-07-13 | (1) | ||
| ROSAT-PSPC | 1994-06-29 | (1) | ||
| XMM-PN | 2010-07-14 | 2.40.7 | (1) | |
| SWIFT-XRT | 2010-08-26 | 2.10.6 | 3.731.14 | (1) |
| SWIFT-XRT | 2010-08-27 | 2.10.3 | 3.420.41 | (1) |
| SWIFT-XRT | 2010-10-27 | 1.80.3 | 3.120.33 | (1) |
| SWIFT-XRT | 2010-11-24 | 1.60.3 | 2.780.31 | (1) |
| XMM-PN | 2010-12-02 | 2.030.03 | (1) | |
| SWIFT-XRT | 2010-12-22 | 1.40.3 | 2.300.27 | (1) |
| SWIFT-XRT | 2011-01-19 | 1.40.3 | 2.120.27 | (1) |
| SWIFT-XRT | 2011-02-16 | 1.50.3 | 2.510.30 | (1) |
| SWIFT-XRT | 2011-04-25 | 1.40.3 | 2.560.25 | (1) |
| SWIFT-XRT | 2011-05-23 | 1.70.3 | 3.090.27 | (1) |
| SWIFT-XRT | 2011-06-20 | 1.80.3 | 3.030.28 | (1) |
| SWIFT-XRT | 2011-07-17 | 1.40.3 | 2.410.22 | (1) |
| SWIFT-XRT | 2011-08-15 | 2.00.3 | 3.590.36 | (1) |
| SWIFT-XRT | 2011-08-18 | 1.90.3 | 3.260.62 | (1) |
| SWIFT-XRT | 2013-09-22 | 0.840.3 | 1.740.24 | (2) |
| SWIFT-XRT | 2013-09-29 | 0.740.3 | 1.280.22 | (2) |
| XMM-PN | 2014-12-05 | 1.30.01 | (2) | |
| SWIFT-XRT | 2017-12-09 | 0.570.3 | 0.610.20 | (2) |
| SWIFT-XRT | 2017-12-19 | 0.690.3 | 0.980.26 | (2) |
| SWIFT-XRT | 2017-12-25 | 0.610.3 | 0.670.19 | (2) |
Note– † The 0.2–2 keV flux in units of . References: (1) M13; (2) this work.
2.1. XMM observations
XMM-Newton pointed observations of GSN 069 were performed twice on 2010 and 2014 (hereafter XMM 2010 and XMM 2014). While the XMM 2010 data have been presented by M13, here we re-analyzed the spectra in detail in the context of the long-term evolution of the X-ray flux. The XMM-Newton data were reprocessed with the Science Analysis Software version 16.0.0, using the calibration files as of 2016 December. The epochs of high background events were examined and excluded using the light curves in the energy band above 12 keV. We used principally the PN data, which have much higher sensitivity, using the MOS data only to check for consistency when needed. We extracted the source spectra using a circular region with a radius of 40′′ centered at the source position. Background spectra were made from source-free areas on the same chip using four circular regions identical to the source region. We grouped the spectra to have at least 20 counts in each bin so as to adopt the statistic for the spectral fits. The following spectral fittings are performed in the 0.3-8 keV range using XSPEC version 12. All statistical errors given hereafter correspond to 90% confidence for one interesting parameter (), unless stated otherwise.
2.2. Swift observations
Totally 16 archival Swift observations of GSN 069 are available, among which 13 are made between 2010 March and 2011 July, and 2 on 2013 September. Some results from the Swift 2010-2011 observations have been presented in M13, while the 2013 data have not been reported yet. In addition, at our request, we have obtained 3 Swift follow-up observations on 2017 December. All Swift observations were reduced with FTOOLS 6.19 and updated calibration files (released on 2017 November 13). The X-ray telescope (XRT; Burrows et al. 2005) was operated in Photon Counting mode. We reprocessed the event files with the task xrtpipeline (version 0.13.2). The source was weakly detected in all observations, with a count rate in the range cts/s in 0.2–2 keV (Table 1). Source spectrum was extracted using a source region of radius 20′′ . The background was estimated in an annulus region centered on the source position, with an inner radius of 30′′ and outer radius of 50′′ . Due to the low counts, we grouped the data to have at least 1–5 counts in each bin and adopt mainly the -statistic for the Swift spectral fittings.
| Model component | Parameter | XMM-Newton | XMM-Newton | Swift | Swift | Swift |
| (2010) | (2014) | (2010-2011) | (2013) | (2017) | ||
| Blackbody | (eV) | 593 | 491 | 545 | 45 | 43 |
| Power-law | 0.43(fixed) | 1.67(fixed) | ||||
| Neutral absorber | NH (cm-2) | 44.2 | 40 | |||
| Ionised absorber | NH (cm-2) | 2.3 | 3.0 | |||
| log (erg cm s-1) | 0.3 | 0.08 | ||||
| F(0.2-2)keV | Absorbed (erg cm-2 s-1 ) | |||||
| F(2-10)keV | Absorbed (erg cm-2 s-1 ) | |||||
| Statistics | 70.9/65 | 98.1/93 | 25.6/37 | 20.4/14a | 43.6/57a |
Note– a -statistic is used due to low counts.
3. Result
3.1. X-ray spectral analysis
Despite the factor of increase in flux between the ROSAT observation and the XMM-Newton observation that first discovered the source in the X-rays on 2010, a 1 year monitoring campaign of GSN 069 with Swift beginning in 2010 August revealed no significant flux variations by a factor of (M13). Here, we present a detailed and uniform analysis of all the archival X-ray observations, especially for those that are not given in M13. In addition, we present the new results from the most recent Swift follow-up observations, with the aim to further investigate the evolution in the X-ray flux and/or the spectral changes on longer time-scale.
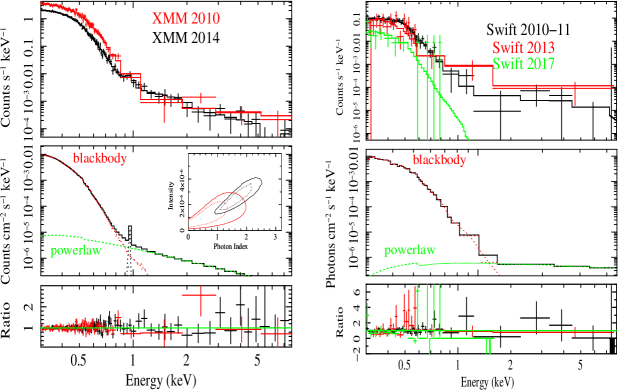
Considering the very soft spectra known for the source, as a first step, we fitted a pure thermal blackbody model (zbbody in XSPEC) to the XMM2014 spectrum, which has the best spectral quality thanks to its long exposure. The model gives very poor description to the spectrum, with a /dof=228.3/101. The spectral ratio shows that there is a considerable excess of flux at the high energies above 2 keV. The net count rate in the 2–8 keV band is cts/s, corresponding to 5420 background subtracted counts. Such an excess is likely due to the underlying hard power-law component, which is commonly seen in the X-ray spectrum of nearby Seyfert 1 galaxies (e.g., Bianchi et al. 2009). The fit by adding a power-law model is much better, with /dof=149.4/99 and a best-fit photon index . Note that there is still curvature in the spectrum between 0.6 and 1 keV, which can be attributed to the warm absorbing gas along the line of sight. We therefore included a warm absorber model zxipcf (Reeves et al. 2008), and obtained a significantly improved fit with /dof=104.3/95, i.e., a decrease in of 45.1 for four more extra free parameters. The warm absorber has a column density cm-2 and ionization parameter log erg cm s-1. The photon index now becomes flatter, with . Our final model also includes a Gaussian line to take into account the excess emission at keV. Since the line is unresolved, we fixed its width at a value of 5 eV (much less than the PN spectral resolution), and obtained a best-fit energy of keV. Although the residuals vanish, the overall value of is reduced by only 5.9 for the addition of two free parameters, suggesting that the feature is not statistically significant. If it were real, the line would be due to NeX Ly emission line which has a rest-frame energy of 1.022 keV, which can be verified with other data.
In order to obtain constrains on the spectral evolution for GSN 069, we also performed such an analysis on the XMM-Newton spectrum taken on 2010. We used the same baseline model as that used to fit the XMM2014 data. A comparison of the X-ray spectrum between the two XMM-Newton observations is shown in Figure 1(left), and the spectral fitting results are shown in Table 2. Within the statistical errors, the parameters for the ionised absorber are consistent among the two data sets. The power-law slope appears to be flatter in comparison with the XMM2014 data, but still marginally consistent with each other within 90% uncertainty (see the inset panel in Figure 1) due to poor statistics. In addition, the thermal temperature for the blackbody component is higher. Note that the fitting results for the XMM2010 spectrum are formally consistent with that reported in M13, except for the hard X-ray emission for which only upper limits could be obtained.
We now performed similar analysis on the historical 2010 and 2013 Swift spectra, as well as the 2017 Swift spectra we obtained. Unfortunately, the spectral signal-to-noise (S/N) ratios for most of the individual Swift spectra are not sufficient to perform meaningful fits. Thus, in order to obtain a spectrum with better S/N ratio, we combined the spectra from individual observations using the FTOOLS task addascaspec. Since the source flux is likely changed during the epoch 2010-2017, we added spectral files separately from the 13 Swift observations obtained from a 1 year monitoring campaign between 2010-2011 (Swift 2011), 2 observations taken on 2013 (Swift 2013), and 3 observations taken on 2017 (Swift 2017). We obtained 82030, 487 and 235 net counts in the 0.3-8 keV for the Swift 2011, 2013 and 2017, respectively. The spectra appear very soft, with most of the counts below 0.7 keV. For the Swift 2011 and 2013 observations, we also detected and net counts at energies above 1.5 keV, but they are too low to be used to constrain the hard X-ray power-law index effectively. We therefore fixed the corresponding parameters to that measured from the closest XMM-Newton observations. As might be expected, the ionised absorber could not be well constrained due to the poor S/N ratio of the Swift data, so it was not included in the fits. As for the XMM-Newton observations, we present in Figure 1 (right) a comparison of the Swift spectrum between the three epochs. All of the spectral fitting results for the Swift data are shown in Table 2.
3.2. The long-term flux variability
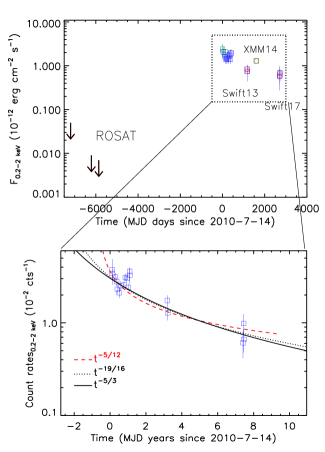
Figure 2 (upper panel) plots the long-term evolution of the observed X-ray flux of GSN 069 in the 0.2-2 keV. Since we are investigating the variability behaviour on longer time-scale, the upper limits from the earlier ROSAT observations are also included, building a light curve with a time span of more than two decades. It is evident that the source flux appears to decay slowly with time since the outburst. The 0.2-2 keV X-ray flux had decreased to a historical low state level in the recent Swift 2017 observation, by a factor of 4 lower than the brightest flux found in the XMM2010 observation. While a weak re-brightening during the decay period is recorded in the XMM2014 data, the flux in fact has dropped by a factor of in comparison with the XMM2010 observation .
In order to study the variability behavior in a relatively model independent way, we replaced the flux with count rates but for all historical Swift observations only. The lower panel of Figure 2 shows the long-term evolution of the Swift count rates in the 0.2–2 keV, which displays a similar slow decay, by a factor of a few over decade in time. Such an evolution of the X-ray flux depends on many factors, and cannot trivially be explained without knowing the details of the accretion process. We attempted to explore the fiducial model assuming a power-law decline, i.e., , which has been commonly used to fit the lightcurve of TDEs. It should be noted that given the low effective area of Swift below 0.3 keV and extremely soft X-ray spectrum for the source, the true uncertainty in the light curve fit is larger than that implied by using count rate as a proxy for the flux, which may be affected by the choice of energy band, absorbing column density and intrinsic spectral shape of the source (e.g., blackbody temperature) and its variability.
While the decay law represents the typical evolution trend for many thermal TDEs, it has been suggested that the actual luminosity evolution may depend on many factors such as the structure of the disrupted star, and the fraction of fallback materials is directly translated into an accretion luminosity (e.g., Lodato et al. 2015). When the luminosity is dominated by the accretion of the fallback material, Lodato & Rossi (2011) have shown that at late times the optical/UV lightcurves are proportional to , and thus substantially flatter than the behaviour. Strubbe & Quataert (2009) showed that the emission at early times can contain some contribution from a radiatively driven wind or outflow, leading to a decline. In addition, by assuming a viscous disk accretion (viscous timescale is much longer than the fallback one), Cannizzo et al. (1990) calculated that the evolution of luminosity follows a powerlaw with index of . Based on simple powerlaw model fits, Auchettl et al. (2017) found that the evolution of X-ray emission for a large sample of TDEs appears to follow either the commonly used accretion, or the more shallower decline law of .
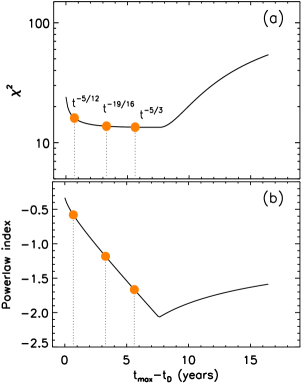
It is important to note that the current data cannot tightly constrain the value of the decay index, since the actual TDE time, , is largely unknown. Therefore we fitted the count rate lightcurve by assuming various before the initial outburst, namely, between 2010-07-14 () where the highest X-ray flux was observed for the source and 1994-06-29 when the last ROSAT observation was performed. We created a grid of in time bin of 50 days between the above time interval, and performed the powerlaw fits at each , while allowing the normalisation and the powerlaw index to be free parameters. In the fits, we also set constrain on the peak X-ray luminosity to be less than erg/s, which has been observed for most TDEs discovered so far (e.g., Komossa et al. 2015). This is approximately the Eddington luminosity for GSN 069 for a BH mass of M⊙(M13).
Figure 3 (a) and (b) shows the values and powerlaw indices from best-fits as a function of (in units of years referred to 2010-07-14, ), respectively. As one would expect, the and powerlaw decay index are poorly constrained, and no significant difference in the statistics is found in a wide range within 1–10 years before . Specifically, the difference in the is only 2.58 (at a % level) between the canonical and the more shallower decline. The corresponding TDE time for both cases is, however, very different, which is 0.68 year and 5.6 years before the peak of the luminosity seen by XMM, respectively. Although current data can not constrain models well because of the degeneracy between the and powerlaw index, it is likely that the source will continue to decline in flux (Figure 2, lower panel). Thus future sensitive X-ray observations with higher S/N are required to track its flux and provide further observational constraints on the decay curve.
3.3. Investigating the spectral variations
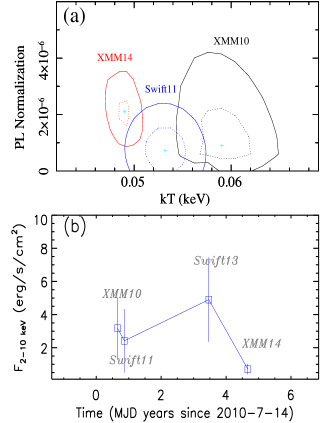
We confirmed the supersoft X-ray spectra of GSN 069 which are evident in the XMM and Swift 2011 observations with sufficient counts. These spectra can be roughly described with a thermal disk dominant emission of blackbody temperature eV plus a weak powerlaw component. It is important to note that the source X-ray spectrum in the XMM2014 observation was getting softer when compared with the XMM2010 observation (Figure 1). Using the best-fitting results with the bbody+powerlaw model (Table 2), we find that not only the blackbody temperature decreases in the XMM2014 data, the power-law index used to describe the hard X-ray emission appears to be steeper, albeit with large errors for the latter. Similar spectral softening is observed by comparing the Swift 2011 with 2013 data as well. The large uncertainty in temperature makes it difficult to conclude whether the Swift 2013 spectrum is softer than that in the XMM2014 observation, where the source is a factor of 2 higher in flux. Using the best-fitting model, we constructed two-parameter, joint confidence contours of the blackbody temperature versus the power-law intensity (at 1 keV) for the Swift 2011, XMM2010 and XMM2014 data, which are shown in Figure 4 (a). It can be seen that the 99% confidence contours for the XMM2010 and XMM2014 data are mutually exclusive, indicating variability of the blackbody component. In the Swift 2011 and XMM2010 data the power-law intensity is marginal, and at 99% confidence could be zero, but values of up to photons cm-2 keV-1 s-1 are not ruled out. Figure 4 (b) shows the time evolution of hard X-ray flux in the 2-10 keV. Although it represents only a minor fraction of the X-ray luminosity (%) and the errors are large, we found tentative evidence that the hard X-ray flux is declining.
4. Discussion and Conclusion
It was established previously that the optical spectrum of GSN 069 is that of type II AGN (M13). This may suggest that the X-ray outburst could be attributed to the AGN activity. However, variability of more than a factor of 240 is extremely rare among AGNs. In particular, few AGN is known to show X-ray spectra as soft as GSN 069 at energies below 1.5 keV (Terashima et al. 2012; Lin et al. 2013; Sun13). M13 interpreted the large X-ray variability as transition from a radiatively inefficient state to a disk dominant thermal state, which is commonly observed in the XRB systems when the accretion rate is high. However, such a supersoft state would last more than years in AGNs if the analogy with XRBs applied. This is at odds with our finding of the slow decay in the source flux within decade. The radiation-pressure instability in the AGN accretion disk seems also unable to explain the X-ray burst in GSN 069. The model predicts a slow-rise and fast-decay light curve, i.e., the duration during the flux rising phase is much longer than that in the decay phase (e.g., Czerny et al. 2009). In addition, the outburst due to the radiation-pressure instability is expected to last years for a black hole of mass M⊙. All these characteristics seem to contradict to what is observed for the source. The outburst may be alternatively explained by a thermal-viscous instability in the accretion disk, as proposed for the low-luminosity AGN NGC 3599 (Saxton et al. 2015) and IC 3599 (Grupe et al. 2015). In this model the flares will repeat on the viscous timescale of few decades. Future long-term monitoring observations will enable to test this mechanism.
Although we cannot completely rule out that the large amplitude variability is caused by a highly variable AGN in GSN 069, it could be most likely associated with a TDE, in light of the slow flux decay, supersoft X-ray spectrum and its changes with flux. Theoretical works and simulations have suggested that the expected TDE rate in AGNs is much higher than the quiescent galaxy (Karas & Subr 2007; Kennedy et al. 2016). However, only a few flares/outbursts in AGNs have been considered as TDEs. In fact, the likely TDE candidate ASASSN14li has been detected in radio before the flare, which suggests the presence of pre-existing AGN activity. More recently, the transient PS16dtm was interpreted as a TDE in the highly accreting Narrow Line Seyfert 1 Galaxy (Blanchard et al. 2017). One major difference between GSN 069 and other TDE candidates is its slow evolution in flux. The duration of most TDEs observed is short, whose flux decreases by an order of magnitude within months to a few years (Komossa 2015). On the contrary, the X-ray flux for GSN 069 dropped by only a factor of 2–4 in 8 years (2010-2017) after it was detected as an X-ray outburst. The evolution at a relatively later time for GSN 069 may explain the difference. We attempted to model the light curve with a decline law, and found acceptable fits for a broad range of decay index between -0.5 and -2.0 (Figure 3). The value of the decay index cannot be tightly constrained with current data, as it depends strongly on the TDE time, , which is poorly known. A decay index of would yield a , which is 5.6 years before the peak of the luminosity seen by XMM. Later occurring time for TDE, shallower decay index is expected.
Regardless of the actual TDE time, the slow decay in the X-ray emission and spectral variability make GSN 069 somewhat similar to the long-lived TDE candidate 3XMM J150052.0+015452 (J1500+0154), which showed little decay of the X-ray flux over few tens years since outburst (Lin et al. 2017b). While tentative spectral softening has been observed in GSN 069 when the X-ray flux is lower, J1500+0154 displayed more clear evidence of dramatic spectral softening from quasi-soft (0.3 keV) to super-soft (0.13 keV) state (Lin et al. 2017b). Yet no sign of persistent nuclear activity is seen in the optical emission lines of the host galaxy for J1500+0154. Meanwhile, the large decay of X-ray flux has also been reported in the type II AGN 2XMM J1231+1106 (Lin et al. 2017a), which has similar supersoft X-ray spectrum as GSN 069, indicating the long-lasting TDE maybe relevant to supersoft AGNs.
It is important to note that weak hard X-ray emission was detected in GSN 069, which is most evident in the long XMM-Newton observation performed in 2014. In addition, we found tentative evidence of the hard X-ray flux decreasing with time, the nature of which is unknown. Such a hard X-ray component is rarely seen in TDEs (e.g., Komossa 2015; Saxton et al. 2017), but could be associated with the pre-existing AGN activity that has been inferred form the optical spectrum for the source. If related to the coronal X-ray emission commonly seen in AGNs, the strength of the hard X-ray emission before the flare can be roughly estimated from the [O iii]5007 luminosity (e.g. Lamastra et al. 2009). GSN 069 has a [O iii]5007 luminosity of from the 6dF spectrum (Saxton et al. 2011), which implies a 2–10 keV luminosity of (the dispersion is 0.63 dex). This is a factor of five higher than that highest flux measured with XMM-Newton 2010 data, indicating a difference in the hard X-ray flux before and after the flare.
It is possible that the accretion of stellar debris from TDE interacts with the pre-existing corona from which the hard X-rays originate, causing a change in the structure and scattering optical depth in the X-ray emitting region. This may explain both the spectral and flux variations of the hard powerlaw component in this object. Similar scenario has been proposed to explain the X-ray flux drop in the transient PS16dtm, as being due to the obscuration of the pre-existing AGN corona by the stellar debris from TDE (Blanchard et al. 2017). However, since the hard X-ray spectra are still poor for most of observations due to few counts detected, it is not yet completely clear whether the hard X-ray emission in GSN 069 is produced in pre-existing AGN, a new-formed corona associated with TDE, or jet. We have obtained observing time from JVLA which will provide new insight into the origin of the hard X-ray emission through the detection of jet-like radio emission or not.
References
- Ai et al. (2011) Ai, Y. L., Yuan, W., Zhou, H. Y., Wang, T. G., & Zhang, S. H. 2011, ApJ, 727, 31
- Auchettl et al. (2017) Auchettl, K., Guillochon, J., & Ramirez-Ruiz, E. 2017, ApJ, 838, 149
- Bianchi et al. (2009) Bianchi, S., Guainazzi, M., Matt, G., Fonseca Bonilla, N., & Ponti, G. 2009, A&A, 495, 421
- Blanchard et al. (2017) Blanchard, P. K., Nicholl, M., Berger, E., et al. 2017, ApJ, 843, 106
- Boller (2010) Boller, T. 2010, Astronomische Nachrichten, 331, 235
- Burrows et al. (2005) Burrows, D. N., Hill, J. E., Nousek, J. A., et al. 2005, Space Sci. Rev., 120, 165
- Cannizzo et al. (1990) Cannizzo, J. K., Lee, H. M., & Goodman, J. 1990, ApJ, 351, 38
- Czerny et al. (2009) Czerny, B., Siemiginowska, A., Janiuk, A., Nikiel-Wroczyński, B., & Stawarz, Ł. 2009, ApJ, 698, 840
- Gierliński & Done (2004) Gierliński, M., & Done, C. 2004, MNRAS, 349, L7
- Grupe et al. (2015) Grupe, D., Komossa, S., & Saxton, R. 2015, ApJ, 803, L28
- Ho et al. (2012) Ho, L. C., Kim, M., & Terashima, Y. 2012, ApJ, 759, L16
- Karas & Šubr (2007) Karas, V., & Šubr, L. 2007, A&A, 470, 11
- Komossa (2015) Komossa, S. 2015, Journal of High Energy Astrophysics, 7, 148
- Kennedy et al. (2016) Kennedy, G. F., Meiron, Y., Shukirgaliyev, B., et al. 2016, MNRAS, 460, 240
- Lamastra et al. (2009) Lamastra, A., Bianchi, S., Matt, G., et al. 2009, A&A, 504, 73
- Lodato & Rossi (2011) Lodato, G., & Rossi, E. M. 2011, MNRAS, 410, 359
- Lodato et al. (2015) Lodato, G., Franchini, A., Bonnerot, C., & Rossi, E. M. 2015, Journal of High Energy Astrophysics, 7, 158
- Lin et al. (2013) Lin, D., Irwin, J. A., Godet, O., Webb, N. A., & Barret, D. 2013, ApJ, 776, L10
- Lin et al. (2017) Lin, D., Godet, O., Ho, L. C., et al. 2017a, MNRAS, 468, 783
- Lin et al. (2017) Lin, D., Guillochon, J., Komossa, S., et al. 2017b, Nature Astronomy, 1, 0033
- Miniutti et al. (2013) Miniutti, G., Saxton, R. D., Rodríguez-Pascual, P. M., et al. 2013, MNRAS, 433, 1764 (M13)
- Nandra & Pounds (1994) Nandra, K., & Pounds, K. A. 1994, MNRAS, 268, 405
- Rees (1988) Rees, M. J. 1988, Nature, 333, 523
- Reeves et al. (2008) Reeves, J., Done, C., Pounds, K., et al. 2008, MNRAS, 385, L108
- Saxton et al. (2011) Saxton, R., Read, A., Esquej, P., Miniutti, G., & Alvarez, E. 2011, arXiv:1106.3507
- Saxton et al. (2015) Saxton, R. D., Motta, S. E., Komossa, S., & Read, A. M. 2015, MNRAS, 454, 2798
- Sun et al. (2013) Sun, L., Shu, X., & Wang, T. 2013, ApJ, 768, 167 (Sun13)
- Shu et al. (2017) Shu, X. W., Wang, T. G., Jiang, N., et al. 2017, ApJ, 837, 3
- Sunyaev & Titarchuk (1980) Sunyaev, R. A., & Titarchuk, L. G. 1980, A&A, 86, 121
- Strubbe & Quataert (2009) Strubbe, L. E., & Quataert, E. 2009, MNRAS, 400, 2070
- Terashima et al. (2012) Terashima, Y., Kamizasa, N., Awaki, H., Kubota, A., & Ueda, Y. 2012, ApJ, 752, 154