11email: xwshu@mail.ahnu.edu.cn 22institutetext: CAS Key Laboratory for Researches in Galaxies and Cosmology, Department of Astronomy, University of Science and Technology of China, Hefei, Anhui 230026, China 33institutetext: School of Astronomy and Space Science, University of Science and Technology of China, Hefei 230026, China 44institutetext: Max Planck Institute for Astronomy, Königstuhl 17, D-69117 Heidelberg, Germany 55institutetext: Laboratoire AIM-Paris-Saclay, CEA/DSM/Irfu - CNRS - Université Paris Diderot, CEA-Saclay, F-91191 Gif-sur-Yvette, France 66institutetext: Institute of Astronomy, The University of Tokyo, 2-21-1 Osawa, Mitaka, Tokyo 181-0015, Japan 77institutetext: Yunnan Observatories, Chinese Academy of Sciences, Kunming, 650011, China 88institutetext: Academia Sinica Institute of Astronomy and Astrophysics, PO Box 23-141, Taipei 10617, Taiwan 99institutetext: Max-Planck-Institut für extraterrestrische Physik, Giessenbachstrasse 1, D-85748 Garching bei München, Germany 1010institutetext: Purple Mountain Observatory, Chinese Academy of Sciences, Nanjing, 210008, China 1111institutetext: The Australian National University, Mt Stromlo Observatory, Cotter Rd, Weston Creek, ACT 2611, Australia
A unique distant submillimeter galaxy with an X-ray-obscured radio-luminous active galactic nucleus
Abstract
Aims. We present a multiwavelength study of an atypical submillimeter galaxy, GH500.30, in the GOODS-North field, with the aim to understand its physical properties of stellar and dust emission, as well as the central active galactic nucleus (AGN) activity. Although it is shown that the source is likely an extremely dusty galaxy at high redshift, its exact position of submillimeter emission is unknown.
Methods. We use NOEMA observation at 1.2 mm with subarcsecond resolution to resolve the dust emission, and precisely localize the counterparts at other wavelengths, which allows us to better constrain its stellar and dust spectral energy distribution (SED) as well as redshift. We carry out the new near-infrared (NIR) photometry of GH500.30 observed with HST, and perform panchromatic SED modelling from ultraviolet (UV)/optical to submillimeter. We derive the photometric redshift using both NIR and far-infrared (FIR) SED modeling, and place constraints on the stellar and dust properties such as stellar mass, age, dust attenuation, IR luminosity, and star-formation rate (SFR). The AGN properties are inferred from the X-ray spectral analysis and radio observations, and its contribution to the total IR luminosity is estimated from the broadband SED fittings using MAGPHYS.
Results. With the new NOEMA interferometric imaging, we confirm that the source is a unique dusty galaxy. It has no obvious counterpart in the optical and even NIR images observed with HST at m. Photometric-redshift analyses from both stellar and dust SED suggest it to likely be at , though a lower redshift at cannot be fully ruled out (at 90% confidence interval). Explaining its unusual optical-to-NIR properties requires an old stellar population ( Gyr), coexisting with a very dusty ongoing starburst component. The latter is contributing to the FIR emission, with its rest-frame UV and optical light being largely obscured along our line of sight. If the observed fluxes at the rest-frame optical/NIR wavelengths were mainly contributed by old stars, a total stellar mass of M⊙ would be obtained. An X-ray spectral analysis suggests that this galaxy harbors a heavily obscured AGN with cm-2 and an intrinsic 2-10 keV luminosity of , which places this object among distant type 2 quasars. The radio emission of the source is extremely bright, which is an order of magnitude higher than the star-formation-powered emission, making it one of the most distant radio-luminous dusty galaxies.
Conclusions. The combined characteristics of the galaxy suggest that the source appears to have been caught in a rare but critical transition stage in the evolution of submillimeter galaxies, where we are witnessing the birth of a young AGN and possibly the earliest stage of its jet formation and feedback.
Key Words.:
galaxies: starburst–galaxies: high-redshift–galaxies: active–submillimeter: galaxies–X-rays: galaxies1 Introduction
Over the last decade, far-infrared (FIR) and submillimeter (submm) surveys have revolutionized our understanding of galaxy formation and evolution by uncovering a new population of heavily dust-obscured starburst systems at high redshifts (e.g., Chapman et al., 2005; Michałowski et al., 2010; Casey et al., 2014). These dusty submillimeter galaxies (SMGs) are found to have very high FIR luminosities of L⊙ , indicative of extreme star formation rates (SFRs) of hundreds to thousands of solar masses per year. While the bulk of this population has been found to lie at , recent blank-field surveys (e.g., by Herschel and South Pole Telescope) have started to reveal the high-redshift () tail of the SMG distribution (Vieira et al., 2013; Dowell et al., 2014; Ivison et al., 2016). These are thought to be progenitors of present-day massive ellipticals (e.g., Swinbank et al., 2006), and provide critical physical conditions for the formation of luminous quasars at high redshifts (Coppin et al., 2008). However, details about their evolutionary process are still poorly known.
Submillimeter galaxies are known to show red optical to near-infrared (NIR) color and to not emit strongly in the rest-frame ultraviolet (UV) (e.g., Yun et al., 2008), mainly due to the huge dust extinction produced by ongoing starbursts and/or evolved stellar population if at high redshift. Two illustrative examples are given by the bright SMGs GN10 and HDF850.1 in the Great Observatories Origins Deep Survey (GOODS) North field, both of which have no detectable optical or NIR counterparts in extremely deep imaging (Wang et al., 2007; Cowie et al., 2009), and now have been confirmed to be at (Daddi et al., 2009a) and (Walter et al., 2012), respectively, based on molecular CO emission lines. The two galaxies are instead detected significantly at mid-IR (MIR) wavelengths m with the Spitzer/IRAC, yielding extremely red colors of -[4.5m]4.0.
An outstanding issue relevant to the dusty starburst galaxies at high redshift is the early growth of the central supermassive black holes (SMBHs). The volume density and redshift distribution of SMGs similar to those of quasars suggest that the two populations are possibly evolutionarily linked (Chapman et al., 2005). Multiwavelength diagnostics, particularly those at X-rays, indicate that a substantial fraction (20%–50%) of bright SMGs have an active galactic nucleus (AGN) at their center (Alexander et al., 2003a, 2005; Borys et al., 2005; Laird et al., 2010; Wang et al., 2013). Follow-up studies have found that the BH masses for SMGs appear to be systematically smaller than those found in quasars (Alexander et al., 2008b), implying that they are likely at an early phase of the BH growth.
While the detections and identifications of SMGs at are rapidly increasing (e.g., Capak et al., 2008; Coppin et al., 2008; Daddi et al., 2009b; Dowell et al., 2014; Ivison et al., 2016), the incidence and properties of AGNs (often heavily obscured) in these high-redshift systems have yet to be properly explored. Only a few SMGs with an X-ray AGN have been identified, in which the X-ray data are usually too poor to ensure meaningful spectral fitting and hence effectively constrain the amount of gas obscuring the nucleus (e.g., Wang et al., 2013). One notable example is the V-band dropout galaxy LESS J033229.4-275619 at z = 4.76 (Vanzella et al., 2006). This object was detected as a bright SMG (Coppin et al., 2009), and the 4Ms Deep Field-South observations (Xue et al., 2011) revealed the presence of a Compton-thick AGN with an X-ray luminosity of (Gilli et al., 2011, 2014), making it one of the most distant type 2 quasars discovered so far. Objects like LESS J033229.4-275619 are therefore ideal laboratories to study the co-evolution of BHs with their host galaxies.
In this paper, we describe the multiwavelength properties of an unusual FIR bright galaxy, GH500.30 (RA=12:37:13.86; DEC=62:18:26.2), which is undetected in most optical and even NIR bands with HST in the GOODS-North field, likely an extremely dusty galaxy at high redshift of . The source is not only extreme for its faintness from optical to NIR, but the X-ray and radio properties are exceptional. For instance, it is extremely bright in the radio for a SMG, with a 1.4 GHz flux density of Jy, and has a radio excess of an order of magnitude more than the star-formation powered emission, indicating that it maybe one of the most distant radio-luminous SMGs in the early Universe. We note that some results from X-ray observations of the source have been presented by Laird et al. (2010) for a sample of bright SMGs. However, Laird et al. (2010) did not perform a detailed analysis of the multiwavelength spectral energy distribution (SED), and in particular quoted a rough estimate of photometric redshift () from only IRAC colors, which may be incorrect and may therefore bias our understanding of the physical properties of the source. In addition, their reference for the high submillimeter flux at 850m is found to be incorrect in later observations (see Section 2). We will provide a revised view on the true nature of this unique SMG, in particular in light of the new NOEMA data which allow for precise localization of submillimeter emission and hence unambiguous identification of its counterparts at other bands. Throughout this paper, we assume a cosmology with = 70 km s-1 Mpc-1, = 0.27, = 0.73.
2 Data and analysis
2.1 Optical to mid-infrared data
The optical to MIR data we used for photometric analysis are drawn from a -band selected multiwavelength catalog ( mag, ID=73108, Yang et al. 2014) supplemented by the new HST data from the 3D-HST program (Skelton et al., 2014). The 3D-HST data release1113dhst.research.yale.edu/Data.php provides calibrated ground-based and HST images, as well as multiwavelength photometric catalogs for five CANDELS fields. The photometric catalog for each field was constructed based on the sources detected in the combined image of three HST /WFC3 NIR bands (F125W, F140W, and F160W). Matching with the coordinate of the Ks-band source for GH500.30 (12:37:13.86; +62:18:26.43), we did not find a counterpart in the 3D-HST photometric catalog suggesting non-detections in the three WFC3/IR bands (F125W, F140W and F160W) down to a 5 depth of 26.2 mag. We attempted to perform manual photometry at the position of the -band source in a circular aperture of radius 0.6″ using the Python photometry routine developed by ourselves to determine whether there is any low-level flux recorded. The background and flux errors were estimated in an annulus area with inner and outer radii of 1.5″and 3″, respectively. We found only a marginal detection of 26.6 mag in the -band (1.6m), and the source is not detected () in any other HST optical and NIR wavelengths (i.e., F435W, F606W, F775W, F850LP, F125W, and F140W). We provide the HST measurements (and 1 upper limits) in Table 1.
2.2 FIR and submillimeter data
We take advantage of the FIR data from deep Herschel observations as a part of the GOODS-Herschel program. A detailed description of the observations is given in Elbaz et al. (2011). Since GH500.30 is well separated in the MIPS 24m , PACS 100m , and PACS 160m images, the photometry at these passbands is directly taken from the GOODS-Herschel catalog. Source confusion is a severe issue in the Herschel /SPIRE data where the spatial resolution is poor (20-40″), which makes it difficult to identify the correct counterparts and measure fluxes for individual Herschel sources. As we demonstrated in Shu et al. (2016), some candidate Herschel sources at have no measured 500m fluxes in the catalog of the GOODS-Herschel data release, which is likely due to the effect of source blending. This is for the case of GH500.30, for which the non-detection in the 500m in the catalog is likely due to the incorrect association of its flux with the neighboring galaxy (RA=12:37:16.83; DEC=62:18:24.16) at . Therefore, the Herschel /SPIRE flux densities for the source were derived independently from our PSF-fittings with GALFIT (Peng et al. 2002). We used a very similar source extraction and photometry method to the one described in Elbaz et al. (2011), but placed constraints on the 500m flux density of the nearby source to be less than the predicted one from SED fittings. We fitted the 24, 100, and 160m photometry with a library of CE01 templates to obtain a best-fit SED, using which we predicted the 500m flux of 5 mJy for the nearby contaminating source. The Herschel /SPIRE fluxes from our GALFIT fittings are listed in Table 1. We note that our measurements are consistent with the super-deblended fluxes in the photometry catalog of Liu et al. (2018, ID 3532) where mJy, mJy, and mJy are found. Although there are a few nearby sources within a radius of 6″ seen in the NIR images (Fig. 1) that might contribute to the 500m flux, our NOEMA observation at subarcsecond resolution (see below) revealed no other sources close to GH500.30 (with a 3 upper limit on 1.2 mm flux of 0.5 mJy, Fig. 1), indicating that the flux contamination from these neighboring sources on the FIR fluxes is negligible.
| Telescope | Band | Flux | Unit | Ref. |
|---|---|---|---|---|
| KPNO | 3593Å | Jy | (1) | |
| Subaru | 4458Å | Jy | (1) | |
| Subaru | 5478Å | Jy | (1) | |
| Subaru | 6289Å | Jy | (1) | |
| Subaru | 7684Å | Jy | (1) | |
| Subaru | 9037Å | Jy | (1) | |
| UH | 1.25m | Jy | (1) | |
| UH | 1.64m | Jy | (1) | |
| HST | 4318Å | Jy | (2) | |
| HST | 5919Å | Jy | (2) | |
| HST | 7693Å | Jy | (2) | |
| HST | 9036Å | Jy | (2) | |
| HST | 1.247m | Jy | (2) | |
| HST | 1.392m | Jy | (2) | |
| HST | 1.539m | Jy | (2) | |
| CFHT | 2.15m | Jy | (1) | |
| 3.6m | Jy | (1) | ||
| 4.5m | Jy | (1) | ||
| 5.8m | Jy | (1) | ||
| 8.0m | Jy | (1) | ||
| 24m | Jy | (3) | ||
| Herschel | 100m | mJy | (3) | |
| Herschel | 160m | mJy | (3) | |
| Herschel | 250m | mJy | (2) | |
| Herschel | 350m | mJy | (2) | |
| Herschel | 500m | mJy | (2) | |
| JCMT | 850m | mJy | (4) | |
| JCMT | 1100m | mJy | (5) | |
| NOEMA | 1200m | mJy | (2) | |
| VLA | 1.4 GHz | Jy | (4) | |
| VLA | 5.5 GHz | Jy | (6) | |
| VLBI | 1.6 GHz | Jy | (7) | |
| Chandra | 0.5–2 keV | (2) | ||
| Chandra | 2–10 keV | (2) |
The source was also detected in the SCUBA2 850m with mJy (CDFN28, Barger et al. 2014), and AzTEC 1.1mm with mJy (AzGN26, Perera et al. 2008) and is found to have similar 850m flux in the recent SCUBA2 Cosmology Legacy Survey data release (Geach et al., 2017). We note that the source was reported to have much larger 850m flux ( mJy) based on the old SCUBA data (Wall et al., 2008), which is likely attributed to the large contribution from noise artifact, as it lies at the edge of the map where the noise fluctuations are significant.
Recently, GH500.30 has been observed with NOEMA as a part of the program aiming at accurately measuring the FIR SED for a sample of Herschel selected galaxies at (Liu et al. in preparation). The observations of GH500.30 were done in the winter of 2016 with 8 antennae in track-sharing mode with other Herschel sources in the sample. The on-source time for GH500.30 is 1 hour. The synthesized beam is 1.06″0.63″ and the continuum of this source is well detected (spatially unresolved) at the phase center which is predefined as its IRAC position. With the NOEMA data, we obtained an accurate position for the submillimeter source (12:37:13.879; +62:18:26.296) and flux at 1.2mm () mJy through -plane point-source fittings with the GILDAS333http://www.iram.fr/IRAMFR/GILDAS uv_fit tool. The statistical positional error can be estimated as (where and are the major and minor axes of the beam; e.g., Younger et al. 2007). Given the source’s signal-to-noise ratio (S/N) of , we estimated the positional error at ”. Therefore, the high angular resolution and positional accuracy of the NOEMA data are good enough for us to precisely localize the source position and identify correct counterparts at other bands without confusion problems. For example, the synthesized beam size of 1″ at 1.2 mm is comparable with (or better than) the resolution at Ks-band (FWHM0.8″) and IRAC (FWHM2″). This confirms that the SMG has no optical counterparts in the deep HST imaging.
2.3 X-ray data
A total exposure of 2 Ms has been accumulated on the Chandra Deep Field North (CDFN) as a result of 20 individual observations with Chandra ACIS-I (Alexander et al., 2003b), which is the second deepest X-ray survey ever (see, e.g., Xue 2017 for a review), behind the 7 Ms CDFS (Luo et al., 2017). X-ray data products including event files for each observation and also for the merged data set are publicly available444http://cxc.harvard.edu/cda/Contrib/CDFN.html. The galaxy GH500.30 was clearly detected in the 2 Ms CDFN catalog (XID=374, Alexander et al. 2003b) with the soft X-ray flux of and the hard X-ray flux of . In this paper, we used the new CDFN products with the improved data reduction by Xue et al. (2016), which includes a flexible and reliable two-stage source-detection approach, better background estimate, and optimal extractions of X-ray photometry. We note that the separation between the -band and X-ray centroid is 0.27″, which is well within the 1 X-ray source positional uncertainty (0.47″). We obtained 235 net counts in the 0.3-7 keV band, corresponding to a detection. We checked the photometry of five periods separately and found no significant source variability in both soft and hard bands. A detailed X-ray spectral analysis will be presented in Sect. 4.1.
2.4 Radio data
The radio flux density at 1.4 GHz (Jy) was taken from Barger et al. (2014), which was also listed in the source catalog of the latest VLA observations of the GOODS-North field (Owen 2018). The latest VLA imaging reaches an rms noise in the field center of 2.2Jy with a resolution of 1.6″ . The source is also detected at 5.5 GHz with VLA at a sub-arcsec resolution, with a flux Jy (Guidetti et al., 2017). A compact radio core emission at 1.6 GHz has been detected with the new VLBI observations at a resolution of 5 mas (Radcliffe et al., 2016), which yields a flux of Jy. The radio position is coincident with the position found in the submillimeter imaging obtained at the NOEMA.
3 SED and redshift constraints
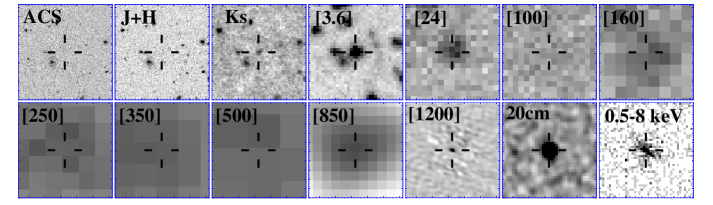
We used the position of the submillimeter source obtained with NOEMA to identify its counterparts at other bands; namely, X-ray, optical to MIR, FIR and radio. There are no obvious counterparts in the optical and even NIR observed with HST at the position of the submillimeter source. The flux densities and/or upper limits from optical to radio wavelengths are given in Table 1. The postage-stamp images of HST optical and NIR, CFHT , Spitzer IRAC and MIPS, Herschel PACS and SPIRE, SCUBA2 850m, NOEMA 1.2mm, VLA 1.4 GHz, and X-ray are presented in Fig. 1. The weak detections in the optical and NIR reveal an extraordinarily red SED in the NIR. For example, the marginal detection at the 1.6m by HST implies a flux ratio greater than 70, corresponding to an extremely red color of -[4.5m]4.6. We note that it is unlikely that this red color is due to the Lyman break which would otherwise imply a redshift . Galaxies with red and IRAC colors are identified to be massive dusty galaxies at either or (Wang et al., 2016), but most of them have -[4.5m] colors in the range of .
It is extremely difficult to measure the redshift of GH500.30 through conventional optical and NIR spectroscopy because of its faintness in the optical and NIR. Here we estimate the photometric redshift (photo-z) by fitting the photometric data points with a suit of SED templates to gain further insights into its nature.
3.1 Photometric redshift from near-infrared data
Since the GH500.30 has extremely red -[4.5m ] color indicating unusually high dust extinction (e.g., Huang et al., 2011), the standard templates used by most photo-z codes may not be enough to represent the observed SED of the source. We use Bayesian SED modeling code–BayeSED (Han & Han, 2012, 2014) to self-consistently estimate the photometric redshift and infer the physical properties of the galaxy. By employing efficient machine learning methods, such as the artificial neural network (ANN) algorithm, K-Nearest Neighbors (KNN) searching, and the Bayesian inference tool–MultiNest, BayeSED allows a continuous stochastic sampling of the parameter space and provides the posterior probability distribution function of all modeling parameters. This allows us to easily recognize the degeneracies between parameters and to reasonably estimate the parameter uncertainties. We note that the BayeSED code has been extensively tested for both mock and real galaxy catalogs in Han & Han (2014), and found to show consistent results with the traditional grid-based SED-fitting code FAST (Kriek et al., 2009).
We have used Bruzual & Charlot (2003, BC03) stellar population synthesis models with solar metallicity, assuming the Chabrier (2003) initial mass function (IMF) form in the range 0.1–100 M⊙. We adopted an exponentially declining star-formation history (SFH) with -folding times in the range of Gyr. For our photometric redshift calculations we adopted uniform priors on log(age/yr) in the range of [7.0, 10.1], and a very wide range of dust extinction of mag assuming the standard Calzetti attenuation curve. As another prior, the age of a galaxy is restricted to be less than the age of the universe at that redshift of the galaxy.
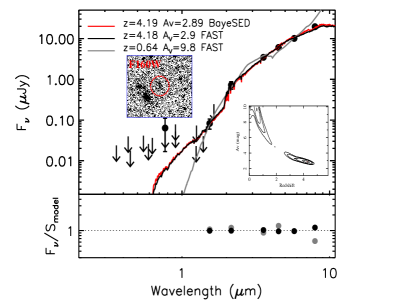
We fitted the model templates to the U-band to IRAC 8m photometry (including 1 upper limits) listed in Table 1 to investigate which redshift and how much dust extinction can make the red SED of the GH500.30. Although the source is not detected in most optical and NIR bands, the upper limits suggest a very red SED at 2m (Fig. 2) and therefore still provide useful constraints. We assigned zero fluxes to the non-detections and corresponding errors as the flux uncertainties. The best-fit (maximum likelihood) template from BayeSED yields a redshift at and a modest extinction of . Such a model template is similar to those obtained in Huang et al. (2011) for a sample of dusty galaxies with similarly red -[4.5m] colors. We note that using the photo-z package (Brammer et al., 2008) with empirically observed SEDs yields a consistent but slightly higher redshift at (1 confidence range 4.21–5.03).
For a consistency check, we also used FAST to perform SED fittings to the U-band to IRAC 8m photometry. We assumed the solar metallicity and exponentially declining SFH with -folding times in the range Gyr. We adopted the standard Calzetti law with a very wide range of dust extinction of . The best-fit template from FAST yields a redshift at with a modest extinction of , which are in good agreement with the fitting results from the BayeSED. The best-fit SED templates are shown in Fig. 2.
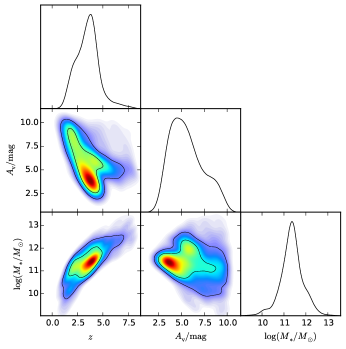
One uncertainty in the above photo-z analysis is the degeneracy between the redshift and dust extinction in the SED fittings. As we show in Fig. 2, if we allow very large extinctions, the red SED of GH500.30 can be reproduced by a highly reddened galaxy () at . However, we argue that this possibility of an extremely dusty low galaxy can be ruled out given its significant FIR to submillimeter emission. Furthermore, SED fittings to submillimeter-selected galaxies generally give (Yun et al., 2012; da Cunha et al., 2015). For example, the stellar population analysis for the GN 10, which is a known dusty galaxy at , yields (Daddi et al., 2009a). This value is very similar to that obtained from our best-fit (maximum likelihood) template for the GH500.30. Figure 3 shows the posterior probability distributions on the redshift, dust extinction and the stellar mass from the BayeSED fittings. Although degeneracies in stellar population modeling parameters do exist, the Bayesian analysis suggests that significant dust extinction (i.e., ) is unlikely.
Another uncertainty is the existence of an AGN, which may have effects on the NIR photometric analyses. The galaxy GH500.30 shows a featureless power-law continuum in the IRAC bands, with the brightest being the 8m; if due to the stellar emission, this would imply that the rest-frame 1.6m bump is beyond the 5.8m channel, or . However, the IRAC emission can also be due to a reddened and obscured AGN, as indicated by a slight excess emission at 8m compared with the best-fit SED template (Fig. 2). Yun et al. (2008) proposed that a young dusty starburst at high redshift is able to generate similar red IRAC colors as obscured AGNs. The galaxy GH500.30 appears to fall into the red power-law region in the IRAC color-color diagram of Yun et al. (2008), where AGNs and young and extremely dusty starbursts at overlap. Although it is difficult to disentangle the relative contribution of the two causing the IRAC power-law spectral slope, we compared the flux ratio to Mrk 231, a local FIR luminous Compton-thick AGN. For a fair comparison we redshifted the SED of Mrk 231 to z=4.19 (the best-fit photometric redshift for GH500.30) to derive the ratio. We found the flux ratio of GH500.30 is a factor of 3.9 higher than that in Mrk 231, indicating that the source may have low levels of the warm dust emission due to an AGN. In fact, we estimated that an AGN may contribute at an approximately % level to the rest-frame MIR continuum emission (Sect. 4.3). We note that by using only a library of pure AGN- or hybrid AGN-galaxy templates555The templates were used to derive photometric redshifts for bright X-ray sources in the COSMOS field (Salvato et al., 2009)., we obtained a best-fit photometric redshift at , a value consistent with that estimated assuming stellar templates within errors. Yang et al. (2014) obtained a similar best-fit redshift of by using an optimal combination of galaxy and AGN templates. We therefore conclude that the existence of an AGN has a small effect on the photo estimation of GH500.30. In fact, the AGN’s emission at the rest-frame UV/optical is likely heavily attenuated considering the strong absorption inferred from the X-ray observations (Sect. 4.1 ).
3.2 Photometric redshift from far-infrared SED
An independent estimate of the redshift for GH500.30 can be performed from its FIR emission, because the mid-to-far-IR emission has a generally well-defined peak at the rest-frame 50-200m. There have been a number of previous studies exploring the use of the FIR-radio relation to constrain the redshifts of SMGs (e.g., Carilli & Yun, 1999; Wang et al., 2009; Barger et al., 2012), which would be helpful when a galaxy suffers from extremely heavy extinction in the rest-frame optical/NIR bands. The main uncertainty of this method is the dust temperature which is still poorly constrained for high- SMGs.
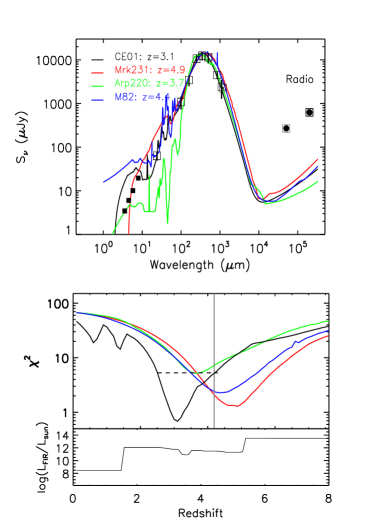
We use the available photometry in Table 1 at 24m, 100m, 160m, 250m, 350m, 500m, 850m, 1.1 mm and 20 cm (Fig. 4), and compare them to a suite of 105 template SEDs from the Chary & Elbaz (2001) library (CE01 hereafter), as a function of redshift. The CE01 templates are sorted by IR luminosities from Log L⊙ to Log L⊙, with dust temperatures becoming warmer with increasing luminosity. We calculate the values between the observed flux densities of GH500.30 and predictions for each SED model of given luminosity as a function of redshift. We choose a redshift grid from to in steps of . We note that an AGN contributes significantly to the radio emission, higher than the predicted value from any SED template by a factor of more than . Such radio excess could bias the best-fit redshift. We are therefore excluding the radio data in our FIR SED fits. Figure 4 (bottom) shows the values for each of best-fit SED model as a function of redshift (thin curve). The best-fitting redshift is and the 90% confidence interval is , which agrees with the NIR photometric redshift within the errors (Sect. 3.1). We note that this analysis allows us to reject the possibility of a highly reddened low-redshift galaxy (i.e., at ).
As mentioned above, the dust temperature can bias the redshift estimation from the FIR to radio SED fittings. For instance, SED templates with lower dust temperature can decrease the best-fit redshift. This can be seen in Fig. 4 (bottom) which shows the best-fit FIR luminosity that gives the least value at each redshift. Since the CE01 templates are sorted such that the dust temperatures become warmer with increasing luminosity, the lower FIR luminosity inferred at is suggestive of lower dust temperature for the best-fit template. For comparison, we also estimated the redshift of GH500.30 by fitting the well-studied SEDs of local galaxy Mrk 231 (an obscured AGN with warm dust), Arp 220 (luminous starburst with cool dust), and M82 (low-luminosity starburst with warm dust). The 24m flux is excluded in the SED fittings, as it can bias the fit statistics. The best-fit comes from Mrk 231 at , whilst the fit with the Arp 220 template yields a relatively low redshift of . This is perhaps not too surprising since the Arp 220 SED has a colder dust temperature. The best fit of the CE01 templates yielding a lower redshift at is perhaps due to the very wide range of SED models. Generally speaking, the CE01 models provide good fits in the range at a 90% confidence level. Our analysis suggests that the result of the FIR redshift for GH500.30 highly depends on its dust temperature which cannot be determined independently. In addition, as shown in Fig. 4 (upper panel), the best-fit CE01 SED at z=3.1 overpredicts the observed fluxes at m . This may be due to the poor calibrations of the optical/NIR part of the CE01 templates, and/or heterogeneous dust extinction from a more complicated dust distribution (e.g., Daddi et al. 2009a). Therefore, we favor the NIR redshift of for GH500.30 in this paper, though we cannot fully rule out a lower redshift of from the FIR SED fittings. We note that Liu et al. (2018) obtained a redshift of by independent FIR SED fittings in which the Magdis et al. (2012) library of main sequence and starburst galaxies was used as a template.
3.3 Ultraviolet to far-infrared broadband SED fittings
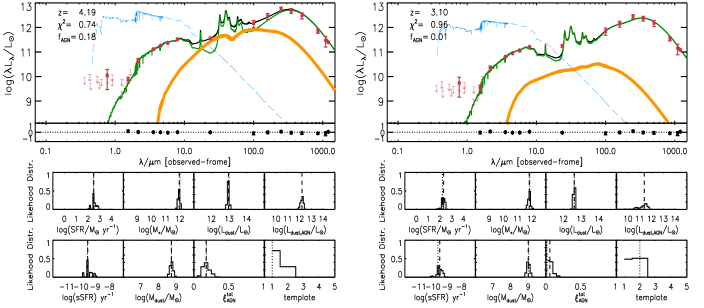
It should be noted that the NIR and FIR SED analyses presented above were modeling the stellar and dust emission properties separately, and do not take into account the AGN component. Now, we employ the MAGPHYS code (da Cunha et al., 2008, 2015) to model the UV-optical to submillimeter broadband SED in a more consistent way. MAGPHYS is built on a global energy balance between stellar and dust emissions: the UV/optical emission from stellar continuum is absorbed by dust grains in star-forming regions, which re-radiate the absorbed energy in the MIR to FIR wavelengths. Here we used the latest version of MAGPHYS that includes the contribution by AGN emission to the SEDs (de Cunha et al. in prep). This allows us to disentangle the AGN emission from the broadband SED. The AGN emission is modeled using a set of empirical templates from Richards et al. (2006), Polletta et al. (2007), Prieto et al. (2010), and Mullaney et al. (2011), which span a wide range of representative AGN SEDs including type 2 AGNs, type 1 AGNs and quasars as shown in Chang et al. (2017). The contribution of the AGN template to the total IR luminosity is defined as , which is allowed to vary between 0 and 1 for each of the templates.
Since MAGPHYS was designed to perform SED fittings with known redshifts, we fixed the redshift at for GH500.30. The result of the MAGPHYS SED fitting is shown in Fig. 5 (left panel), which reproduces the broadband SED of GH500.30 well, with . The SED fitting appears to tightly constrain the AGN fraction based on the detection of MIR photometric point at the 24m (which differentiates between AGNs and star-forming galaxies). The posterior probability distribution suggests that the AGN component contributes at most 30% to the total IR luminosity, with 18% being the most probable level of contribution. The SED fitting assuming the source at is also plotted in Fig. 5 (right panel), which yields an even smaller best-fitted AGN fraction of 1%. The dust and stellar properties inferred from the MAGPHYS fittings will be discussed in the following section.
4 Properties of GH500.30
4.1 A heavily obscured AGN in GH500.30
Here we investigate the detailed properties of the X-ray source presented in Sect. 2. Although some results from X-ray spectral fitting have been shown by Laird et al. (2010), they assumed a much lower redshift of for the source, which may result in different spectral parameters from ours. We emphasize that the analysis presented in this paper is more robust, because it is based on new constraints on the redshift and updated X-ray data reduction. The spectral data were grouped to have at least 1 count per bin and the -statistics was adopted for minimization. Spectral fittings were performed in the 0.5–7 keV band using the XSPEC (Version 12.6). All statistical errors provided hereafter correspond to 90% confidence for one interesting parameter (= 2.706). Throughout the model fittings, the Galactic column density was considered and fixed at cm-2 (Kalberla et al. 2005). We performed the spectral fitting with a simple absorbed power-law (), assuming . The best-fitting parameters are and cm-2, with 162.5 for 163 degrees of freedom. Such a is typical in X-ray bright Seyfert galaxies (e.g., Tozzi et al., 2006). The measured indicates that the source is heavily absorbed but not Compton-thick. The 99% confidence contour of the vs. shown in Fig. 6 implies an upper limit of cm-2. No prominent iron K line is observed at 1.233 keV (i.e., rest-frame 6.4 keV based on the photo-z). We therefore obtained an upper limit on the rest-frame equivalent width of the line of 760 eV. This best-fitting model gives the observed X-ray fluxes of and .
As can be see in Fig. 6 (a) and (b), a positive excess in the fit residuals was present around 1.5 keV. Therefore, we added a redshifted Gaussian emission component to test whether or not it is significant. The addition of this component improves the fit moderately with for two extra free parameters (Fig. 6 (c)). If assuming it to be the Fe K line at 6.4 keV, the best-fit yields a redshift of , and a rest-frame equivalent width of the line eV. The significance of the line detection was at 99% confidence level for two parameters (i.e., redshift and normalization). If it is real, the best-fit value of redshift is consistent with that obtained from the FIR SED fittings (, Sect. 3.2). However, due to the limited spectral resolution and statistics of the Chandra data, the possibility for the presence of a line emission at keV is still low. If we fix the redshift at in the spectral fittings without a Gaussian line, the residuals vanish as well (Fig. 6 (d)), suggesting that the line feature is likely not real.

The absorption-corrected luminosity in the rest frame 2–10 keV, which can be estimated as and , for a source at and , respectively, places GH500.30 at the low end of the X-ray luminosity range for type-2 quasars. Therefore it is likely that GH500.30 hosts a heavily obscured AGN (but not Compton thick), which is one of the X-ray luminous objects found among the SMG population (Alexander et al., 2005; Wang et al., 2013). However, we note that the uncertainties in redshift and the geometry of the obscuring material might affect the derivation of the intrinsic luminosity.
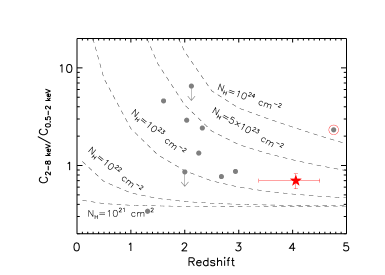
We investigated whether the uncertainty in redshift could affect the estimation of the amount of absorption from spectral fittings. We run simulations in XSPEC using the model by fixing and varying to construct hardness ratio tracks as a function of redshift (e.g., Wang et al. 2013). The results are shown in Fig. 7. The value constrained in this way is not distinguished from the one derived from spectral fitting, suggesting that the GH500.30 is heavily obscured, with cm-2 if at . We note that the intrinsic luminosity could be considerably greater than the observed luminosity if the obscuration is much higher.
4.2 Infrared luminosity and star formation rate
Given the large X-ray luminosity, the bolometric output from the central AGN in GH500.30 can heat up the interstellar dust and this may contribute to a substantial fraction of the FIR luminosity of the host galaxy. We derived the FIR luminosity of GH500.30 by fitting the data at wavelengths greater than 24m with a suit of CE01 templates assuming the galaxy is located at , and integrating the best-fit SED between rest-frame 8m and 1000m. The inferred total IR luminosity is L⊙. Using the SEDs of local galaxies (M82, Arp 220 and Mrk 231) as templates yields consistent luminosities in the range (7.8-8.6) L⊙. The unabsorbed X-ray to FIR luminosity ratio of GH500.30 is . This value is very similar to that found by Alexander et al. (2005) (median ), but is an order of magnitude smaller than those found in quasars (; Elvis et al. 1994; Alexander et al. 2005). The reason why the luminosity ratio is so much smaller than those in quasars is the extreme FIR luminosity of the source. This suggests that the large FIR luminosity of GH500.30 is not mainly powered by the AGN, but should be attributed to intense star formation activities. This is consistent with the estimate that the AGN contributes at most 30% of the total IR luminosity from the MAGPHYS SED fittings (Sect. 3.3). The SFR for GH500.30 can be estimated with the relation L⊙ (e.g., Kennicutt, 1998). Subtracting the 30% AGN contribution from the total IR luminosity, we obtained a SFR of 1001 M⊙ yr-1 with a Salpeter IMF and 623 M⊙ yr-1 if assuming a Chabrier IMF. We note that MAGPHYS gives similarly high dust luminosity ( L⊙) produced by the star formation activities. This suggests the source to be among the most extreme star-forming galaxies seen in the early universe (e.g., Casey et al. 2014 and references therein).
4.3 Stellar population
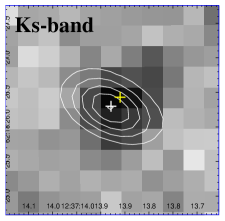
As shown in Fig. 2, the NIR SED of GH500.30 is nearly a power law in the IRAC bands but shows a clear spectral break between 1.6 and 3.6 m. This cannot be fully explained by a normal extinction curve. The best-fit template from the BayeSED modeling is at with the Calzetti extinction of . In this scenario, the red -[4.5m] color is mainly due to the redshifted 4000Å Balmer break at , which is a signature of existence of older stellar population. The stellar population model from BayeSED agrees with this interpretation: the best-fit template has an age of 0.67 Gyr (maximum likelihood value), which is about half the age of the universe at . On the other hand, GH500.30 has a very strong FIR emission, very similar to GN10 (Wang et al., 2009), implying an intensive ongoing starburst and the formation of a young galaxy. There seems to be a two-component SED model to reconcile the old stellar population and very dusty star-forming component seen in the FIR, but the current data are insufficient for further decomposing the two components in GH500.30. It is possible that the star-forming component is extremely dusty, such that its rest-frame UV and optical light being largely obscured along our line of sight, and the NIR SED in the IRAC bands is dominated by an older stellar population with a moderate extinction of . We note that the optical/NIR and IRAC data cannot constrain the stellar age well because of its degeneracy with the dust attenuation. By marginalizing a wider range of SFRs, the MAGPHYS SED fittings yield a stellar age of Gyr with a higher . The galaxy GH500.30 is not resolved by the NOEMA (beam size of 1.06″0.63″). We overlaid the NOEMA contours on the NIR -band image, and found an offset of 0.2″between the NOEMA and -band centroid. The latter image is also found to show a clear extension to the northwest (Fig. 8). This suggests that the dusty star forming region may be different from that producing MIR emission. However, though the NOEMA’s positional accuracy is high (0.03″), the astrometric accuracy of observations at -band is not as good. Wang et al. (2010) have shown that typical astrometric uncertainty at Ks-band for a source with S/N20 and FWHM1.2” is 0.05”. Given the relatively low S/N of GH500.30 detected at Ks-band, we estimated a positional error of ″. Such an offset should therefore be considered as tentative. We note that recent high-resolution submillimeter and/or radio observations have confirmed that some SMGs indeed show significant spatial offsets between the positions of dust emission and the UV/optical emission (e.g., Schinnerer et al., 2008; Chen et al., 2015; Hatsukade et al., 2015; Elbaz et al., 2017).

We argue that the AGN component is not a major contribution in the MIR. Using the intrinsic, absorption-corrected X-ray luminosity from Sect. 4.1, we can estimate the rest-frame 6m luminosity due to the AGN, and compare it with the total 6m luminosity measured in the MIR. Assuming that the X-ray-to-MIR luminosity relationship for local AGNs (Lutz et al., 2004) holds at high redshift, the intrinsic 2–10 keV luminosity suggests a 6m luminosity of for the AGN. We derived total 6m luminosity from the 24m flux (the MIR spectral slope of , is used for the small -correction, Coppin et al. 2010), and found . Taking into account the dispersion of the X-ray to MIR luminosity relation, the AGN may contribute % of the observed 24m emission, consistent with the inferred fraction of AGN contribution to the total IR luminosity from the MAGPHYS fittings (Sect. 3.3). As shown in Fig. 5, assuming the 24m flux is completely due to the AGN, the extrapolation of the best-fitting AGN SED to the IRAC bands yields a contribution to the IRAC fluxes of less than 10%. We note that Riechers et al. (2014) recently presented a measurement of % AGN contribution to the MIR continuum emission in GN20, an X-ray detected bright SMG at , from the Spitzer/IRS spectral decomposition666Tan et al. (2014) have shown that the IRAC fluxes from 4.5m to 8m exceed the best-fit stellar SED for GN20, which is likely due to the contribution by an AGN (Riechers et al., 2014). Such an excess IRAC emission was not found in the best-fitting stellar SED for GH500.30 (Fig. 2), suggesting a relatively weak AGN contribution.. In Fig. 9, a comparison between the NIR SED of GN20 and the GH500.30 (scaled to the 24m flux) is shown. This comparison suggests that the presence of an obscured AGN in GH500.30 is likely, but its contribution to the MIR emission is not as much as in GN 20. For comparison, we also plot the SED of the extremely dusty SMG GN 10 (Wang et al., 2009). Because of the strong dust extinction, the AGN contribution to the IRAC flux densities in GN10 is even smaller, which is consistent with its non-detection in the X-rays.
Having established that the observed IRAC fluxes are dominated by old stars, we can estimate the stellar mass for GH500.30. The best-fit SED model from the BC03 stellar population yields a stellar mass of . We note that the MAGPHYS SED fittings yielded an even higher stellar mass of , which may be due to higher dust attenuation inferred, as there is a degeneracy between the two (Fig. 3). This mass is similar to those for typical SMGs at (e.g., Huang et al. 2014; Michałowski et al. 2012; Smolčić et al. 2015), but is larger than that of coeval UV-selected star-forming galaxies which have stellar masses of (e.g., Stark et al., 2007, 2009). For comparison, Borys et al. (2005) have studied stellar components of 13 SMGs in the GOODS-North field, and found stellar masses of – and a mean stellar mass of . Although the posterior probability distribution on is weakly constrained (Fig. 3), the maximum likelihood value of from the best-fitting model is also comparable to those found in SMGs with rest-frame optical spectroscopy observations by Swinbank et al. (2004, ), Borys et al. (2005, ), and Takata et al. (2006, ). To summarize, GH500.30 appears to be a massive galaxy with an old stellar population ( Gyr) and moderate dust extinction of , which may be spatially offset from the extremely dusty starburst region. Given its extreme faintness at wavelengths m, massive galaxies like GH500.30 at may be missed in deep optical and even NIR surveys with HST (Wang et al., 2016).
5 Discussion
The galaxy GH500.30 shares many properties with GN 10, one of the bright SMGs in the GOODS-North field confirmed at . Both sources are incredibly faint at all optical to NIR wavelengths at m, with extremely red colors of -[4.5m]4, indicating the existence of an older stellar population if found to be due to a strong, redshifted 4000Å Balmer break. One unique property of GH500.30 is its significant detection in the X-rays and radio, suggesting the presence of an AGN. The full-band net counts ensure meaningful X-ray spectral fitting, and hence put strong constrains on the absorption of cm-2. This is one of the most distant heavily obscured AGNs confirmed by direct X-ray spectral analysis. The most distant Compton-thick AGN discovered so far is LESS J033229.4-275619 (Gilli et al., 2011), which is also a submillimeter bright dusty starburst galaxy. However, unlike GH500.30, its rest-frame UV/optical light is only partially obscured along our line of sight, suggesting less dust extinction or a different dust distribution in the star-forming region. In addition, no significant radio emission due to the AGN is detected in LESS J033229.4-275619.
5.1 Can GH500.30 -like objects fit into the evolutionary sequence?
The formation and co-evolution of AGNs and stellar populations are focuses of a large amount of current research. It is believed that the starburst and the growth of SMBHs are generally triggered by major mergers of gas-rich galaxies (see e.g., Hopkins et al. 2008, and references therein). Intense starburst rapidly enshrouds a forming galaxy in cold dust which emits at submillimeter wavelengths. This is followed by an increase in fueling of the SMBH, triggering an AGN and generating X-ray and radio emission. Finally, AGN feedback affects star formation in the host galaxy by removing the dust and gas, leaving a quiescent massive galaxy (e.g., Sanders et al., 1988; Hopkins et al., 2006; Narayanan et al., 2010). In this scenario, GH500.30 may be in the early transition phase from a starburst SMG to an obscured quasar where a radio-mode feedback is in place, making it a powerful probe of evolutionary models.
GH500.30 appears to be a luminous massive starburst, forming stars at a rate of 1000 M⊙ yr-1, with properties representative of SMGs at . The presence of an AGN has been suggested for approximately 25% of the SMG population at (Alexander et al., 2005; Wang et al., 2013). Assuming that all bright SMGs go through a subsequent AGN phase, the inferred AGN fraction may represent a “duty cycle” for BH accretion. The current total lifetime estimates from modeling SMGs are Myr (e.g., Swinbank et al., 2006), and thus the AGN-dominated phase caught by the X-ray/radio would be occurring during the last Myr of an SMG lifetime. These relative lifetimes and duty cycle are consistent with the merger simulations of Hopkins et al. (2008). It is therefore possible that the BH accretion in GH500.30 is at a transition phase to an obscured quasar, or a protoquasar phase where the BH is growing more rapidly than in typical quasars and is still not completely buried in the central dust and gas-rich region at the approximately parsec scale, as in the dusty torus (e.g., Alexander et al., 2005; Kawakatu & Wada, 2009; Tamura et al., 2010). Tentative evidence for this has been found in typical SMGs where the BH-to-galaxy mass ratio is found to be lower than in 2 quasars (Alexander et al., 2008b; Coppin et al., 2008). One puzzling property of GH500.30 is that while strong AGN emission is observed in the X-rays and radio, it does not contribute significantly to the MIR fluxes (Sect. 4.3). This may be because the AGN is attenuated by dust on a larger scale in the host (from starburst) rather than a torus component which may have not yet fully formed in GH500.30.
5.2 Young powerful radio jet in a transitional submillimeter galaxy
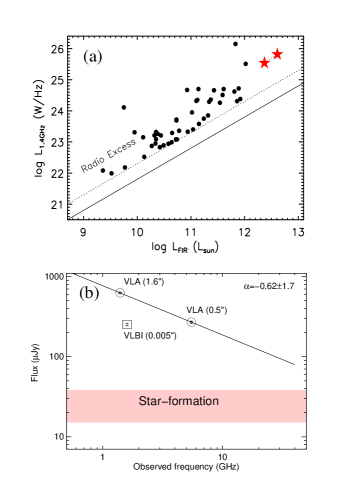
Another unique property of GH500.30 is its extremely strong radio emission. The rest-frame 1.4 GHz monochromatic luminosity is 6.6 W Hz-1, and the ratio of rest-frame 1.4 GHz to rest-frame 4400Å (observed ) flux densities is 580, which qualifies GH500.30 as radio loud (Stern et al., 2000). To derive the rest-frame 1.4 GHz flux, we used a typical radio slope of (e.g., Thomson et al. 2014) for the K-correction assuming the source at . However, because the observed -band flux is dominated by stellar population and the AGN optical emission is heavily attenuated, we should treat this estimation with caution. Alternatively, the radio loudness can be measured from the ratio of the flux densities between 5 GHz and the X-ray, , where 5GHz luminosity is in the rest-frame and is the intrinsic luminosity in the 2–10 keV band. We obtained a log value of , placing GH500.30 as a radio-loud object where radio-loud is defined as log (Terashima & Wilson, 2003). Using the rest-frame FIR luminosity from the best-fit SED template, we obtain = 1.04 which is defined as the logarithmic ratio of the rest-frame 8–1000m flux and the 1.4-GHz flux density. This is twenty times more radio loud than the normal value of 2.4 0.24 for FIR-selected star-forming galaxies (Ivison et al., 2010). For comparison, the ratio between the FIR and radio emission in GH500.30 is much less than most of the radio excess sources studied with Herschel in the GOODS-North field (Fig. 10 (a)). The detection of a radio-luminous AGN at such a high redshift () is rare, but may provide us new insights into the earliest stages of jet formation and AGN evolution.
A compact radio core emission has been observed for GH500.30 with VLBI at 5 mas scale (Radcliffe et al., 2016), corresponding to a linear size less than 1 kpc at the source redshift. This is similar to those of compact steep-spectrum (CSS) radio sources, a class of AGNs mostly composed of young radio galaxies (O’Dea, 1998). As shown in Fig. 10 (b), the VLBI observation resolves out 70% of the radio flux observed with VLA at a resolution of 1.6″. We note that most of the emission that is invisible to high-resolution VLBA imaging tends to be the extended component of the jet emission, such as lobes on larger scales, rather than the star-forming process. The latter is estimated to represent only 5% of the total radio flux observed by VLA. Therefore, strong interactions between the jet and the dense nuclear ISM are anticipated in GH500.30, which may signify the earlier stage of the feedback from AGN jet mechanical energy. Based on the VLA observations at 1.4 GHz and 5.5 GHz, we obtained a steep radio slope of , consistent with those CSS sources. However, such a measurement of radio slope is not robust, because the resolution is different between the two frequencies (by a factor of 3). Future high-resolution observations with VLBI at other frequencies will be helpful to better characterize the radio slope, yielding more accurate constraints on the physical properties of the AGN radio emission, that is, a young powerful jet in its earliest formation stage.
Theoretically, the formation of jets is thought to be related to the BH and accretion process (e.g., Celotti & Blandford, 2001; Meier, 2003; Ballantyne, 2007). Greene et al. (2006 and references therein) more generally suggested that radio loudness (formation of radio jets) is anticorrelated with accretion rate (their Fig. 3) in a sample of Seyfert galaxies and PG quasars, albeit with large scatter. This strengthens the similar situation in microquasars (BH X-ray binaries) where jets are found at the low accretion state (Fender et al., 2004; Fender & Gallo, 2014). Whether this trend still holds for high-redshift, highly accreting quasars has yet to be explored. Given the possibly high efficiency of BH accretion (), as suggested in SMGs in general, GH500.30 presents a strong case where jet, at least mildly relativistic, can be produced in high- systems. This is important for addressing basic questions as to how jets are formed. Although the situation is far from clear, there are some suggestions that radio–loud AGNs are associated with rapidly spinning BHs that are ultimately spun-up by major BH-BH mergers (Wilson & Colbert, 1995; Chiaberge & Marconi, 2011; Chiaberge et al., 2015). This is consistent with the major “merger” evolutionary scenario for the formation of SMGs (like GH500.30) that starts with the collision of gas-rich disk galaxies (e.g., Hopkins et al., 2008), seemingly hinting at a possibly important role of BH spin in the making of relativistic jets.
It is interesting to compare the properties of GH500.30 to the AGN-dominated Hot Dust Obscured Galaxies (HotDOGs) which are proposed as tracers of an exceptional rapid and dusty phase of quasar/host galaxy co-evolution (e.g., Wu et al., 2012; Piconcelli et al., 2015; Assef et al., 2015). Recent X-ray observations of a few HotDOGs confirm their harboring of highly buried AGNs (Stern et al., 2014; Piconcelli et al., 2015), with absorption column density cm-2. The bolometric luminosities of many HotDOGs exceed L⊙, suggesting them to be among the most luminous objects in the universe, which are likely maintained by SMBHs with M⊙ accreting near the Eddington limit (e.g., Tsai et al., 2015). The prototype HotDOG, WISE J1814+3412, has shown radio emission exceeding the amount expected from the FIR-radio correlation by a factor of approximately ten (Eisenhardt et al., 2012), indicative of a radio-loud AGN. Further high-resolution radio observations of HotDOGs show that their radio properties are consistent with young radio AGNs (Lonsdale et al., 2015; Frey et al., 2016). If most of the radio emission is indeed due to AGN jets, and considering their extreme luminosities and Eddington ratios (), HotDOGs seem not to fit the simple picture for jet formation (Fender et al., 2004), as we inferred for GH500.30. However, unlike GH500.30, HotDOGs may represent a late phase of the AGN-SMG evolution, with similar cold-dust components to SMGs (Wu et al., 2012; Jones et al., 2015) but more massive SMBHs.
6 Conclusions
Our analyses of multiwavelength observations reveal many unusual properties of GH500.30. The SED is well constrained at wavelengths 2m thanks to the NOEMA interferometer observations, with significant detections by Spitzer/IRAC and MIPS wavelengths, and by Herschel, SCUBA2, AzTEC, and VLA from FIR to centimeter wavelengths. This galaxy is also detected at the X-ray by Chandra with high significance (), allowing for a direct spectral analysis. However, its flux drops out at shorter wavelengths, displaying a steeply declining spectrum in NIR. We analyzed the photometric redshifts of GH500.30, using both the NIR and FIR photometric SED fittings, yielding a consistent result that the source is likely to be at ; though a lower redshift at cannot be fully ruled out.
Explaining the observed properties of the source requires a two-component SED model with an old stellar population dominating the optical-to-NIR SED and a very dusty ongoing starburst (SFR1000 M⊙ yr-1) contributing to the FIR emission that is barely visible in the rest-frame UV/optical. The optical-to-NIR SED fitting suggests a modest dust extinction ( mag) of starlight from a stellar component with a mass of ( assuming at ), which may be spatially offset from the starburst region. Modeling of the X-ray spectrum of GH500.30 suggests that it harbors a heavily obscured AGN with cm-2, and a 2-10 keV luminosity of , which is in the range of type 2 quasars. The radio emission of the source is extremely bright, which is an order of magnitude more than the star-formation powered emission, making it one of the most distant radio-luminous SMGs known so far.
In view of the combination of observed characteristics of the galaxy, we conclude that the source appears to have been caught in a rare but critical early transition stage from a submillimeter galaxy to a dust-obscured quasar. The high redshift of GH500.30, if confirmed, will have important implications for the early growth of a massive BH and its host galaxy, as well as the formation of jet in the early universe. However, its extreme faintness at m hampers any optical and NIR spectroscopic observations. Blind searches of CO molecular emission line(s) with NOEMA, VLA and LMT are required, and may be the only way to spectroscopically identify its redshift.
Acknowledgements.
This work is supported by the Chinese NSF through grant 11573001 and 11822301, National Basic Research Program 2015CB857005, the Sino-French LIA-Origin joint exchange program and Anhui Provincial NSF (1608085QA06). Y.Q.X. acknowledges support from the 973 Program (2015CB857004), NSFC-11473026, NSFC-11421303, and the CAS Frontier Science Key Research Program (QYZDJ-SSW-SLH006). D.L. acknowledges funding from the European Research Council (ERC) under the European Union’s Horizon 2020 research and innovation programme (grant agreement No. 694343). Y.H. acknowledges support from NSFC-11773063.References
- Alexander et al. (2003a) Alexander, D. M., Bauer, F. E., Brandt, W. N., et al. 2003a, AJ, 125, 383
- Alexander et al. (2003b) Alexander, D. M., Bauer, F. E., Brandt, W. N., et al. 2003b, AJ, 126, 539
- Alexander et al. (2005) Alexander, D. M., Bauer, F. E., Chapman, S. C., et al. 2005, ApJ, 632, 736
- Alexander et al. (2008a) Alexander, D. M., Chary, R.-R., Pope, A., et al. 2008a, ApJ, 687, 835-847
- Alexander et al. (2008b) Alexander, D. M., Brandt, W. N., Smail, I., et al. 2008b, AJ, 135, 1968
- Assef et al. (2015) Assef, R. J., Eisenhardt, P. R. M., Stern, D., et al. 2015, ApJ, 804, 27
- Ballantyne (2007) Ballantyne, D. R. 2007, Modern Physics Letters A, 22, 2397
- Barger et al. (2012) Barger, A. J., Wang, W.-H., Cowie, L. L., et al. 2012, ApJ, 761, 89
- Barger et al. (2014) Barger, A. J., Cowie, L. L., Chen, C.-C., et al. 2014, ApJ, 784, 9
- Borys et al. (2005) Borys, C., Smail, I., Chapman, S. C., et al. 2005, ApJ, 635, 853
- Brammer et al. (2008) Brammer, G. B., van Dokkum, P. G., & Coppi, P. 2008, ApJ, 686, 1503-1513
- Bruzual & Charlot (2003) Bruzual, G., & Charlot, S. 2003, MNRAS, 344, 1000
- Capak et al. (2008) Capak, P., Carilli, C. L., Lee, N., et al. 2008, ApJ, 681, L53
- Carilli & Yun (1999) Carilli, C. L., & Yun, M. S. 1999, ApJ, 513, L13
- Casey et al. (2014) Casey, C. M., Narayanan, D., & Cooray, A. 2014, Phys. Rep, 541, 45
- Celotti & Blandford (2001) Celotti, A., & Blandford, R. D. 2001, Black Holes in Binaries and Galactic Nuclei, 206
- Chabrier (2003) Chabrier, G. 2003, PASP, 115, 763
- Chang et al. (2017) Chang, Y.-Y., Le Floc’h, E., Juneau, S., et al. 2017, ApJS, 233, 19
- Chapman et al. (2005) Chapman, S. C. et al. 2005, ApJ, 622, 772
- Chary & Elbaz (2001) Chary, R. and Elbaz, D. 2001, ApJ, 556, 562
- Chen et al. (2015) Chen, C.-C., Smail, I., Swinbank, A. M., et al. 2015, ApJ, 799, 194
- Chiaberge & Marconi (2011) Chiaberge, M., & Marconi, A. 2011, MNRAS, 416, 917
- Chiaberge et al. (2015) Chiaberge, M., Gilli, R., Lotz, J. M., & Norman, C. 2015, ApJ, 806, 147
- Coppin et al. (2008) Coppin, K. E. K., Swinbank, A. M., Neri, R., et al. 2008, MNRAS, 389, 45
- Coppin et al. (2009) Coppin, K. E. K., Smail, I., Alexander, D. M., et al. 2009, MNRAS, 395, 1905
- Coppin et al. (2010) Coppin, K., Pope, A., Menéndez-Delmestre, K., et al. 2010, ApJ, 713, 503
- Cowie et al. (2009) Cowie, L. L., Barger, A. J., Wang, W.-H., & Williams, J. P. 2009, ApJ, 697, L122
- da Cunha et al. (2008) da Cunha, E., Charlot, S., & Elbaz, D. 2008, MNRAS, 388, 1595
- da Cunha et al. (2015) da Cunha, E., Walter, F., Smail, I. R., et al. 2015, ApJ, 806, 110
- Daddi et al. (2009a) Daddi, E., Dannerbauer, H., Krips, M., et al. 2009a, ApJ, 695, L176
- Daddi et al. (2009b) Daddi, E., Dannerbauer, H., Stern, D., et al. 2009b, ApJ, 694, 1517
- Del Moro et al. (2013) Del Moro, A., Alexander, D. M., Mullaney, J. R., et al. 2013, A&A, 549, A59
- Dowell et al. (2014) Dowell, C. D., Conley, A., Glenn, J., et al. 2014, ApJ, 780, 75
- Elbaz et al. (2011) Elbaz, D., Dickinson, M., Hwang, H. S., et al. 2011, A&A, 533, A119
- Elbaz et al. (2017) Elbaz, D., Leiton, R., Nagar, N., et al. 2017, arXiv:1711.10047
- Eisenhardt et al. (2012) Eisenhardt, P. R. M., Wu, J., Tsai, C.-W., et al. 2012, ApJ, 755, 173
- Elvis et al. (1994) Elvis, M., Wilkes, B. J., McDowell, J. C., et al. 1994, ApJS, 95, 1
- Fender et al. (2004) Fender, R. P., Belloni, T. M., & Gallo, E. 2004, MNRAS, 355, 1105
- Fender & Gallo (2014) Fender, R., & Gallo, E. 2014, Space Sci. Rev., 183, 323
- Frey et al. (2016) Frey, S., Paragi, Z., Gabányi, K. É., & An, T. 2016, MNRAS, 455, 2058
- Geach et al. (2017) Geach, J. E., Dunlop, J. S., Halpern, M., et al. 2017, MNRAS, 465, 1789
- Gilli et al. (2011) Gilli, R., Su, J., Norman, C., et al. 2011, ApJ, 730, L28
- Gilli et al. (2014) Gilli, R., Norman, C., Vignali, C., et al. 2014, A&A, 562, A67
- Greene et al. (2006) Greene, J. E., Ho, L. C., & Ulvestad, J. S. 2006, ApJ, 636, 56
- Greve et al. (2008) Greve, T. R., Pope, A., Scott, D., et al. 2008, MNRAS, 389, 1489
- Guidetti et al. (2017) Guidetti, D., Bondi, M., Prandoni, I., et al. 2017, MNRAS, 471, 210
- Han & Han (2012) Han, Y., & Han, Z. 2012, ApJ, 749, 123
- Han & Han (2014) Han, Y., & Han, Z. 2014, ApJS, 215, 2
- Hatsukade et al. (2015) Hatsukade, B., Ohta, K., Yabe, K., et al. 2015, ApJ, 810, 91
- Huang et al. (2011) Huang, J.-S., Zheng, X. Z., Rigopoulou, D., et al. 2011, ApJ, 742, L13
- Huang et al. (2014) Huang, J.-S., Rigopoulou, D., Magdis, G., et al. 2014, ApJ, 784, 52
- Hopkins et al. (2006) Hopkins, P. F., Hernquist, L., Cox, T. J., et al. 2006, ApJS, 163, 1
- Hopkins et al. (2008) Hopkins, P. F., Hernquist, L., Cox, T. J., & Kereš, D. 2008, ApJS, 175, 356-389
- Ivison et al. (2010) Ivison, R. J. et al. 2010, A&A, 518, L31
- Ivison et al. (2016) Ivison, R. J., Lewis, A. J. R., Weiss, A., et al. 2016, ApJ, 832, 78
- Jones et al. (2015) Jones, S. F., Blain, A. W., Lonsdale, C., et al. 2015, MNRAS, 448, 3325
- Kalberla et al. (2005) Kalberla, P. M. W., Burton, W. B., Hartmann, D., et al. 2005, A&A, 440, 775
- Kauffmann et al. (2008) Kauffmann, G., Heckman, T. M., & Best, P. N. 2008, MNRAS, 384, 953
- Kawakatu & Wada (2009) Kawakatu, N., & Wada, K. 2009, ApJ, 706, 676
- Kennicutt (1998) Kennicutt, R. C., Jr. 1998, ARA&A, 36, 189
- Kriek et al. (2009) Kriek, M., van Dokkum, P. G., Labbé, I., et al. 2009, ApJ, 700, 221
- Laird et al. (2010) Laird, E. S., Nandra, K., Pope, A., & Scott, D. 2010, MNRAS, 401, 2763
- Liu et al. (2018) Liu, D., Daddi, E., Dickinson, M., et al. 2018, ApJ, 853, 172
- Lonsdale et al. (2015) Lonsdale, C. J., Lacy, M., Kimball, A. E., et al. 2015, ApJ, 813, 45
- Luo et al. (2017) Luo, B., Brandt, W. N., Xue, Y. Q., et al. 2017, ApJS, 228, 2
- Lutz et al. (2004) Lutz, D., Maiolino, R., Spoon, H. W. W., & Moorwood, A. F. M. 2004, A&A, 418, 465
- Magdis et al. (2012) Magdis, G. E., Daddi, E., Béthermin, M., et al. 2012, ApJ, 760, 6
- Meier (2003) Meier, D. L. 2003, New A Rev., 47, 667
- Michałowski et al. (2010) Michałowski, M., Hjorth, J., & Watson, D. 2010, A&A, 514, A67
- Michałowski et al. (2012) Michałowski, M. J., Dunlop, J. S., Ivison, R. J., et al. 2012, MNRAS, 426, 1845
- Morrison et al. (2010) Morrison, G. E., Owen, F. N., Dickinson, M., Ivison, R. J., & Ibar, E. 2010, ApJS, 188, 178
- Mullaney et al. (2011) Mullaney, J. R., Alexander, D. M., Goulding, A. D., & Hickox, R. C. 2011, MNRAS, 414, 1082
- Narayanan et al. (2010) Narayanan, D., Dey, A., Hayward, C. C., et al. 2010, MNRAS, 407, 1701
- O’Dea (1998) O’Dea, C. P. 1998, PASP, 110, 493
- Owen (2018) Owen, F. N. 2018, ApJS, 235, 34
- Peng et al. (2002) Peng, C. Y., Ho, L. C., Impey, C. D., & Rix, H.-W. 2002, AJ, 124, 266
- Piconcelli et al. (2015) Piconcelli, E., Vignali, C., Bianchi, S., et al. 2015, A&A, 574, L9
- Perera et al. (2008) Perera, T. A., Chapin, E. L., Austermann, J. E., et al. 2008, MNRAS, 391, 1227
- Polletta et al. (2007) Polletta, M., Tajer, M., Maraschi, L., et al. 2007, ApJ, 663, 81
- Pope et al. (2008) Pope, A., Chary, R.-R., Alexander, D. M., et al. 2008, ApJ, 675, 1171-1193
- Prieto et al. (2010) Prieto, M. A., Reunanen, J., Tristram, K. R. W., et al. 2010, MNRAS, 402, 724
- Radcliffe et al. (2016) Radcliffe, J. F., Garrett, M. A., Beswick, R. J., et al. 2016, A&A, 587, A85
- Richards et al. (2006) Richards, G. T., Lacy, M., Storrie-Lombardi, L. J., et al. 2006, ApJS, 166, 470
- Riechers et al. (2014) Riechers, D. A., Pope, A., Daddi, E., et al. 2014, ApJ, 786, 31
- Sanders et al. (1988) Sanders, D. B., Soifer, B. T., Elias, J. H., et al. 1988, ApJ, 325, 74
- Salvato et al. (2009) Salvato, M., Hasinger, G., Ilbert, O., et al. 2009, ApJ, 690, 1250
- Shu et al. (2016) Shu, X. W., Elbaz, D., Bourne, N., et al. 2016, ApJS, 222, 4
- Skelton et al. (2014) Skelton, R. E., Whitaker, K. E., Momcheva, I. G., et al. 2014, ApJS, 214, 24
- Stark et al. (2007) Stark, D. P., Bunker, A. J., Ellis, R. S., Eyles, L. P., & Lacy, M. 2007, ApJ, 659, 84
- Stark et al. (2009) Stark, D. P., Ellis, R. S., Bunker, A., et al. 2009, ApJ, 697, 1493
- Stern et al. (2014) Stern, D., Lansbury, G. B., Assef, R. J., et al. 2014, ApJ, 794, 102
- Schinnerer et al. (2008) Schinnerer, E., Carilli, C. L., Capak, P., et al. 2008, ApJ, 689, L5
- Smolčić et al. (2015) Smolčić, V., Karim, A., Miettinen, O., et al. 2015, A&A, 576, A127
- Stern et al. (2000) Stern, D., Djorgovski, S. G., Perley, R. A., de Carvalho, R. R., & Wall, J. V. 2000, AJ, 119, 1526
- Swinbank et al. (2004) Swinbank, A. M., Smail, I., Chapman, S. C., et al. 2004, ApJ, 617, 64
- Swinbank et al. (2006) Swinbank, A. M., Chapman, S. C., Smail, I., et al. 2006, MNRAS, 371, 465
- Takata et al. (2006) Takata, T., Sekiguchi, K., Smail, I., et al. 2006, ApJ, 651, 713
- Tamura et al. (2010) Tamura, Y., Iono, D., Wilner, D. J., et al. 2010, ApJ, 724, 1270
- Tan et al. (2014) Tan, Q., Daddi, E., Magdis, G., et al. 2014, A&A, 569, A98
- Terashima & Wilson (2003) Terashima, Y., & Wilson, A. S. 2003, ApJ, 583, 145
- Thomson et al. (2014) Thomson, A. P., Ivison, R. J., Simpson, J. M., et al. 2014, MNRAS, 442, 577
- Tozzi et al. (2006) Tozzi, P., Gilli, R., Mainieri, V., et al. 2006, A&A, 451, 457
- Tsai et al. (2015) Tsai, C.-W., Eisenhardt, P. R. M., Wu, J., et al. 2015, ApJ, 805, 90
- Vanzella et al. (2006) Vanzella, E., Cristiani, S., Dickinson, M., et al. 2006, A&A, 454, 423
- Vieira et al. (2013) Vieira, J. D., Marrone, D. P., Chapman, S. C., et al. 2013, Nature, 495, 344
- Wall et al. (2008) Wall, J. V., Pope, A., & Scott, D. 2008, MNRAS, 383, 435
- Walter et al. (2012) Walter, F., Decarli, R., Carilli, C., et al. 2012, Nature, 486, 233
- Wang et al. (2007) Wang, W.-H., Cowie, L. L., van Saders, J., Barger, A. J., & Williams, J. P. 2007, ApJ, 670, L89
- Wang et al. (2009) Wang, W.-H., Barger, A. J., & Cowie, L. L. 2009, ApJ, 690, 319
- Wang et al. (2010) Wang, W.-H., Cowie, L. L., Barger, A. J., Keenan, R. C., & Ting, H.-C. 2010, ApJS, 187, 251
- Wang et al. (2013) Wang, S. X., Brandt, W. N., Luo, B., et al. 2013, ApJ, 778, 179
- Wang et al. (2016) Wang, T., Elbaz, D., Schreiber, C., et al. 2016, ApJ, 816, 84
- Wilson & Colbert (1995) Wilson, A. S., & Colbert, E. J. M. 1995, ApJ, 438, 62
- Wu et al. (2012) Wu, J., Tsai, C.-W., Sayers, J., et al. 2012, ApJ, 756, 96
- Xue et al. (2011) Xue, Y. Q., Luo, B., Brandt, W. N., et al. 2011, ApJS, 195, 10
- Xue et al. (2016) Xue, Y. Q., Luo, B., Brandt, W. N., et al. 2016, ApJS, 224, 15
- Xue (2017) Xue, Y. Q. 2017, New A Rev., 79, 59
- Yang et al. (2014) Yang, G., Xue, Y. Q., Luo, B., et al. 2014, ApJS, 215, 27
- Younger et al. (2007) Younger, J. D., Fazio, G. G., Huang, J.-S., et al. 2007, ApJ, 671, 1531
- Yun et al. (2008) Yun, M. S., Aretxaga, I., Ashby, M. L. N., et al. 2008, MNRAS, 389, 333
- Yun et al. (2012) Yun, M. S., Scott, K. S., Guo, Y., et al. 2012, MNRAS, 420, 957