Finding a Zipf distribution and cascading propagation metric in utility line outage data
Abstract
Observed transmission line outage data is grouped into successive generations of events. The empirical distribution of the number of generations in the cascades follows a Zipf distribution that implies the increasing propagation as cascades progress. The slope of the Zipf distribution gives a System Event Propagation Slope Index (SEPSI). This new metric quantifies the cascade propagation, varies as expected, and determines the probabilities of small, medium, and large cascades.
I Introduction
Long sequences of cascading outages occasionally cause large blackouts of power transmission systems. The cascade sequence starts with initial outages and is followed by propagating outages [2]. Cascading risk mitigation should address both the initiation and propagation of outages, but there has been no single scalar metric that quantifies the propagation. We find in historical utility data that the distribution of the number of cascading generations characterizes the propagation, follows a Zipf distribution, and gives a new scalar metric of cascading propagation.
II Processing utility data into generations
The transmission line outage data consists of 10942 automatic line outages recorded over 14 years by a North American utility [3, 4]. The data includes the line outage start time to the nearest minute. This data is standard and routinely collected by utilities worldwide, such as in the Transmission Availability Data System (TADS) in North America [5, 6].
The historical outage data is grouped into cascades and generations based on the outage start time using the simple method described in [7]. An outage occurring more than one hour after the preceding outage is assumed to start a new cascade, and within each cascade a series of outages less than one minute apart are grouped into the same generation. Thus each cascade consists of a series of generations of outage events, with each generation containing one or more line outages that occur closely spaced in time. For example, outages caused by protection within one minute are grouped together in the same generational event. This processing produces 6687 cascades. The power system is usually resilient, so that most of these cascades are a single generation of outages that does not propagate further.
III Propagation of generations and the Zipf distribution of the number of generations
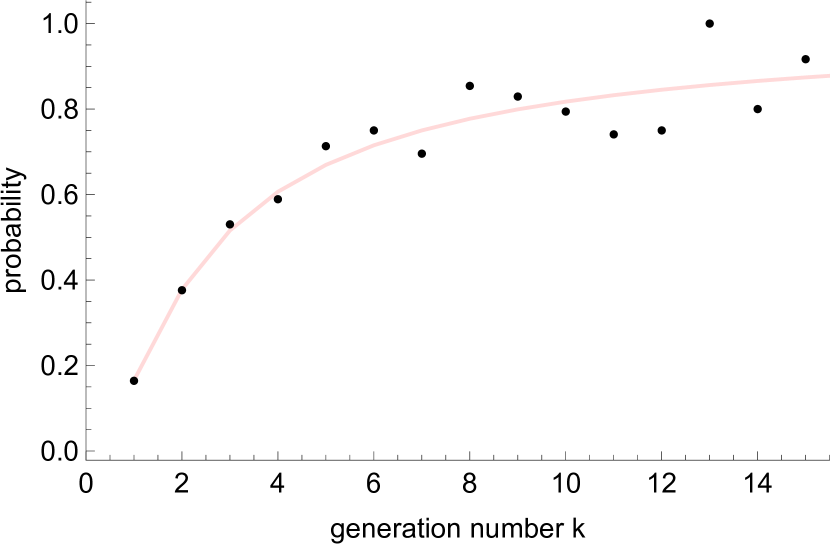
Instead of focussing on line outages as in previous work [7], here we analyze the propagation of generations of line outages. Suppose a cascade has at least generations of outages and let be the probability that generation propagates to produce a further generation . The dots in Fig. 1 show how the propagation increases with in the data.
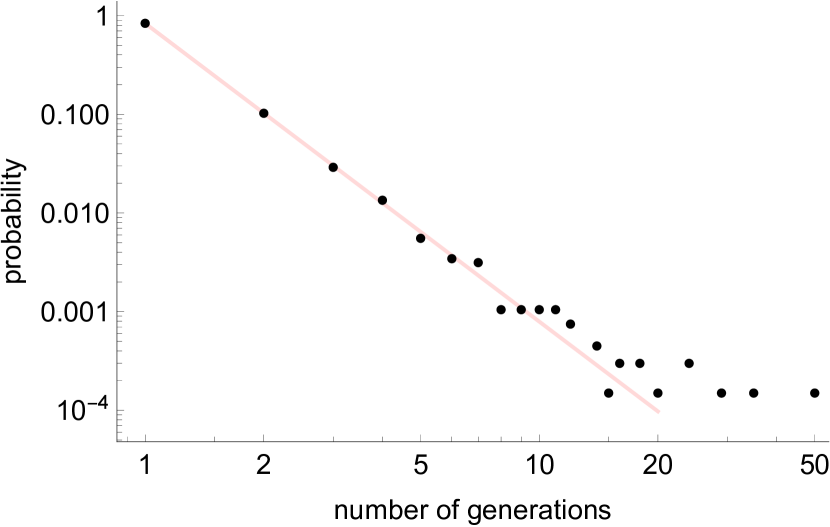
It is hard to characterize the increasing propagation in Fig. 1 with a single number. Let us look at the propagation of generations in a different way. In Fig. 2 the dots show the empirical distribution of the number of generations . The distribution of is linear on this log-log plot and is a Zipf distribution (or zeta distribution) of the form
| (1) |
where the slope of the line is and is the Riemann zeta function. Indeed, the maximum likelihood method of [8] fits the data with the line of slope shown in Fig. 2 and a Pearson test of goodness of fit shows consistency with the Zipf distribution with p-value 0.88.
Figs. 1 and 2 are different descriptions of the same propagation information, because the hazard function of (the probability of the cascade stopping at generation , given that generation has been reached) is . Indeed, the propagation implied by the fitted Zipf distribution of is indicated by the solid curve in Fig. 1. Note how this solid curve interpolates the more erratic estimates from the sparse data for the higher generations.
IV System Event Propagation Slope Index
We propose using the negative of the slope of the line fitted to the distribution of the number of generations on the log-log plot as a cascading metric called the System Event Propagation Slope Index (SEPSI). For example, the slope of the fitted line in Fig. 2 is , so that SEPSI . A lower value of SEPSI indicates a shallower slope and an increased probability of large cascades.
The data for all automatic outages can be divided into two parts according to whether the cascade occurs during a NOAA storm condition in the same weather zone, or during the summer months June to September, or during peak load hours 3 to 8 pm [9]. Table I shows SEPSI calculated for each condition. As expected, SEPSI is smaller and cascading is more severe for the stressed cases, with the lowest value of SEPSI achieved when there are storms. Moreover, as the condition varies, the distribution of the number of generations remains linear on the log-log plot, as shown by the Pearson p-values in Table I for the fit of the Zipf distribution.
We can use the Zipf distribution to deduce the probabilities of small, medium, and large cascades from SEPSI. These probabilities are conditional on a cascade starting. Define a small cascade as 3 or less generations, a medium cascade as 4 to 9 generations, and a large cascade as 10 or more generations (different cut-offs can be chosen). Then, substituting SEPSI for in (1), we compute the probabilities , , and as shown in Table I. As expected, varies with SEPSI by the largest factor.
To determine how many cascades need to be observed for a given accuracy of SEPSI, we bootstrapped samples from the Zipf distribution to find the approximate variation of the estimates of SEPSI. Suppose that there are cascades and SEPSI3.0 so that . Then we find that the 95% confidence interval of SEPSI is approximately . For example, with 95% confidence, 1000 cascades determine SEPSI within and within a factor of 1.5. 1000 cascades are needed for this accuracy because the larger cascades are rare. There are 782 cascades per year in our data, so that accumulating 1000 cascades takes 1.3 years.
V Conclusions
The number of generations of events in a cascade is an indication of cascade size and severity. We discover in utility line outage historical data that the distribution of the number of generations of events closely follows a Zipf distribution. This intriguing pattern in the data suggests using the negative of the slope of the Zipf distribution as a metric of cascading propagation, the System Event Propagation Slope Index or SEPSI. For our data the overall SEPSI is 3.0 and this reduces to 2.2 in the presence of storms. The probabilities of small, medium and large cascades can be computed from SEPSI. Observing roughly 1000 cascades seems to determine SEPSI and the probability of large cascades to a useful accuracy.
The results in this paper rely on line outages recorded by one utility. But there is a clear and testable possibility of generalization to cascading events of a variety of components in other power systems and other infrastructures. More general cascading events should be grouped into generations of events, and the empirical distribution of the number of the generations of cascading events should be obtained. If the distribution of the number of generations can be satisfactorily approximated by a straight line on a log-log plot, then the cascading propagation and the probabilities of small, medium, and large cascades can be quantified with SEPSI.
| condition | SEPSI | p-value | |||
|---|---|---|---|---|---|
| all | 3.0 | 0.88 | 0.967 | 0.029 | 0.005 |
| storms | 2.2 | 0.29 | 0.877 | 0.086 | 0.037 |
| no storms | 3.1 | 0.93 | 0.972 | 0.025 | 0.004 |
| summer | 2.9 | 0.98 | 0.961 | 0.033 | 0.006 |
| not summer | 3.2 | 0.91 | 0.976 | 0.021 | 0.003 |
| peak hours | 2.7 | 0.93 | 0.946 | 0.044 | 0.010 |
| non-peak hours | 3.1 | 0.94 | 0.972 | 0.025 | 0.004 |
| p-value indicates fit of data to Zipf distribution | |||||
We gratefully acknowledge funding from NSF grants 1609080, 1735354 and thank BPA for making outage data publicly available. The analysis and conclusions are strictly the author’s and not BPA’s.
References
- [1]
- [2] I. Dobson, D.E. Newman, Cascading blackout overall structure and some implications for sampling and mitigation, Intl. J. Elect. Power & Energy Systems, vol. 86, 2017, pp. 29-32.
- [3] BPA transmission services operations & reliability website http://transmission.bpa.gov/Business/Operations/Outages
- [4] I. Dobson et al., Obtaining statistics of cascading line outages spreading in an electric transmission network from standard utility data, IEEE Trans. Power Systems, vol. 31, no. 6, 2016, pp. 4831-4841.
- [5] NERC, Transmission Availability Data System (TADS) Data Reporting Instruction Manual, Aug. 2014.
- [6] J.J. Bian, S. Ekisheva, A. Slone, Top risks to transmission outages, IEEE PES General Meeting, National Harbor, MD USA, July 2014.
- [7] I. Dobson, Estimating the propagation and extent of cascading line outages from utility data with a branching process, IEEE Trans. Power Systems, vol. 27, no. 4, pp. 2146–2155, 2012.
- [8] M.L. Goldstein, S.A. Morris, G.G. Yen, Problems with fitting to the power-law distribution, European Phys. Journal B, vol. 41, pp. 255-258, 2004.
- [9] I. Dobson et al., Exploring cascading outages and weather via processing historic data, Hawaii Intl. Conf. System Sciences, Big Island, HI, Jan. 2018.