SMA Observations of Extended Emission in Interacting Galaxy NGC 3627
Abstract
We present moderate () and high angular resolution () observations of emission toward nearby, interacting galaxy NGC 3627 taken with the Submillimeter Array (SMA). These SMA mosaic maps of NGC 3627 reveal a prominent nuclear peak, inter-arm regions, and diffuse, extended emission in the spiral arms. A velocity gradient of – km s-1 is seen across the entire galaxy with velocity dispersions ranging from km s-1 toward the nuclear region to km s-1 in the spiral arms. We also detect unresolved line emission toward the nuclear region, southern bar end, and in a relatively isolated clump in the southern portion of the galaxy, while no line emission is detected at a rms noise level of 42 mJy beam-1 per 20 km s-1 channel. Using RADEX modeling with a large velocity gradient approximation, we derive kinetic temperatures ranging from – K (in the spiral arms) to K (at the center) and H2 number densities from 400–1000 cm-3 (in the spiral arms) to 12500 cm-3 (at the center). From this density modeling, we find a total H2 mass of , which is higher than previous estimates made using a constant H2–CO conversion factor but is largely dependent on the assumed vertical distribution of the CO gas. With the exception of the nuclear region, we also identify a tentative correlation between star formation efficiency and kinetic temperature. We derive a galactic rotation curve, finding a peak velocity of km s-1 and estimate a total dynamical mass of at a galactocentric radius of kpc ().
1 Introduction
In addition to being fascinating in their own right, nearby galaxies are crucial to the understanding of galaxy evolution and interactions. They allow us to directly resolve the region around active nuclei and individual star-forming clouds over the full galactic disk. This comprehensive view allows us to connect the small-scale physics of the interstellar medium (ISM) and star formation to the disk-wide processes that drive galaxy evolution. It is also well known that interactions and mergers are an important process in galaxy evolution as shown by the increased merger rate in the early Universe (e.g., Bridge et al., 2010). Gravitational interactions between galaxies significantly alter the morphology, luminosity, color, size, star formation rate, and mass distribution in a relatively short period of time. The NGC 3627 system is the natural choice for a representative nearby galaxy and interaction study because of its environmental richness and large suite of complementary data sets ranging from X-ray through radio wavelengths.
Most of the previous extragalactic molecular gas studies used the 12CO() line to trace molecular gas mass. With the recent abundance of 12CO() observations, a quantitative understanding of the 12CO() / 12CO() line ratio (R21/10) is required to compare results across the literature. Adding to the urgency of this, 12CO() and lines are now regularly observed from z 1–3 galaxies (e.g., Tacconi et al., 2013, 2018), where they are used (with assumptions) to trace the total gas supply. A quantitative understanding of the variation in the R21/10 line ratio is required to discern what is driving the changes in R21/10 observed on large (galaxy) scales as well as to make rigorous statements about the behavior of molecular gas across galaxy populations.
Additionally, observations of the full 12CO() distribution in the very outer arms and inter-arm regions of a spiral galaxy such as NGC 3627 are particularly informative. Typical spiral galaxies do not contain conspicuous 12CO() emission in the arm and inter-arm regions as observed in NGC 3627. Comparing this gas tracer with the large existing set of complementary data for NGC 3627 will provide a unique opportunity to study gas conditions in a very wide range of environments.
NGC 3627111A summary of basic astronomical information is presented in Table 1. (M66) is a spiral galaxy [RC3 type SAB(s)b; de Vaucouleurs et al. 1991] in the Leo Triplet galaxy group and displays signatures of a LINER/Seyfert 2-type nuclear activity in its spectrum (Ho et al., 1997; Peng et al., 1998). Optical broadband images of NGC 3627 reveal a weak optical bar, two prominent, asymmetric spiral arms, and large-scale dust lanes (Arp, 1966; Ptak et al., 2006). The perturbed morphology of the western arm, which appears to be displaced from the plane of the galaxy, provides evidence for recent interaction with neighboring galaxy NGC 3628 (e.g., Rots, 1978; Haynes et al., 1979; Soida et al., 2001). The close proximity () and high inclination () of NGC 3627 allow for an excellent view onto its spiral structure and pronounced dust patterns, making the galaxy an attractive candidate for investigating post-interaction galactic evolution. As a result, NGC 3627 has been studied in a wide range of continuum and spectroscopic observations – in H I (Zhang et al., 1993; Haan et al., 2008), CO (e.g., Reuter et al. 1996; Regan et al. 2001; Helfer et al. 2003; Kuno et al. 2007; Leroy et al. 2009; Warren et al. 2010; Morokuma-Matsui et al. 2015; Beuther et al. 2017; Jiménez-Donaire et al. 2017a; Cormier et al. 2018), H (Chemin et al., 2003), HCN / HCO+ (Krips et al. 2008; Murphy et al. 2015; Jiménez-Donaire et al. 2017b; Gallagher et al. 2018), UV (Calzetti et al., 2015), and X-ray emission (Georgantopoulos et al., 2002; Weżgowiec et al., 2012).
Multiple CO and radio continuum (327 MHz, 1.4 GHz, and 2.64 GHz) mapping observations (e.g., Paladino et al., 2008, 2009; Haan et al., 2009; Nikiel-Wroczyński et al., 2013) have revealed that the majority of molecular gas in the galaxy is localized in a narrow bar structure in width with emission peaking at the nuclear position and extending along the leading edges of the bar, forming two broad peaks at the bulge ends and trailing off into the spiral arms. However, in atomic H I emission, NGC 3627 appears to have a spiral structure free of any bar-like signatures (Haan et al., 2008; Walter et al., 2008). An inner ring (–) is also reported in 12CO() (Regan et al., 2002) and H (Chemin et al., 2003) observations. An elongated inner ring along the north-south direction is also seen in GALEX far-ultraviolet (FUV) emission ( Å; Gil de Paz et al., 2007) and surrounds a net depression in nuclear FUV emission with the 12CO bar-like structure being contained inside this FUV hole (Casasola et al., 2011). Molecular transitions from HCN and HCO+ have also been detected, indicating the presence of high density gas (Gao & Solomon, 2004; Krips et al., 2008; Murphy et al., 2015). Based on X-ray observations, Weżgowiec et al. (2012) proposed a recent collision of NGC 3627 and a dwarf companion galaxy to explain some of the spiral arm distortions.
NGC 3627 has a relatively high molecular gas fraction relative to other local star-forming galaxies (e.g., Casasola et al., 2004; Saintonge et al., 2011) with molecular gas mass being comparable to atomic gas (Helfer et al., 2003; Walter et al., 2008). Zhang et al. (1993) have suggested that the high H2/H I mass ratio of NGC 3627 is likely the result of tidal interaction and H I stripping by companion galaxy NGC 3628.
NGC 3627 exhibits X-ray characteristics reflective of a galaxy that has recently undergone a starburst (Dahlem et al., 1996). Intense star formation activity has been observed in the nucleus and at both ends of the galactic bar (Warren et al., 2010). Low levels of star formation have also been seen in H in the western arm, while the eastern arm contains a more vigorous star-forming region in its inner section (Smith et al., 1994). Higher velocity dispersions have been measured in the southern bar end relative to the northern end (e.g, Zhang et al., 1993; Chemin et al., 2003; Dumke et al., 2011). The southern bar end also has been found to exhibit double line profiles in CO (Beuther et al., 2017) as well as harbor an unexplained magnetic field orientation, which does not follow the underlying optical spiral arm structure (Soida et al., 2001). However, in a recent CO line analysis, Watanabe et al. (2011) found that the star formation rates of the southern and northern bar ends are elevated relative to all other regions of NGC 3627 but are not substantially different than one another. Beuther et al. (2017) conclude that the active star formation in the bar-arm interaction regions of NGC 3627 is the result of crossing gas orbits and colliding gas clouds, piling up dense gas that can then collapse and undergo intense star formation.
We present moderate () and high angular resolution () observations of and line emission toward NGC 3627 taken with the Submillimeter Array (SMA). These observations represent the most complete, in terms of overall spatial coverage and resolution, of 12CO () emission toward NGC 3627. In Section 2, we present the SMA observations and describe the imaging process. We discuss CO morphology and kinematics and present detailed emission maps in Section 3.1. In Section 3.2, we discuss the detection of the isotopologue and then we use RADEX modeling to derive physical properties of the molecular gas in Section 3.3. We derive a galactic rotation curve and dynamical mass estimates in Section 3.4 and summarize our results in Section 4.
| Property | Value | Ref. |
|---|---|---|
| R.A. (J2000) | 1 | |
| Dec. (J2000) | 1 | |
| Classification | SAB(s)b | 2 |
| Arm Class | Grand Design Spiral (7) | 3 |
| Nucleus | LINER/Sy2 | 4 |
| Distance (Mpc) | 5 | |
| Linear Scale (pc arcsec-1) | 51 | 5 |
| Inclination (∘) | 1 | |
| Position Angle (∘) | 1 | |
| Vhel () | 1 | |
| Stellar Mass () | 6 | |
| Orbital Mass () | 6 | |
| H2 Mass () | 7 |
2 Observations
2.1 Submilllimeter Array Observations
NGC 3627 was observed with the SMA222The Submillimeter Array is a joint project between the Smithsonian Astrophysical Observatory and the Academia Sinica Institute of Astronomy and Astrophysics and is funded by the Smithsonian Institution and the Academia Sinica. (Ho et al., 2004) between 2016 March 27 and 2017 May 31 in the sub-compact, compact, and extended configurations. All observations contained 7 or 8 antennas and covered a range of baseline lengths from – m. Observations consisted of a 32-point mosaic centered at R.A.(J2000) 11h20m15s and Dec.(J2000)12∘59′30′′ with half-beam spacing. In order to improve uv-coverage, these observations were repeated in different antenna configurations. The LO frequency was 224.92 GHz, which placed the 12CO () line in the upper sideband, and the 13CO () and C18O () lines in the lower sideband. For all observations, J1058015 and 3c274 were used as the primary phase and amplitude gain calibrators with absolute flux calibration performed by comparison to Callisto. Passband calibration used 3c273 for all observations, except 2017 Feb 6, which used 3c84.
The system temperature ranged from – depending on source elevation. At 1.3 mm, the SMA primary beam is (FWHP), and the largest recoverable scales for the array in the sub-compact, compact, and extended configurations are , , and , respectively. The total observed bandwidth ranged from 8 to 32 GHz, as these data were taken during the commissioning of a new correlator. Depending on the SMA correlator that was used, spectral resolution was either 0.8125 MHz or 140.0 kHz per channel. A complete summary of observations is given in Table 2.1.
| [-.3cm] UT Date | Config. | Number | Baseline Range | Calibrators | |||
|---|---|---|---|---|---|---|---|
| Antennas | (m) | (225 GHz) | Flux | Passband | Gain | ||
| 2016 Mar 27 | Compact | 7 | 20.3–81.4 | 0.05–0.07 | Callisto | 3c273 | J1058015, 3c274 |
| 2016 Mar 28 | Compact | 8 | 16.4–81.4 | 0.06 | Callisto | 3c273 | J1058015, 3c274 |
| 2016 Mar 29 | Compact | 8 | 16.4–81.4 | 0.04–0.07 | Callisto | 3c273 | J1058015, 3c274 |
| 2016 Apr 22 | Extended | 8 | 44.2–226.0 | 0.02–0.06 | Callisto | 3c273 | J1058015, 3c274 |
| 2017 Feb 6 | Sub-compact | 7 | 9.5–68.4 | 0.10–0.15 | Callisto | 3c84 | J1058015, 3c274 |
| 2017 May 31 | Sub-compact | 7 | 9.5–45.2 | 0.13–0.15 | Callisto | 3c273 | J1058015, 3c274 |
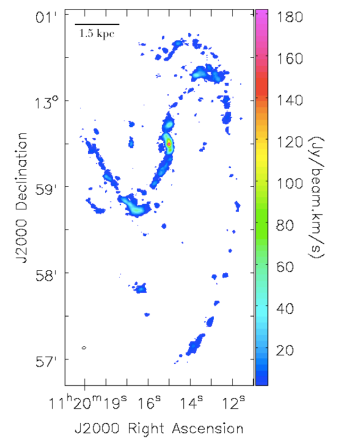
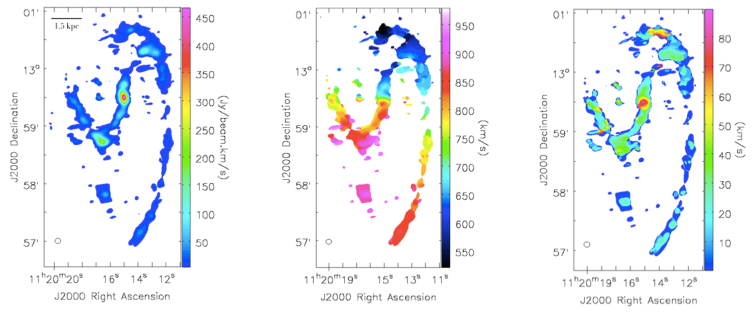
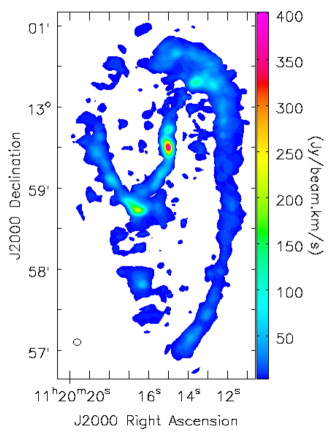
The SMA data were calibrated using the MIR software package333http://www.cfa.harvard.edu/cqi/mircook.html. The calibrated visibilities were then exported into CASA (McMullin et al., 2007) and the task tclean was used to Fourier transform the complex visibilities to create an image of the 12CO emission. The dirty image revealed prominent regions of line emission, which occur primarily in the nuclear bar and two extended spiral arms, and we used this information to supply an appropriate mask of width – tracing these regions. We adopt multi-scale cleaning, allowing model Gaussian components of width 0′′ (delta function), 6′′, 15′′, and 30′′. Figure 1 presents an SMA map of the 12CO emission in NGC 3627 obtained with natural weighting using a Briggs robust parameter of 2. This weighting scheme gives a synthesized beam of with PA, corresponding to a spatial resolution of about at the distance of NGC 3627. The leftmost panel of Figure 2 shows the same SMA data but weighted with an additional Gaussian uv-taper with an on-sky FWHM of 6′′. The taper was used to suppress the weight of the longer baselines and highlight the more diffuse, extended emission in the spiral arms of NGC 3627. The angular resolution of the map is 6.07 5.22′′ with PA93.29∘, which corresponds to an approximate physical size of and is approximately 8 larger than the beam size obtained with natural weighting alone. All maps were binned into 20 km s-1 velocity channels to enhance signal-to-noise. The typical rms noise levels per individual mosaic field on the natural-weighted and tapered maps are 14 and 20 , respectively. No conspicuous 230 GHz continuum emission was found in NGC 3627 down to a level in either the natural-weighted or tapered maps.
3 Results and Discussion
3.1 CO Emission and Morphology
3.1.1 Large-scale CO Distribution and Kinematics
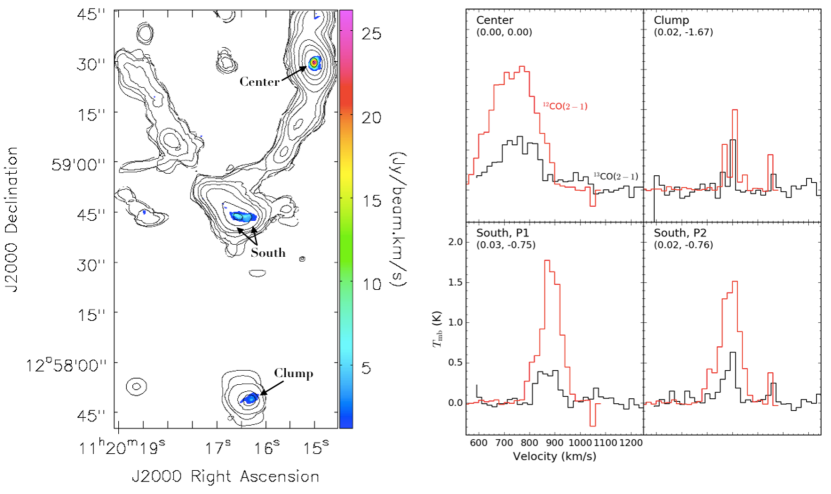
As seen in the integrated intensity maps in Figures 1 and 2, strong 12CO emission is detected in the central bar with two prominent emission regions located at the northern and southern regions of the bar, and from the nuclear region, respectively. Emission extending past the northern bar region can clearly be seen. Faint emission is also present in the more extended western spiral arm ( in length) and in the smaller eastern arm ( in length). A relatively isolated clump of emission (hereafter “the clump”) located to the south of the southern end of the bar is also clearly detected.
The 1st and 2nd moment maps, corresponding to intensity-weighted peak velocities and velocity dispersions, respectively, are presented in Figure 2 and reveal substantial kinematic structure. Velocity gradients of similar magnitudes () are present throughout the central bar as well as between the northern and southern regions of the bar. The spiral arms, particularly the extended western arm, display the largest gradients with velocities ranging from 500–900 km s-1. The broadest lines, as indicated by the moment-2 map, are found toward the integrated intensity peaks, namely the nuclear bar (–80 km s-1), the southern end of the bar (–50 km s-1), and the northern end of the bar (–35 km s-1). Velocity dispersions are typically narrow in the more extended spiral arms with typical dispersions of km s-1. The region of emission to the north of the northern bar end has particularly broad lines of up to km s-1.
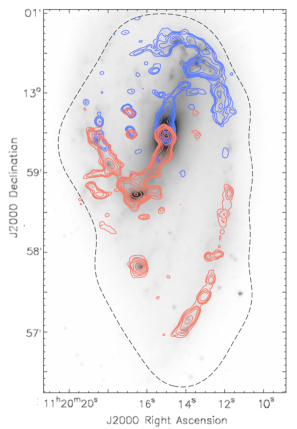
Figure 3 presents our SMA 12CO() emission overlaid on a Spitzer 3.6 m image, which traces the stellar component and is available due to the Spitzer Infrared Nearby Galaxies Survey project (SINGS; Kennicutt et al., 2003). Over the whole galaxy, the molecular gas roughly traces the stellar component. The contours, which indicate galactic rotation, are with respect to a systemic velocity of 744 km s-1 (Casasola et al., 2011). The spatial coverage up to 30% of the primary beam response of the SMA mosaic is shown as a black dashed line.
3.1.2 Nuclear Region
A strong nuclear H emission line initially identified the nucleus of NGC 3627 as undergoing some form of weak starburst (Filippenko & Sargent, 1985). More recent high-resolution maps of the 12CO() and 12CO() lines in the nuclear region of NGC 3627 by Casasola et al. (2011) reveal an bar-like inner structure with a PA= with two emission peaks at either ends of an elongated emission region. They also found that the stellar bar, traced by 1.6 m and 3.6 m Spitzer images, has a PA=, indicating that the gas is leading the stellar bar.
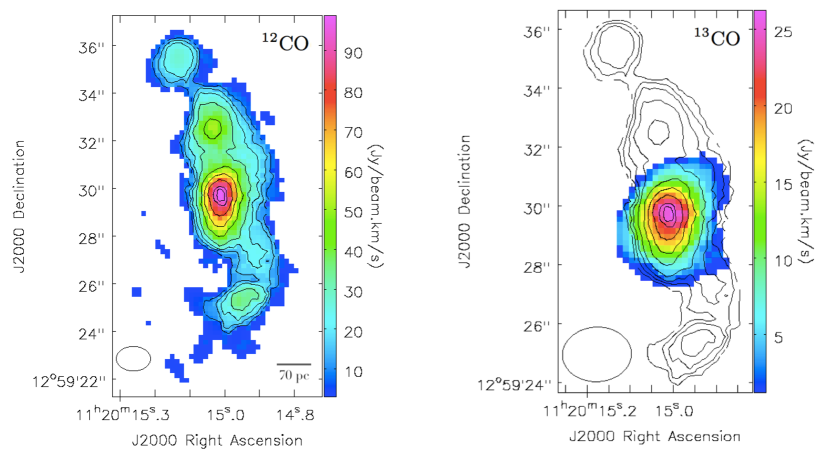
We imaged the central region of NGC 3627 using uniform weighting () to highlight small-scale features and a rectangular mask of width centered on the SMA phase center of NGC 3627, which resulted in a beam size of with PA and a typical rms noise level of mJy beam-1 per channel. The central 12CO() emission is shown in the left panel of Figure 4. While our beam size for the uniform weighting image is about 2.5 times larger than the high-resolution study made by Casasola et al. (2011), who had a 12CO() synthesized beam of (see their Figure 4), we successfully recover small-scale structures, namely two emission maxima offset from the central peak, as reported in Casasola et al. (2011).
3.2 Detection of 13CO() and Line Ratios
Emission from 13CO() was also detected in NGC 3627. The 13CO() line is generally optically thin and traces the molecular gas mass more accurately than the 12CO() emission, which often arises from the surface of molecular clouds. The 13CO() emission was imaged in the same way as described in Section 2 with natural weighting, which resulted in a beam size of with PA and a typical rms noise level of mJy beam-1 channel -1. Figure 5 shows the spatial distribution of detected 13CO() relative to the more extended 12CO() emission. The most prominent 13CO() emission is found in the nuclear region of NGC 3627, but additional emission is observed in the southern bar end and the clump. No 13CO() emission was detected around the northern bar end or in the more diffuse spiral arms. None of the 13CO() emission was spatially resolved and no emission from the C18O() line in NGC 3627 was detected down to a rms noise level of mJy beam-1 per channel.
The right panel of Figure 4 shows a zoomed-in image of the 13CO() emission in the central region of NGC 3627. While we do not resolve any spatial structure, we note that the nuclear 13CO() emission is coincident with the maximum peak in the 12CO() line.
Despite the limited detections of the 13CO() line, we were able to investigate the integrated-intensity line ratios at four different positions in the galaxy, as shown in the left panel of Figure 5. We extracted spectra averaged in an area equal to the beam size of the 13CO() emission, i.e. , in the center, south, and clump for both 13CO() and 12CO() transitions. The spectra were fit with single Gaussian profiles and the line ratios are reported in Table 3.2. While Tan et al. (2011) find an elevated line ratio of for the transition in the central region of NGC 3627, we find a ratio of , about one-fifth of this value, in the transition. The values in the southern bar end and the clump are also higher () than those for the transition. Similarly, Cormier et al. (2018) report ratios in excess of 10 for all galactocentric radii kpc, reporting a central of .
Since we are comparing our isotopic ratios for the transition with that of lower resolution observations of the line, the observed differences may be due to a beam-filling factor effect. It is possible that 12CO is much more diffuse and easily detectable everywhere (in the large beams), but the 13CO, which also probes intermediate density gas, may be more compact, which would tend to make the low resolution ratios appear larger. However, when we resolve structure, as in the SMA maps, and select regions where the emission fills the beam, the ratios would appear smaller.
| [-.3cm] | Location | ||||||||
|---|---|---|---|---|---|---|---|---|---|
| (′) | (′) | (K km s-1) | (km s-1) | (km s-1) | (K km s-1) | (km s-1) | (km s-1) | ||
| 0.00 | 0.00 | Center | 748.24 2.42 | 762.95 5.77 | 219.04 14.20 | 2.51 0.23 | |||
| 0.02 | 1.67 | Clump | 40.53 11.48 | 912.58 5.44 | 59.84 12.81 | 911.29 8.40 | 21.19 9.37 | 2.90 1.71 | |
| 0.03 | 0.75 | South, P1 | 169.73 9.31 | 894.96 1.64 | 93.33 3.87 | 40.62 6.88 | 881.71 4.90 | 90.09 11.53 | 4.18 0.74 |
| 0.02 | 0.76 | South, P2 | 142.54 9.61 | 902.29 1.95 | 90.10 4.59 | 33.41 6.07 | 902.14 3.28 | 56.15 7.72 | 4.27 0.83 |
Due to the low signal-to-noise spectral detections in the clump, the value in the clump has a high uncertainty (40%) and is somewhat difficult to interpret, but the values in the nucleus and southern bar end are well-constrained with uncertainties 20% and thus can be reliably compared. The denser, hotter region in the nucleus has a ratio that is lower than that of the more diffuse and cooler southern bar end. The simplest physical explanation for these observed changes is that the lines may probe slightly different material, i.e. the transition has a higher critical density (e.g., Shirley, 2015) and is probing denser and warmer gas. Since both lines are likely to be similarly excited (Davis, 2014), and in the absence of chemical effects like fractionation or nucleosynthesis, emission from the transition will occupy a smaller fraction of the beam.
Another likely driver of abundance ratios are changes in optical depth due to variations in gas physical conditions, such as gas density, temperature, and opacity (e.g., Pineda et al., 2008; Wong et al., 2008). By modeling the centers of active nuclei, Israel (2009a, b) found that different mixtures of two ISM components, one hot and tenuous with low optical depth and another that was cooler and denser, could explain the observed ranges of in nearby galaxies. This effect may be especially important in NGC 3627, as the presence of increased turbulence (for instance, induced by non-circular motions due to a stellar bar) lowers the optical depth of 12CO and increases that of 13CO (Cormier et al., 2018). Additionally, the largest line widths, as indicated by velocity dispersion, from both and lines of 12CO in NGC 3627 are seen in the nucleus.
Other effects besides optical depths could also be influencing these ratios (Cormier et al., 2018, and see references therein). For instance, since the southern bar end has a that is twice that of the nuclear region (Watanabe et al., 2011), significant 13CO may have been photodissociated by strong interstellar radiation fields of newly-forming OB stars in the south. Photodissociation is known to be selective as 13CO is preferentially destroyed as the UV radiation field increases in strength, while 12CO is mostly self-shielded (van Dishoeck & Black, 1988). However, recent simulations of molecular clouds show that selective photodissociation only has a minimal effect on the 12CO/13CO abundance ratio (Szücs et al., 2014), while Jiménez-Donaire et al. (2017a) also argue that shielding due to dust and H2 is more dominant than CO self-shielding but is still insufficient to drive the observed ratios.
The differences in values could also be a time-scale effect due to selective nucleosynthesis of 12C and changes in 12C/13C abundance (e.g., Wilson, 1999). Supernovae produce conspicuous 12C but insignificant amounts of 13C, which is instead primarily produced by low-mass stars and injected into the ISM from the winds of asymptotic branch stars (Sage et al., 1991). Starbursts can also lead to enhanced 12C abundances relative to 13C abundances (e.g., Meier et al., 2014; Sliwa et al., 2017). In fact, an increase in 12C/13C abundance ratio with galactocentric radius is seen in the Milky Way (Milam et al., 2005) and has successfully been reproduced by time-dependent models (Romano et al., 2017).
3.3 Radiative Transfer Modeling
3.3.1 Line Ratios Compared to BIMA Data
The relative integrated line intensities of the 12CO() emission, , and the 12CO() emission, provide valuable information about the local excitation conditions. We acquired the 12CO() data from the BIMA SONG444Berkley-Illinois-Maryland Association Survey of Nearby Galaxies survey (Regan et al., 2001; Helfer et al., 2003) from NED555The NASA/IPAC Extragalactic Database (NED) is operated by the Jet Propulsion Laboratory, California Institute of Technology, under contract with the National Aeronautics and Space Administration.. The large-scale 12CO() emission image was taken with the 10-element BIMA millimeter interferometer (Welch et al., 1996) and covers a field of .
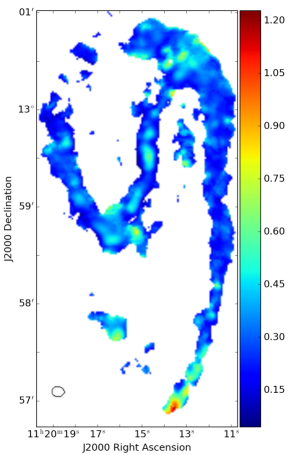
The BIMA 12CO() data were combined with single-dish data from the NRAO 12 m telescope on Kitt Peak, AZ (Regan et al., 2001), resulting in a beam size of and an rms noise level of 41 mJy beam-1 per 10 km s-1 channel (Helfer et al., 2003). Typical large-scale flux recovery attributable to the single-dish observations for NGC 3627 was – (Helfer et al., 2003). In order to ensure reliable comparisons with our SMA observations, we incorporated single-dish data from the HERACLES survey taken with the IRAM 30 m telescope (Leroy et al., 2009) to fill in the missing short uv spacings and remedy any “missing flux” issues to which interferometric images are often susceptible (e.g, Sakamoto et al., 1999). The CASA task feather was used to vary the relative weights of the 30 m and SMA observations for the optimal trade-off between angular resolution and restoration of missing flux. Most recovered flux was concentrated in the extended regions of NGC 3627 including the inter-arm regions and spiral arms with flux recovery ranging from – in the most diffuse regions. The SMAIRAM 30 m combined map, which is shown in Figure 6, has a resolution of and an rms noise level of 30 mJy beam-1 per 20 km s-1 channel.
To compute the line ratio /, we convolved our SMA data to the same resolution of the BIMA data. After both maps were each clipped at the level, we computed ratios for pixels with mutual 12CO emission. The resulting line ratio map is presented in Figure 7. The nuclear region exhibits typical line ratios of – over a relatively large physical scale, corresponding to the nuclear bar shown in Figure 4. The southern bar end has slightly lower ratios of –, while the northern end exhibits lower but comparable ratios of . The spiral arms contain primarily low-ratio gas of 0.2–0.3 with some of the more diffuse regions in the extended western arm having ratios as low as . The line ratios we report are consistent with previous studies, such as Casasola et al. (2011) who found that the bulk of nuclear emission was between 0.4–0.7 and with reported by Krips et al. (2008). We also note that the ratio map is not homogeneous with hot spots of elevated gas ratios appearing throughout the galaxy. For instance, we see clumps exhibiting ratios from 0.7–0.8 in the southern bar end and of 0.6 in the northern bar end, as well as numerous smaller, enhancements with typical ratios between 0.4–0.6 in the spiral arms and the inter-arm regions.
In general, as the galactocentric radius increases, decreases with two notable exceptions: the clump, which contains some moderate ratio gas (–) and the southernmost region of the extended western arm, which exhibits the highest ratio gas seen in NGC 3627. In the clump, we observe a sharp south-to-north transition with the southernmost gas having a moderate ratio of and the northernmost gas having extremely low ratio gas of . In the southern end of the western arm, we find ratios as high as 1.2 and typical ratios of –.
The high-to-moderate line ratios seen in the nuclear region and bar ends are likely the result of nuclear starburst (e.g., Filippenko & Sargent, 1985; Warren et al., 2010; Casasola et al., 2011) and bar-arm interactions (e.g., Beuther et al., 2017), respectively. However, the elevated ratios seen in the southern portions of the clump and in the extended western arm are more surprising. These enhancements in line ratios correspond to hot spots in the Spitzer 8m map (Kennicutt et al., 2003) and have been identified as regions of active star formation (Warren et al., 2010). Considering the interaction history of NGC 3627, these higher ratios are likely indicative of warm and dense molecular material triggered by tidal interaction with neighboring galaxy NGC 3628. Similar high-ratio 12CO gas has been observed by Muller et al. (2014) in the tidally perturbed tail of the Small Magellanic Cloud. While these hotspots in the southern tip of the western arm and clump do not appear as significant enhancements in physical conditions, especially (see the RADEX analysis in Section 3.3.2), we believe that this is a line width effect, i.e. the low line widths ( km s-1) in the outer spiral arms tend to lower the estimations of temperature and density, but these regions of high-excitation gas are nonetheless worthy of follow-up investigation.
3.3.2 Kinetic Temperature and Density
To estimate the physical properties of the molecular gas, we use a large velocity gradient (LVG) radiative transfer model (e.g., Scoville & Solomon, 1974; Goldreich & Kwan, 1974) to constrain excitation conditions throughout NGC 3627. We employ the RADEX code (van der Tak et al., 2007) with the myRadex666https://github.com/fjdu/myRadex solver for non-local-thermodynamic-equilibrium (non-LTE) conditions to generate a two-dimensional parameter grid with regularly-spaced kinetic temperatures () and H2 number densities (). We assume a uniform spherical geometry and fix the velocity gradient to a typical value of 10 km s-1 pc-1, since we noticed that both our kinetic temperatures and values were relatively insensitive to the choice of velocity gradient over a range of 1.0–60 km s-1 pc-1. Specifically, we generated CO intensities from models in logarithmic steps of 0.1 with kinetic temperatures ranging from K to K and H2 number densities between cm-3 and cm-3. The CO abundance is assumed to be (Blake et al., 1987) so we are sampling CO column densities between cm-2 and cm-2, which are consistent with typical galactic values (e.g., Pety et al., 2013; Muraoka et al., 2016; Hunt et al., 2017). All parameters were calculated assuming a cosmic microwave background radiation temperature of K. We have assumed a single velocity component and a beam filling factor of 1 throughout the analysis. The collision rates between CO and ortho-/para-H2 are extracted from LAMDA (Yang et al., 2010) and the ortho-/para-H2 ratios are calculated based on kinetic temperatures. We adopt a 10% uncertainty in the SMA and BIMA fluxes.
To incorporate additional kinematic information from our observations, we use the FWHM line widths taken from the SMA moment-2 map (i.e, FWHM) to generate additional two-dimensional grids of 8 different velocity dispersions ranging from 5 km s-1 to 75 km s-1 in steps of 10 km s-1 with each pixel being assigned to the nearest grid based on these intervals. Each grid velocity dispersion was treated as a representative midpoint with a range of km s-1, e.g., a pixel with velocity dispersion of 19 km s-1 would be assigned to a grid created with a of 15 km s-1. Pixels in the spiral arms and inter-arm regions that lacked SMA line widths and had been included from single-dish observations were assigned to the km s-1 grid, typical of the line widths seen in these more diffuse regions (e.g., rightmost panel of Figure 2).
We then used a customized routine (Zhang et al., 2014; Lu et al., 2017) to calculate the most likely beam-averaged gas kinetic temperatures and H2 number densities to reproduce the observed 12CO () and 12CO() integrated intensities as well as the observed line ratios. For each individual model, a value was calculated from the differences in the ratios of observed line brightness temperatures and those calculated from the LVG model. This process was then repeated for each pixel in the line ratio map shown in Figure 7. Further details of this procedure can be found in Zhang et al. (2014) and an example of its application is shown in Appendix A in Lu et al. (2017).
Figure 8 shows maps of the kinetic temperature and derived from RADEX modeling. The kinetic temperatures range from – K in the diffuse spiral arms to K in the nuclear region of NGC 3627. Elevated temperatures of – K are also found in the southern and northern bar ends. The derived values exhibit a similar trend, spanning more than an order of magnitude from – in the spiral arms to in the nuclear region. The values for are consistent with those derived using CO line ratios and an LVG approximation for other external galaxies, e.g., – K in the barred spiral galaxy NGC 2903, – K in the giant H II region NGC 604 in M 33 (Muraoka et al., 2012, 2016). Our kinetic temperature estimates are also roughly consistent with those derived by Tan et al. (2011), who report typical values of K in the northern and southern bar ends and a peak value of 44 K in the center of NGC 3627, which is about higher than our nuclear estimate. We also find values, especially those that correspond to the center and bar ends of NGC 3627, that are an order of magnitude in excess of those reported for NGC 2903 ( –; Muraoka et al., 2016) and NGC 604 (–; Muraoka et al., 2012).
The temperatures and densities derived from RADEX have uncertainties of , which include systematic errors from assumed CO abundance and column densities and random errors from observed fluxes and line widths. Determinations of were significantly more insensitive to uncertainties in fluxes or variations in line ratio values than , which may imply that the information provided from two low-J CO lines may be insufficient to well-constraint and that a larger, multiline study, like that of Zhang et al. (2014) would likely substantially improve estimations. In addition, the use of only two low excitation CO transitions in our RADEX modeling could be responsible for the relatively low ( K) temperatures seen in the spiral arms and inter-arm regions as well as a lower-than-expected nuclear temperature (e.g., Tan et al., 2011; Zhang et al., 2014).

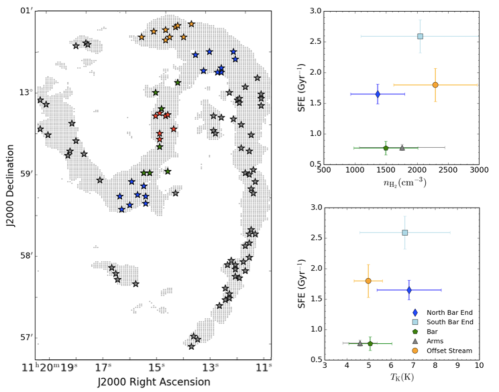
3.3.3 Correlations between SFE and Physical Parameters
We examine the dependence of star formation efficiency (SFE) on the physical parameters and by investigating potential correlations across different spatial regions in NGC 3627. We take the SFE values from Watanabe et al. (2011), who derive typical values for six different regions in NGC 3627 using integrated line intensities of the 12CO and 13CO transitions. As shown in Figure 8, there are order-of-magnitude spatial variations in and , which makes estimating typical values difficult. We separated our RADEX-derived maps of NGC 3627 into six representative regions considered by Watanabe et al. (2011), namely the center, bar, southern bar end, northern bar end, offset stream, and spiral arms. Then, we randomly sampled each region and recorded the values of and . To ensure consistency with Watanabe et al. (2011), we chose to sample the same number of pixels per region (see their Figure 4). Adopting a Monte Carlo (MC) approach, we repeated this random sampling for trials for each region. To estimate typical values and uncertainties for each region, we then computed the mean and standard deviation of all MC runs. The left panel of Figure 9 shows a representative MC trial with each color corresponding to a different sampling region.
We calculate Pearson’s correlation coefficients, which characterize linear relationships, to evaluate the significance of the correlations. We do not find correlations between either SFE- or SFE- with coefficients of and , respectively. However, the central data point is a substantial outlier both in terms of and and has the largest uncertainties . This nuclear uncertainty is explained, especially in the case of , by the abrupt and order-of-magnitude increase in density in the innermost 150 pc region of NGC 3627. In our MC trials, we are occasionally selecting values from this inner region (i.e., cm-3; ), which inflates standard deviations over the course of the MC trials.
If we exclude this outlying central data point, we find correlation coefficients of and for and , respectively. The former correlation between SFE and is significant at the 90% confidence level. If instead, we use the MC medians, which are typically 15–20% lower than the means, to represent characteristic and values when analyzing correlations, the values remain approximately the same and the significance of the SFE- correlation is unchanged. If we instead chose the peak values of and in each region, the SFE- correlation becomes more tentative () and the SFE- remains weak ().
Thus, as long as the nuclear value is excluded, the tentative correlation between and SFE is robust across several proxies for physical parameters in NGC 3627. Interestingly, we did not find a correlation between SFE and , such as the strong one seen in NGC 2903 (Muraoka et al., 2016). Such a correlation may have been expected, since molecular gas density is thought to control spatial variations in SFE, based on numerous previous studies with HCN (e.g., Gao & Solomon, 2004; Gao et al., 2007; Muraoka et al., 2009; Usero et al., 2015) and CO (e.g., Muraoka et al., 2016; Koyama et al., 2017). However, being an interacting galaxy, NGC 3627 may follow a more complex scaling relationship between and SFE. The reported correlations (and lack thereof) should be treated as somewhat speculative in nature and while interesting in their own right, deserve additional follow-up in NGC 3627 and across a larger set of galaxies with observations of large-scale, multiline 12CO emission.
3.3.4 Molecular Gas Estimates
By using 12CO() observations from the IRAM 30 m telescope along with an H2–CO conversion factor of cm-2, Casasola et al. (2011) derived an H2 mass of within the inner of the galaxy. To compare our modeling results, we sum all pixels in Figure 8 within the same region and normalize by the beamsize. We assume a column length of 440 pc (), which corresponds to the vertical FWHM of CO gas in edge-on spiral galaxy NGC 891 (Yim et al., 2011). We find , which is only % lower than the value derived by Casasola et al. (2011).
We can also estimate the total galactic H2 mass using the same method and find a total H2 mass estimate of . As we do not know the true vertical distribution of molecular gas in NGC 3627, the greatest uncertainty is related to the assumed column length. An uncertainty of in column length leads to a 10–15% uncertainty in total H2 mass. However, as we do not have detailed information about the three-dimensional structure of NGC 3627, this method represents the most reasonable estimate of total H2 mass that we can make. If we compare our mass determination to previous estimates of (Helfer et al., 2003) and (Kuno et al., 2007), we find that our estimates are about 50% larger. While we choose a representative CO FWHM from Yim et al. (2014) (see their Figure 14) from NGC 891 since it has a similar H2 mass as NGC 3627 (; Scoville et al., 1993), if we had instead chosen a FWHM of 250 pc as for NGC 5907 or pc as for NGC 4157 and NGC 4565, derived H2 mass estimates are and lower, respectively.
We can also estimate the mass of the isolated clump of 12CO emission. This isolated H II region has been observed in the transitions of HCN and HCO+ and is converting its molecular gas into stars more efficiently by a factor of 3 than either the star-forming regions in the southern bar end or nuclear disk (Murphy et al., 2015). There are also likely large reserves of ultra-dense gas surrounding this newly-formed H II region (Murphy et al., 2015), which makes it crucial to constrain the molecular mass in this region. Assuming the same vertical scale as above, we derive an H2 mass of .
Due to the abundance of independent H2 mass estimates of NGC 3627, we can also constrain the vertical height of its constituent molecular gas. To recover the that Casasola et al. (2011) estimated in the inner region of NGC 3627, we require an unusually large vertical height of pc, which implies that our RADEX calculations may be underestimating in the high-density, high-temperature nuclear region. Alternatively, the nuclear region of NGC 3627 may not be well-described by a constant H2–CO conversion factor, leading to differences in mass determinations. Similarly, the H2 mass estimate of , which was based on CO data from the Nobeyama 45 m telescope (Kuno et al., 2007), would require a uniform vertical extent in CO of 225 pc over the whole galaxy. While this is an order-of-magnitude estimation, especially since we are ignoring the complexities often seen in vertical molecular gas distributions, i.e. increasing scale height with galactocentric radius (e.g., Scoville et al., 1993), this finding is consistent with the – pc range in molecular gas FWHMs derived by Yim et al. (2014).
3.4 NGC 3627 Rotation Curve
We ran the kinemetry IDL routine (Krajnović et al., 2006) on the uv-tapered, moment-1 map of NGC 3627 to estimate a galactic rotation curve. The program performs a harmonic expansion of 2D moment maps along best-fitting ellipses to quantify line-of-sight velocity distributions and identify morphological and kinematic components. The inclination of each ellipse is based on the axial ratio via with (a circle) indicating a face-on inclination , while (a line) yields an edge-on inclination of . Thus, under this definition, the inclination of NGC 3627 would correspond to an of and .
We ran two iterations of kinemetry, one in which we fixed the inclination of all best-fitting ellipses to and another in which the inclination was a free parameter and allowed to vary for each ellipse. We allowed the position angles of the ellipses to vary for both iterations. We also restricted the radii of the best-fitting ellipses to only sample distances approximately equal to one-half of the smallest dimension of the beam size, i.e. . In order to fit larger galactocentric radii, we also relaxed the default ‘cover’ parameter from 0.75 to 0.4, which means that if less than 40% of the points along an ellipse are not present, the program will stop. We find systemic velocities of km s-1 and km s-1 as well as kinematic PAs of and for the fixed and free-to-vary kinemetry runs. The derived values and uncertainties are given as the mean and standard deviation, respectively, of the fitted ellipses. Both values are consistent with those derived by Casasola et al. (2011), although the freely-varying inclination iteration more closely recovers the expected of NGC 3627.
The systemic velocities derived from the 12CO emission are more consistent with 720 km s-1 obtained from the H I data from Haan et al. (2008). Casasola et al. (2011) report a systemic velocity that is redshifted by 24 km s-1 from 720 km s-1 and note that interacting galaxies and those with asymmetric H I morphology often exhibit discrepant 12CO and H I systemic velocities, such as the 50 km s-1 differences seen in NGC 4579 and NGC 5953 by Casasola et al. (2010) and García-Burillo et al. (2009), respectively. They attribute these differences to interaction history and the differing sensitivities of atomic and molecular gas to ram pressure effects (García-Burillo et al., 2009, and references therein). Despite our 20 km s-1 uncertainties on , the fact that our systemic velocity determinations are more consistent with those derived from H I implies that either ram-pressure effects may be overstated by Casasola et al. (2011) or there are differences in bulk velocity between the and transitions of 12CO. Since this latter effect was also seen in NGC 4579 by García-Burillo et al. (2009), who reported that the velocity centriod was blueshifted by 20 km s-1 from that of , it is difficult to definitively comment on the reasons for differences in systemic velocity determinations.
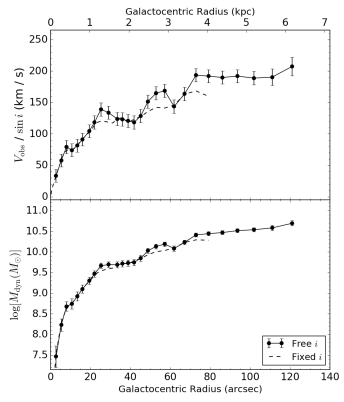
The top panel of Figure 10 shows the derived rotation curve with inclination-corrected velocities (). While both kinemetry runs estimate nearly the same velocities within 1 kpc, the fixed iteration finds velocities that are – km s-1 lower than the freely-varying run. Otherwise, the behavior of both rotation curves is essentially identical. The fixed rotation curve also only probes to a galactocentric radius of 4 kpc, while the freely varying iteration extends to a little past 6 kpc. The free-to-vary run probes further than the fixed run, because the script is permitted to alter the axial flattening ratio (i.e., the ellipse shape) for each best-fitting ellipse. Whenever the ellipses reach the edge of the moment-1 map, kinemetry can change their shapes to encompass more velocity values such that it is still consistent with the data and is able to fit additional higher-radii ellipses. However, the fixed run adopts a constant ellipse shape, which cannot be changed even as the ellipses reach the map edge, and thus, more quickly terminates as the cover parameter is exceeded.
For both runs, the signature of a rigidly rotating nuclear bar is seen in the first as well as several dips which likely correspond to non-circular motions at the transitional zones between the nucleus, inter-arm regions, bar ends, and spirals. For the freely varying run, a velocity of 190 km s-1 is achieved at kpc. After this point, the rotation curve levels off, increasing by a few tens of km s-1 at kpc, and reaching a peak of km s-1 at kpc.
We can estimate the dynamical mass within various radii via the formula , where is the mass in within radius , is in kpc, and is in km s-1, and is a factor which encodes the geometry of the system. We adopt , an intermediate value between a spherical distribution (1.0) and a flat dist (0.6), for consistency with Casasola et al. (2011). The bottom panel of Figure 10 shows dynamical mass at each galactocentric radius. Within , Casasola et al. (2011) found a dynamical mass estimate of , while we report an average at for the fixed and free inclination runs, respectively. However, Casasola et al. (2011) assumed an extrapolated maximum velocity of 180 km s-1 to estimate this value, while we have used a velocity of 114 km s-1 (fixed ) and 118 km s-1 (free ) at as determined by kinemetry. At 6.2 kpc, the furthest distance probed by the free run, we find a total dynamical mass of .
To estimate the entire dynamical mass of the galaxy, we assume a flat rotation curve at large radii, which is consistent with the flattening behavior we see out to a galactocentric radius of 6.2 kpc. We adopt the median velocity of km s-1 for all velocity estimates past 3.5 kpc, as this is when the rotation curve beings to flatten, as our maximum velocity. The furthest emission that we detect lies at , which is about 8.4 kpc from the galactic center. As we do not actually observe the rotational velocities at this distance, we report an upper limit to the total dynamical mass for NGC 3627 of .
4 Conclusions
We presented a 12CO() emission map for NGC 3627. Based on CO observations of the interacting spiral galaxy NGC 3627 with the SMA, we conclude the following:
-
•
We find enhanced emission and velocity dispersions in the nuclear region and bar ends with more diffuse emission and smaller dispersion in the spiral arms. We find a velocity gradient of – km s-1 across the entire galaxy.
-
•
We detected unresolved 13CO() emission in the galactic center, southern bar end, and in an isolated clump of emission in the south of NGC 3627. Typical integrated-line intensity ratios of 12CO / 13CO are – with elevated ratios corresponding to regions with higher . No C18O() emission was detected in NGC 3627 down to a rms noise level of 42 mJy beam-1 per 20 km s-1 channel.
-
•
Using archival BIMA 12CO(), we produced a line ratio map for NGC 3627. Moderate ratio gas (0.4–0.6) was found in the nuclear region and the bar ends, while the spiral and inter-arm regions often exhibited substantially lower ratios 0.2. High ratio gas was also observed in the southernmost end of the extended western arm ( 1.0) and in the clump (0.6–0.7), indicative of warm and dense molecular material likely due to previous tidal interaction with NGC 3628.
-
•
Using the and transitions of 12CO, we produced a map of beam-averaged kinetic temperature and at physical scales of 50 pc under non-LTE conditions. Kinetic temperatures ranged from – K in the spiral arms to K in the nuclear region. A similar trend was found for with values spanning 400–1000 cm-3 to 12500 cm-3.
-
•
For all regions except the center, we find a tentative SFE- correlation and no correlation between SFE and . Since molecular gas density is believed to control spatial variations observed in SFE, the lack of this latter correlation is potentially surprising but with the important caveat that our RADEX analysis based on two 12CO lines, i.e. and , may allow us to only probe a narrow range of gas volume densities.
-
•
We derived a rotation curve for NGC 3627 out to a galactocentric radius of kpc. Assuming an intermediate geometry between a flat disk and spherical distribution, we estimated dynamical mass as a function of galactocentric radius. By using the median velocity of km s-1 of the flat portion of the rotation curve at large galactocentric radius ( kpc), we report an upper limit of for the entire galaxy.
References
- Arp (1966) Arp, H. 1966, ApJS, 14, 1
- Beuther et al. (2017) Beuther, H., Meidt, S., Schinnerer, E., Paladino, R., & Leroy, A. 2017, A&A, 597, A85
- Blake et al. (1987) Blake, G. A., Sutton, E. C., Masson, C. R., & Phillips, T. G. 1987, ApJ, 315, 621
- Bridge et al. (2010) Bridge, C. R., Carlberg, R. G., & Sullivan, M. 2010, ApJ, 709, 1067
- Calzetti et al. (2015) Calzetti, D., Lee, J. C., Sabbi, E., et al. 2015, AJ, 149, 51
- Casasola et al. (2004) Casasola, V., Bettoni, D., & Galletta, G. 2004, A&A, 422, 941
- Casasola et al. (2010) Casasola, V., Hunt, L. K., Combes, F., et al. 2010, A&A, 510, A52
- Casasola et al. (2011) Casasola, V., Hunt, L. K., Combes, F., García-Burillo, S., & Neri, R. 2011, A&A, 527, A92
- Chemin et al. (2003) Chemin, L., Cayatte, V., Balkowski, C., et al. 2003, A&A, 405, 89
- Cormier et al. (2018) Cormier, D., Bigiel, F., Jiménez-Donaire, M. J., et al. 2018, MNRAS, 475, 3909
- Dahlem et al. (1996) Dahlem, M., Heckman, T. M., Fabbiano, G., Lehnert, M. D., & Gilmore, D. 1996, ApJ, 461, 724
- Davis (2014) Davis, T. A. 2014, MNRAS, 445, 2378
- de Vaucouleurs et al. (1991) de Vaucouleurs, G., de Vaucouleurs, A., Corwin, Jr., H. G., et al. 1991, Third Reference Catalogue of Bright Galaxies. Volume I: Explanations and references. Volume II: Data for galaxies between 0h and 12h. Volume III: Data for galaxies between 12h and 24h.
- Dumke et al. (2011) Dumke, M., Krause, M., Beck, R., et al. 2011, in Astronomical Society of the Pacific Conference Series, Vol. 446, Galaxy Evolution: Infrared to Millimeter Wavelength Perspective, ed. W. Wang, J. Lu, Z. Luo, Z. Yang, H. Hua, & Z. Chen, 111
- Elmegreen & Elmegreen (1987) Elmegreen, D. M., & Elmegreen, B. G. 1987, ApJ, 314, 3
- Filippenko & Sargent (1985) Filippenko, A. V., & Sargent, W. L. W. 1985, ApJS, 57, 503
- Gallagher et al. (2018) Gallagher, M. J., Leroy, A. K., Bigiel, F., et al. 2018, ApJ, 858, 90
- Gao et al. (2007) Gao, Y., Carilli, C. L., Solomon, P. M., & Vanden Bout, P. A. 2007, ApJ, 660, L93
- Gao & Solomon (2004) Gao, Y., & Solomon, P. M. 2004, ApJS, 152, 63
- García-Burillo et al. (2009) García-Burillo, S., Fernández-García, S., Combes, F., et al. 2009, A&A, 496, 85
- Georgantopoulos et al. (2002) Georgantopoulos, I., Panessa, F., Akylas, A., et al. 2002, A&A, 386, 60
- Gil de Paz et al. (2007) Gil de Paz, A., Boissier, S., Madore, B. F., et al. 2007, ApJS, 173, 185
- Goldreich & Kwan (1974) Goldreich, P., & Kwan, J. 1974, ApJ, 189, 441
- Haan et al. (2009) Haan, S., Schinnerer, E., Emsellem, E., et al. 2009, ApJ, 692, 1623
- Haan et al. (2008) Haan, S., Schinnerer, E., Mundell, C. G., García-Burillo, S., & Combes, F. 2008, AJ, 135, 232
- Haynes et al. (1979) Haynes, M. P., Giovanelli, R., & Roberts, M. S. 1979, ApJ, 229, 83
- Helfer et al. (2003) Helfer, T. T., Thornley, M. D., Regan, M. W., et al. 2003, ApJS, 145, 259
- Ho et al. (1997) Ho, L. C., Filippenko, A. V., & Sargent, W. L. W. 1997, ApJS, 112, 315
- Ho et al. (2004) Ho, P. T. P., Moran, J. M., & Lo, K. Y. 2004, ApJ, 616, L1
- Hunt et al. (2017) Hunt, L. K., Weiß, A., Henkel, C., et al. 2017, A&A, 606, A99
- Israel (2009a) Israel, F. P. 2009a, A&A, 506, 689
- Israel (2009b) —. 2009b, A&A, 493, 525
- Jiménez-Donaire et al. (2017a) Jiménez-Donaire, M. J., Cormier, D., Bigiel, F., et al. 2017a, ApJ, 836, L29
- Jiménez-Donaire et al. (2017b) Jiménez-Donaire, M. J., Bigiel, F., Leroy, A. K., et al. 2017b, MNRAS, 466, 49
- Karachentsev & Kudrya (2014) Karachentsev, I. D., & Kudrya, Y. N. 2014, AJ, 148, 50
- Kennicutt et al. (2003) Kennicutt, Jr., R. C., Armus, L., Bendo, G., et al. 2003, PASP, 115, 928
- Koyama et al. (2017) Koyama, S., Koyama, Y., Yamashita, T., et al. 2017, ApJ, 847, 137
- Krajnović et al. (2006) Krajnović, D., Cappellari, M., de Zeeuw, P. T., & Copin, Y. 2006, MNRAS, 366, 787
- Krips et al. (2008) Krips, M., Neri, R., García-Burillo, S., et al. 2008, ApJ, 677, 262
- Kuno et al. (2007) Kuno, N., Sato, N., Nakanishi, H., et al. 2007, PASJ, 59, 117
- Lee & Jang (2013) Lee, M. G., & Jang, I. S. 2013, ApJ, 773, 13
- Leroy et al. (2009) Leroy, A. K., Walter, F., Bigiel, F., et al. 2009, AJ, 137, 4670
- Lu et al. (2017) Lu, X., Zhang, Q., Kauffmann, J., et al. 2017, ApJ, 839, 1
- McMullin et al. (2007) McMullin, J. P., Waters, B., Schiebel, D., Young, W., & Golap, K. 2007, in Astronomical Society of the Pacific Conference Series, Vol. 376, Astronomical Data Analysis Software and Systems XVI, ed. R. A. Shaw, F. Hill, & D. J. Bell, 127
- Meier et al. (2014) Meier, D. S., Turner, J. L., & Beck, S. C. 2014, ApJ, 795, 107
- Milam et al. (2005) Milam, S. N., Savage, C., Brewster, M. A., Ziurys, L. M., & Wyckoff, S. 2005, ApJ, 634, 1126
- Morokuma-Matsui et al. (2015) Morokuma-Matsui, K., Sorai, K., Watanabe, Y., & Kuno, N. 2015, PASJ, 67, 2
- Muller et al. (2014) Muller, E., Mizuno, N., Minamidani, T., et al. 2014, PASJ, 66, 4
- Muraoka et al. (2012) Muraoka, K., Tosaki, T., Miura, R., et al. 2012, PASJ, 64, 3
- Muraoka et al. (2009) Muraoka, K., Kohno, K., Tosaki, T., et al. 2009, PASJ, 61, 163
- Muraoka et al. (2016) Muraoka, K., Sorai, K., Kuno, N., et al. 2016, PASJ, 68, 89
- Murphy et al. (2015) Murphy, E. J., Dong, D., Leroy, A. K., et al. 2015, ApJ, 813, 118
- Nikiel-Wroczyński et al. (2013) Nikiel-Wroczyński, B., Soida, M., Urbanik, M., et al. 2013, A&A, 553, A4
- Paladino et al. (2009) Paladino, R., Murgia, M., & Orrã, E. 2009, A&A, 503, 747
- Paladino et al. (2008) Paladino, R., Murgia, M., Tarchi, A., Moscadelli, L., & Comito, C. 2008, A&A, 485, 679
- Peng et al. (1998) Peng, C. Y., Ho, L. C., Filippenko, A. V., & Sargent, W. L. W. 1998, in Bulletin of the American Astronomical Society, Vol. 30, American Astronomical Society Meeting Abstracts, 1253
- Pety et al. (2013) Pety, J., Schinnerer, E., Leroy, A. K., et al. 2013, ApJ, 779, 43
- Pineda et al. (2008) Pineda, J. E., Caselli, P., & Goodman, A. A. 2008, ApJ, 679, 481
- Ptak et al. (2006) Ptak, A., Colbert, E., van der Marel, R. P., et al. 2006, ApJS, 166, 154
- Regan et al. (2002) Regan, M. W., Sheth, K., Teuben, P. J., & Vogel, S. N. 2002, ApJ, 574, 126
- Regan et al. (2001) Regan, M. W., Thornley, M. D., Helfer, T. T., et al. 2001, ApJ, 561, 218
- Reuter et al. (1996) Reuter, H.-P., Sievers, A. W., Pohl, M., Lesch, H., & Wielebinski, R. 1996, A&A, 306, 721
- Romano et al. (2017) Romano, D., Matteucci, F., Zhang, Z.-Y., Papadopoulos, P. P., & Ivison, R. J. 2017, MNRAS, 470, 401
- Rots (1978) Rots, A. H. 1978, AJ, 83, 219
- Sage et al. (1991) Sage, L. J., Henkel, C., & Mauersberger, R. 1991, A&A, 249, 31
- Saintonge et al. (2011) Saintonge, A., Kauffmann, G., Kramer, C., et al. 2011, MNRAS, 415, 32
- Sakamoto et al. (1999) Sakamoto, K., Okumura, S. K., Ishizuki, S., & Scoville, N. Z. 1999, ApJS, 124, 403
- Scoville & Solomon (1974) Scoville, N. Z., & Solomon, P. M. 1974, ApJ, 187, L67
- Scoville et al. (1993) Scoville, N. Z., Thakkar, D., Carlstrom, J. E., & Sargent, A. I. 1993, ApJ, 404, L59
- Shirley (2015) Shirley, Y. L. 2015, PASP, 127, 299
- Sliwa et al. (2017) Sliwa, K., Wilson, C. D., Aalto, S., & Privon, G. C. 2017, ApJ, 840, L11
- Smith et al. (1994) Smith, B. J., Harvey, P. M., Colome, C., et al. 1994, ApJ, 425, 91
- Soida et al. (2001) Soida, M., Urbanik, M., Beck, R., Wielebinski, R., & Balkowski, C. 2001, A&A, 378, 40
- Szücs et al. (2014) Szücs, L., Glover, S. C. O., & Klessen, R. S. 2014, Monthly Notices of the Royal Astronomical Society, 445, 4055. http://dx.doi.org/10.1093/mnras/stu2013
- Tacconi et al. (2013) Tacconi, L. J., Neri, R., Genzel, R., et al. 2013, ApJ, 768, 74
- Tacconi et al. (2018) Tacconi, L. J., Genzel, R., Saintonge, A., et al. 2018, ApJ, 853, 179
- Tan et al. (2011) Tan, Q.-H., Gao, Y., Zhang, Z.-Y., & Xia, X.-Y. 2011, Research in Astronomy and Astrophysics, 11, 787
- Usero et al. (2015) Usero, A., Leroy, A. K., Walter, F., et al. 2015, AJ, 150, 115
- van der Tak et al. (2007) van der Tak, F. F. S., Black, J. H., Schöier, F. L., Jansen, D. J., & van Dishoeck, E. F. 2007, A&A, 468, 627
- van Dishoeck & Black (1988) van Dishoeck, E. F., & Black, J. H. 1988, ApJ, 334, 771
- Walter et al. (2008) Walter, F., Brinks, E., de Blok, W. J. G., et al. 2008, AJ, 136, 2563
- Warren et al. (2010) Warren, B. E., Wilson, C. D., Israel, F. P., et al. 2010, ApJ, 714, 571
- Watanabe et al. (2011) Watanabe, Y., Sorai, K., Kuno, N., & Habe, A. 2011, MNRAS, 411, 1409
- Welch et al. (1996) Welch, W. J., Thornton, D. D., Plambeck, R. L., et al. 1996, PASP, 108, 93
- Weżgowiec et al. (2012) Weżgowiec, M., Soida, M., & Bomans, D. J. 2012, A&A, 544, A113
- Wilson (1999) Wilson, T. L. 1999, Reports on Progress in Physics, 62, 143
- Wong et al. (2008) Wong, T., Ladd, E. F., Brisbin, D., et al. 2008, MNRAS, 386, 1069
- Yang et al. (2010) Yang, B., Stancil, P. C., Balakrishnan, N., & Forrey, R. C. 2010, ApJ, 718, 1062
- Yim et al. (2011) Yim, K., Wong, T., Howk, J. C., & van der Hulst, J. M. 2011, AJ, 141, 48
- Yim et al. (2014) Yim, K., Wong, T., Xue, R., et al. 2014, AJ, 148, 127
- Zhang et al. (1993) Zhang, X., Wright, M., & Alexander, P. 1993, ApJ, 418, 100
- Zhang et al. (2014) Zhang, Z.-Y., Henkel, C., Gao, Y., et al. 2014, A&A, 568, A122