Capsule Networks for Protein Structure Classification and Prediction
Abstract.
Capsule Networks have great potential to tackle problems in structural biology because of their attention to hierarchical relationships. This paper describes the implementation and application of a Capsule Network architecture to the classification of RAS protein family structures on GPU-based computational resources. The proposed Capsule Network trained on 2D and 3D structural encodings can successfully classify HRAS and KRAS structures. The Capsule Network can also classify a protein-based dataset derived from a PSI-BLAST search on sequences of KRAS and HRAS mutations. Our results show an accuracy improvement compared to traditional convolutional networks, while improving interpretability through visualization of activation vectors.
1. Introduction
Proteins are responsible for most functions in our body. They are made as an extended chain of amino acids and fold into a 3D structure that determines their function (Dill and MacCallum, 2012). Determining their 3D structure is key to understanding how they work, why they cause diseases and how to design drugs to block or activate their functions (Schaffhausen, 2012). While experimental sequence generation is relatively cheap, it is challenging and expensive to classify and predict protein structure from sequences using experimental methods such as X-ray crystallography or NMR spectroscopy. Computational based prediction methods have the potential to reduce the burden cost of 3D protein structure analysis.
Convolutional Neural Networks (CNNs) have been applied to structural biology. This approach enables computers to classify proteins or predict their structures by modeling the way the human brain processes inputs of information through different layers of representation. However, the computational cost associated with training CNNs increases when the networks are provided with a large number of data channels as required in complex protein structural problems. In addition CNNs do not take into account important spatial hierarchies between simple and complex objects which is also very important in protein structure classifications. Finally, it is hard to explain the rationale behind CNN models’ decisions. Thus, enhancing model’s predictions with interpretability mechanisms is highly valuable.
Recently, Hinton et al. (Sabour et al., 2017) proposed Capsule Networks which introduce a new building block that can be used in deep learning to better model hierarchical relationships inside of internal knowledge representation of a neural network. This new development has the potential to help overcome the limitations of traditional CNNs when applied to protein structure problems.
In this paper, we discuss the implementation and interpretability improvements of a Capsule Network applied to structural biology. The contributions of this paper are twofold: (1) The implementation and application of a Capsule Network architecture to the classification of RAS protein family structures on GPU-based computational resources. The results show that the proposed Capsule Network trained on 2D and 3D structural encodings can successfully classify RAS family protein structures. The Capsule Network can also classify a protein-based dataset derived from a PSI-BLAST search on sequences of RAS mutations. (2) The implementation of mechanisms for step by step interpretability of activation vectors and post-hoc interpretability of the Capsule Network. The ultimate goal is to demonstrate how the network ensembles pieces of knowledge to arrive at specific decisions and why those decisions are made. The internal activation of capsules is visualized and the information encoded in the Capsule Network is used for explanatory purposes.
This paper is organized as follows: In Section II, a review of related work on the application and interpretability of deep learning models in protein structure classification and prediction is presented. In Section III, the data representation and implementation details of the Capsule Network are discussed. Experimental results are presented in Section IV. Finally, conclusions and future work are discussed in Section V.
2. Background and Related Work
In this section, we discuss the related work in two specific areas: The application of deep learning in structural biology and the interpretability aspects of deep learning networks.
2.1. Deep Learning in Structural Biology
Recently, the application of deep learning techniques in protein structure analysis has gained traction. For example, Zhou (Zhou and Troyanskaya, 2014) proposed a generative stochastic network (GSN) based method to predict local secondary structures. Spencer et al. (Spencer et al., 2015) proposed a protein structure predictor that uses deep learning network architectures combined with the position-specific scoring matrix generated by PSI-BLAST. They used a restricted Boltzmann machine based deep network. Wang et. al. (Wang et al., 2016) proposed DeepCNF, a deep learning extension of Conditional Neural Fields (CNF). AtomNet (Wallach et al., 2015) is a deep convolutional neural network that can be applied to the analysis of bioactivity of small molecules for drug discovery applications. MoleculeNet (Wu et al., 2018) expanded on AtomNet by adding many more features to each voxel, including partial charge and atomic mass. CNNs have also been used to recognize protein-ligand interactions (Ragoza et al., 2017; Gomes et al., 2017).
In spite of all these advances, CNNs cannot preserve spatial relationship between components of an object because, some features will be discarded during the pooling process. CNNs compensate this deficiency by increasing the number of training data, a process known as data augmentation. Capsule Networks (Sabour et al., 2017) have been proposed as a better approach to deep learning. A capsule is a group of neurons whose activation vector represents a specific type of entity. The length of the activation vector represents the probability that the entity exists and the orientation represents the instantiation parameters of the entity. Instead of using pooling to reduce dimensionality in CNNs, Capsule Networks implements a routing by agreement strategy in which outputs are sent to all parent capsules in the next layer. Each Capsule tries to predict the output of the parent capsules, and if this prediction conforms to the actual output of the parent capsule, the coupling coefficient between these two capsules increases. The work presented in this paper is a first approach to the application of capsule networks to structural biology. The results are promising and it opens a unique opportunity to explore issues related to interpretability of deep learning for computational structural biology.
2.2. Interpretability of Deep Learning Models
Deep learning models do not provide information on their internal processing actions. while deep neural networks may generate more accurate predictions by learning nonlinear interactions between input variables, at the same time it makes explaining deep learning models very difficult.
The are several interpretability works particularly in computer vision. Goferman et al. (Goferman et al., 2012) used saliency maps to highlight pixels of the input image that are more relevant to the output classification. However, pixels identified as salient regions are not necessarily the pixels being involved in making the predictions. In addition salient maps do not explicitly deal with hidden layers. Ribeiro et al (Ribeiro et al., 2016) proposed Local Interpretable Model-agnostic Explanations (LIME), which explains the prediction by approximating the original model with an interpretable model around several local neighborhoods. The Gradient-weighted Class Activation Mapping (Grad-CAM) (Selvaraju et al., 2016) approach is another explanation method for CNNs which uses gradient to obtain localization map as a visual explanation and finds important layers for each class. A summary of interpretability techniques is provided by Montaven et al. (Montavon et al., 2017). They evaluated the performance of several recently proposed techniques of interpretation.
In the context of protein discovery, Alipanahi et al (Alipanahi et al., 2015) used sensitivity analysis to evaluate the relevance nucleotide mutations in the neural network prediction. The result is a mutation map that shows binding variations within a sequence. Vidovic (C. Vidovic et al., 2016) proposed the Measure of Feature Importance (MFI), a metric that is intrinsically non-linear. It focuses on measuring how the interaction among features changes the prediction.
As we have pointed out previously, Capsule Networks exhibit more intrinsic interpretability properties, which is indeed a result of the routing-by-agreement algorithm. The instantiation parameter values of the activations vectors can be used to explain why the network detects certain features. Specifically, when all capsules of an object are in an appropriate relationship, the higher level capsule of that object should have a higher likelihood of activation.
3. Capsule Network Implementation
| Dataset | Loss | Hyperparameters |
|---|---|---|
| 2D KRAS-HRAS | categorical_hinge | filters = 64, kernel_size = 9 |
| primarycap_dim = 32, voxelcap_dim = 64 | ||
| 3D KRAS-HRAS | categorical_hinge | filters = 128, kernel_size = 7 |
| primarycap_dim = 32, voxelcap_dim = 64 | ||
| 2D PSI-BLAST | logcosh | filters = 512, kernel_size = 5 |
| primarycap_dim = 16, voxelcap_dim = 32 | ||
| 3D PSI-BLAST | logcosh | filters = 64, kernel_size = 5 |
| primarycap_dim = 16, voxelcap_dim = 32 |
In this section, we discuss the proposed Capsule Network architecture along with the data representation for a protein classification problem.
3.1. DataSets
The datasets used in this research are KRAS-HRAS and PSI-BLAST. The RAS family of proteins are of great interest in cancer research since these proteins are considered to be undruggable due to their lack of obvious cavities on their lobular surfaces (McCormick, 2015). RAS family of proteins which are related to 95% of the pancreatic cancer and 45% of colorectal cancer. The KRAS-HRAS dataset contains protein structures belonging to the KRAS and HRAS subfamilies of RAS. There is a total of 233 structures, 77 and 156 belonging to KRAS and HRAS respectively. The PSI-BLAST dataset contains protein structures obtained from a PSI-BLAST search using RAS sequences. This set was generated to test the ability of neural network to classify between RAS structures and structures that closely resemble RAS, but do not belong to the family. There is a total of 510 structures, 362 and 148 belonging to RAS and Non-RAS, respectively.
3.2. Data Representation
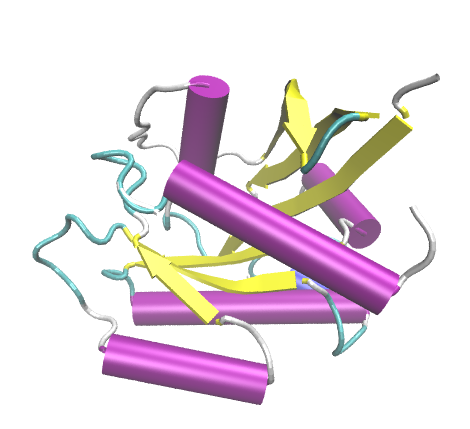
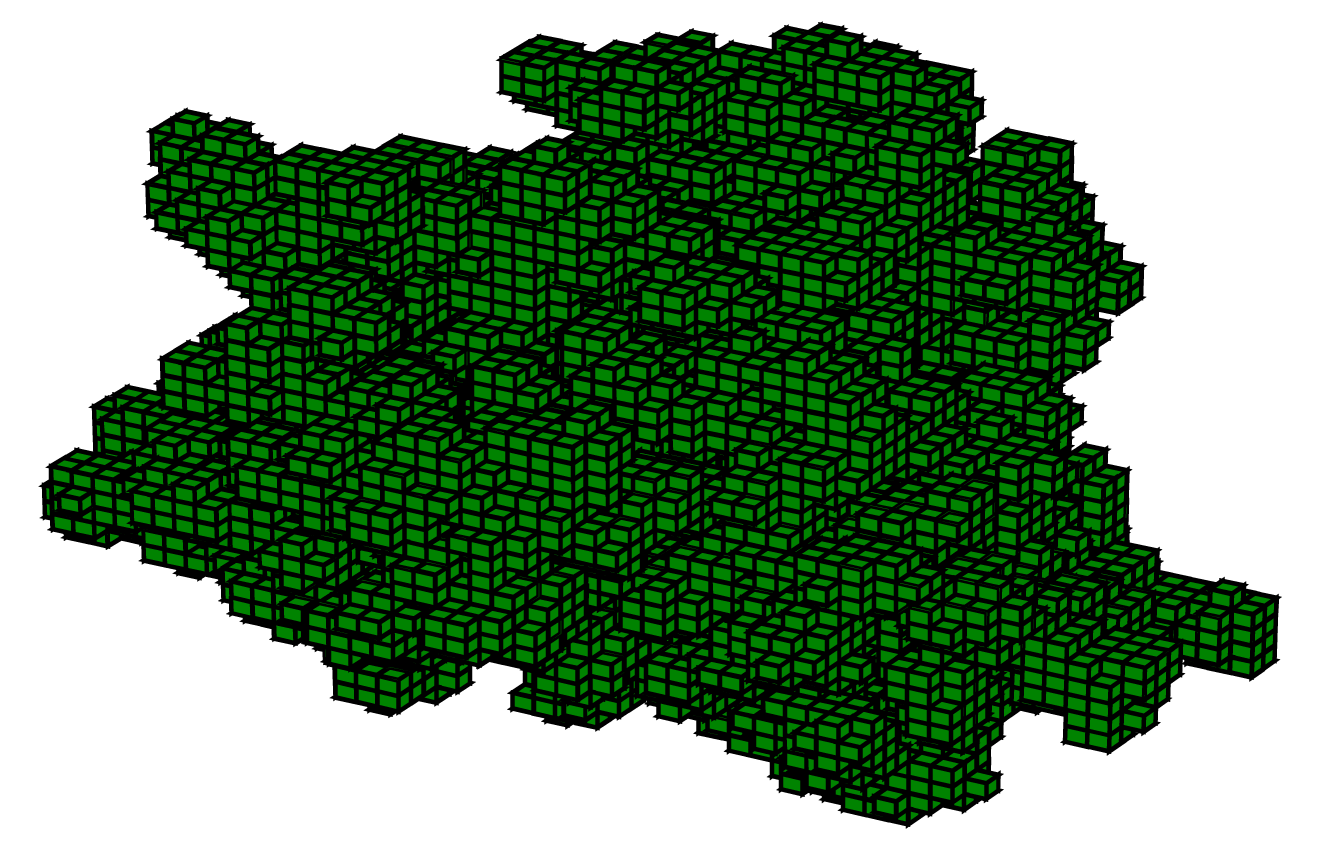
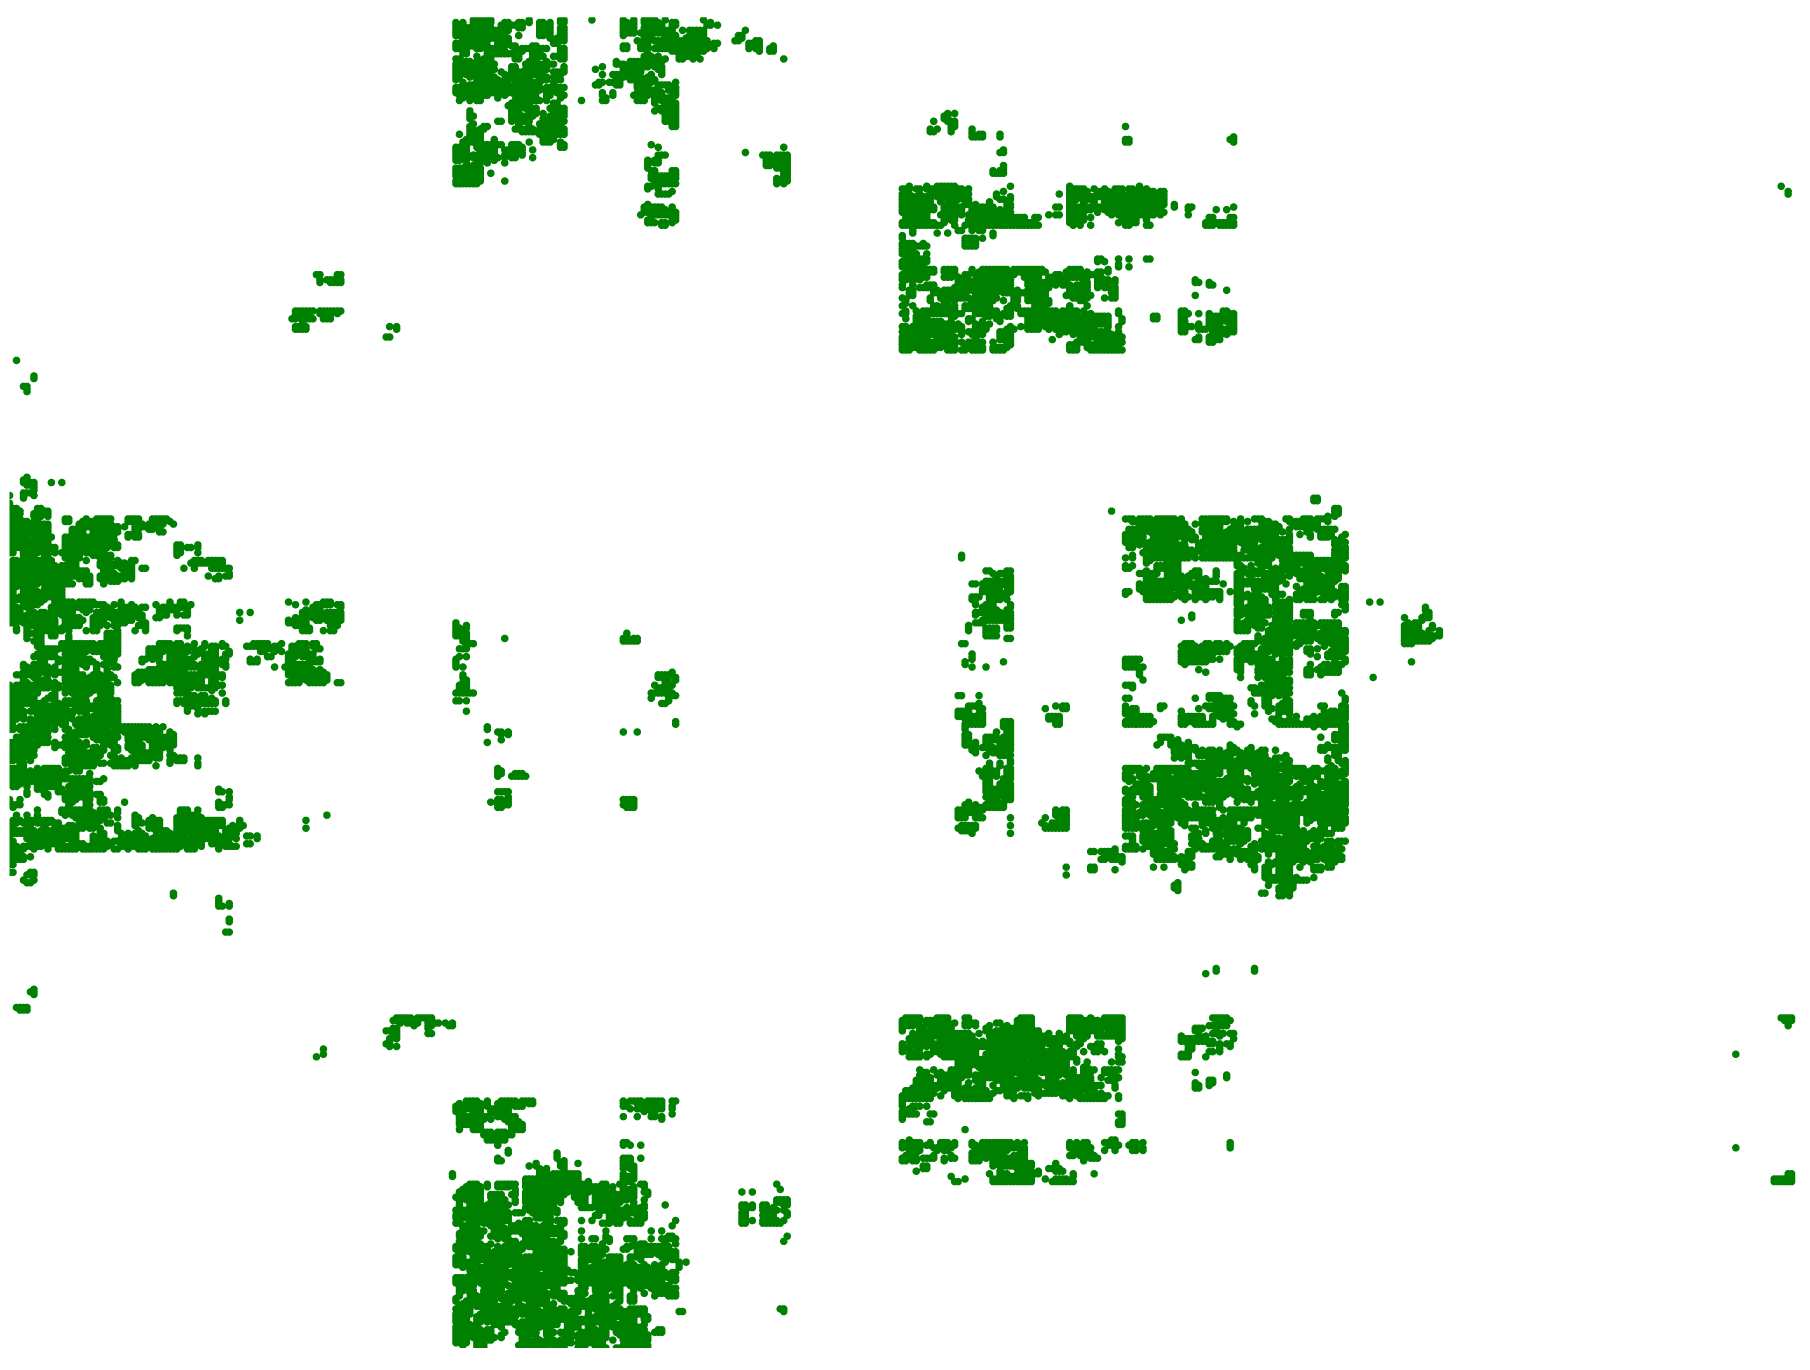
We use the approach proposed by Corcoran et al. (Corcoran et al., 2018) to encode 3D proteins from Protein Data Bank (PDB) files into 2D representations (voxel grid) by mapping a traversal of space-filling Hilbert curves. 3D PDB files are also easily transformed into 3D voxel cubes representations (no Hilbert curves mapping involved). These representations contain information of the atoms in the 3D protein structure, including the type of amino acid residue. These representations are the input data of our 2D and 3D Capsule Network implementations with a voxel grid (voxel size of 1Å) and a voxel cube, (voxel size of 1Å), respectively, and 8 channels of information. The 8 channel of information correspond to the following type of residues: aliphatic, aromatic, neutral, acid, basic, glycine, -carbon and -carbon.
Figures 1 to 3 show a cartoon representation of a RAS protein instance along with its 3D voxel representation and the corresponding 2D mapping.
3.3. Capsule Network implementation
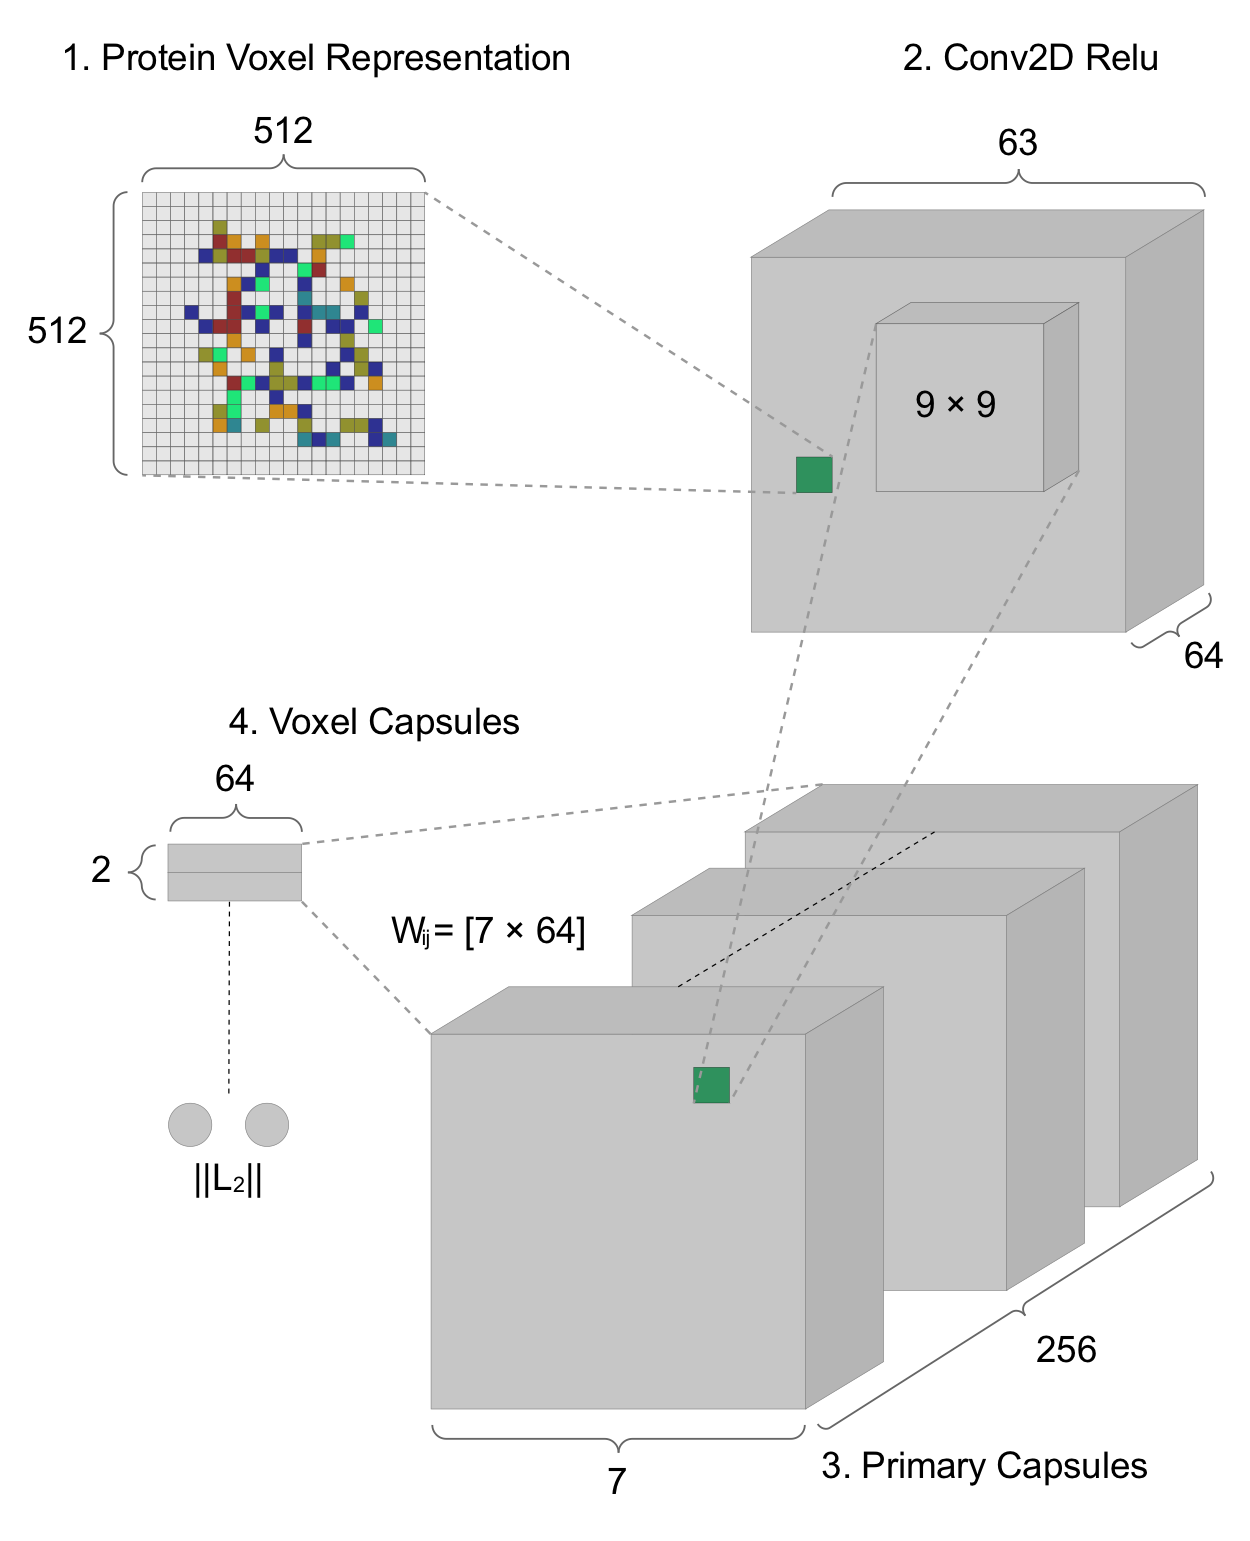
The proposed Capsule Network architecture is illustrated in Figure 4. The input data is fed into a convolutional layer that detects basic features of the voxel representations. The output of this layer is passed to the primary capsule layer where a combination of the features detected is produced. In this layer the data is fed into a convolutional sub-layer and then passed to a reshape sub-layer that prepares the data for the squash operation before it is passed to the voxel capsule layer. In the voxel capsule layer, the dynamic routing operation occurs with 3 routing iterations. Finally, the data is passed to a length layer where each capsule in the voxel capsule layer is replaced with its length. This length represents the probability of a voxel capsule matching the label of a protein (i.e. RAS or Non-RAS).
Hinton’s capsule Network architecture has a dense decoder at the end of the network for regularization purposes. In contrats, we do not use a decoder in our Capsule Network implementations due to scalability issues related to the size of our problem. Instead, we tested different combinations of loss functions, optimizers, and hyperparameters until our model reached acceptable results. The final selection of these functions and parameters are listed in Table 1. The categorical hinge (Rosasco et al., 2004) function performs a summatory over the all the incorrect categories and compares the score of the correct and incorrect categories. If the score of the correct category is greater than the score of the incorrect one by some margin, the loss is 0. Otherwise, the loss is obtained by subtracting the score of the correct category from the incorrect one and adding it to 1. This makes the hinge function suitable for our classification problem since it is binomial. The loss function is similar to the Huber loss function (Huber, 1964), but it can be differentiated twice everywhere. It is approximately equals to for small values of and to for large values of which avoid sensitivity to incorrect predictions.
| Parameter | Value |
|---|---|
| Learning Rate | 0.001 |
| Rho | 0.9 |
| Epsilon | None |
| Decay | 0.0 |
We use Root Mean Squared Propagation (RMSProp) as optimizer. RMSProp takes the sign of the last two gradients to increase or decrease the step size at which the decay is done by dividing the last gradient by the root mean squared of the moving average of the squared gradient for each weight. This is suitable for training, validating, and testing network models in batches as in our case where this was done batches of 1 sample. The values of the parameters for RMSProp are shown in Table 2. Five hyperparameters can be tuned including the dimensions of the primary and voxel capsules, number of filters, kernel size, and stride. The filters apply to the convolutional layer only. The kernel size applies to the convolutional and primary capsule layers while the primary and voxel dimensions apply to the primary capsule layer and voxel capsule layer respectively. In terms of the stride, it was set to 8 for all the datasets.
4. Results
4.1. Dataset 1: KRAS-HRAS
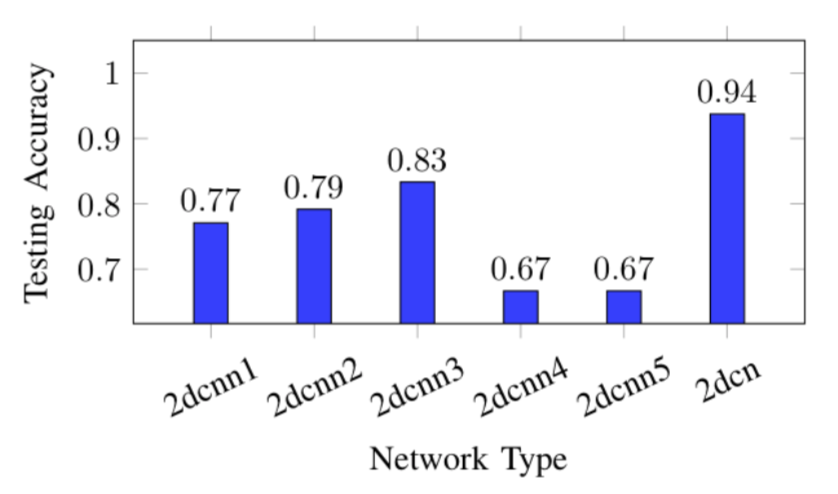
For baseline performance, five convolutional neural networks (Corcoran et al., 2018) classify 2D representations of KRAS or HRAS proteins with a testing accuracy between 0.67 and 0.83. Our Capsule Network implementation obtained a testing accuracy of 0.94 for that same dataset. In this case, both training and validation reached values of more than 0.95 between 4 epochs and 8 epochs. The loss reached its minimum at the ninth epoch during both training and validation.
Figure 5 shows the accuracy results for the 2D case. similar results of accuracy are obtained in other cases.
In addition, 3 convolutional neural networks (Corcoran et al., 2018) classify 3D representations of KRAS or HRAS proteins with a testing accuracy between 0.65 and 0.77. Our Capsule Network implementation obtained a testing accuracy of 0.93 for that same dataset. The accuracy in training and validation reached values of more than 0.95 between 4 epochs and 8 epochs. The loss reached its minimum at the ninth epoch during both training and validation.
4.2. Dataset 2: PSI-BLAST - RAS/Non-RAS
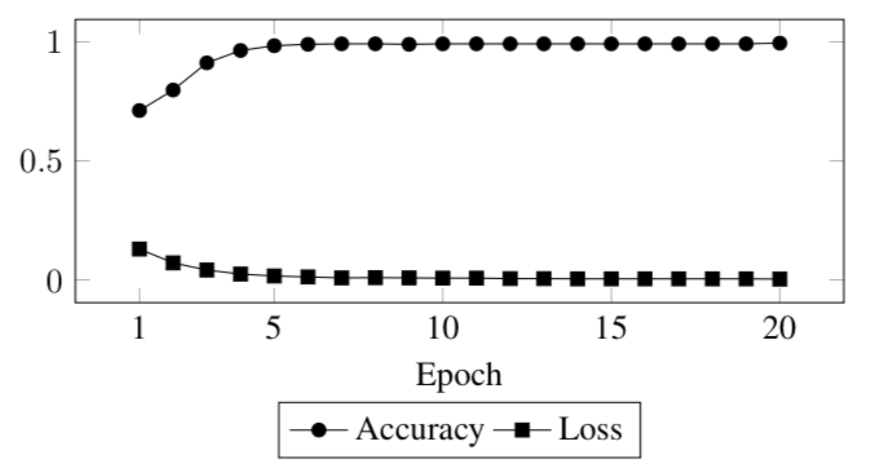
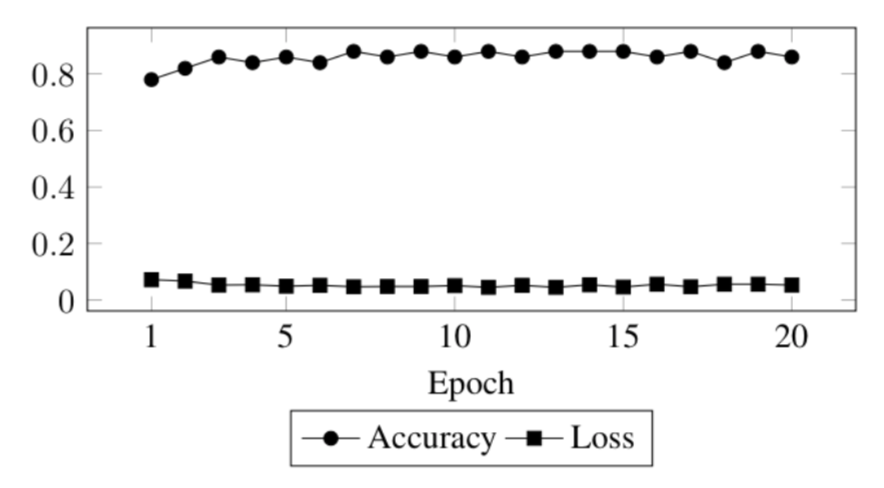
Five convolutional neural networks (Corcoran et al., 2018) classify 2D representations of RAS or Not- RAS proteins with a testing accuracy between 0.72 and 0.78. Our Capsule Network implementation obtained a testing accuracy of 0.87 for that same dataset. During training the network reached an accuracy of more than 0.95 after 3 epochs. However, during validation the accuracy reached a maximum of 0.88 and was steady between epochs 3 through 20 between 0.84 and 0.88. During training the loss began at 0.13 and stayed steady between 0.004 and 0.008 in epochs 10 through 20. During validation the loss began at 0.072 and stayed steady between 0.045 and 0.053 in epochs 3 through 20.
For the 3D case, 3 convolutional neural networks (Corcoran et al., 2018) classify 3D representations of RAS or Non-RAS proteins with a testing accuracy between 0.70 and 0.82. Our Capsule Network implementation obtained a testing accuracy of 0.85 for that same dataset. During training the network reached an accuracy of more than 0.95 after 3 epochs. However, during validation the accuracy reached a maximum of 0.92 and was steady between epochs 3 through 20 between 0.88 and 0.92. During training the loss began at 0.104 and stayed steady between 0.006 and 0.009 in epochs 12 through 20. During validation the loss began at 0.072 and stayed steady between 0.045 and 0.053 in epochs 3 through 20.
Accuracy and loss results are calculated in all cases. For example, Figures 6 and 7 show the results obtained for the accuracy and loss during training and validation in 20 epochs for the PSI-BLAST 2D dataset.
4.3. Runtime Performance
Tables 3 and 4 summarizes the testing accuracy and running time obtained by multiple neural network schemes on the 2D and 3D KRAS-HRAS dataset with and without data augmentation. Similarly, Tables 5 and 6 summarizes the testing accuracy and running time results for the 2D and 3D PSI-BLAST dataset. It is worth to note that in all cases the Capsule Network implementation does not require data augmentation to reach high accuracy and consequently the computational time is decreased compared to the Convolutional Neural Network with data augmentation.
| Network Type | Accuracy | Average Running Time (s) |
|---|---|---|
| CNN | 0.83 | 0.35 |
| CNN+DA | 0.84 | 14.5 |
| CN | 0.94 | 4.78 |
| CN+DA | 0.93 | 15.7 |
| Network Type | Accuracy | Average Running Time (s) |
|---|---|---|
| CNN | 0.77 | 0.46 |
| CNN+DA | 0.67 | 16.5 |
| CN | 0.92 | 6.65 |
| CN+DA | 0.92 | 17.9 |
| Network Type | Accuracy | Average Running Time (s) |
|---|---|---|
| CNN | 0.78 | 0.68 |
| CNN+DA | 0.83 | 28.0 |
| CN | 0.87 | 1.98 |
| CN+DA | 0.87 | 33.2 |
| Network Type | Accuracy | Average Running Time (s) |
|---|---|---|
| CNN | 0.82 | 1.98 |
| CNN+DA | 0.82 | 32.8 |
| CN | 0.85 | 27.8 |
| CN+DA | 0.85 | 36.4 |
4.4. Protein Structure Prediction
When predicting the classes of the samples in the two datasets, the accuracy of our model is calculated as follows:
| (1) | |||
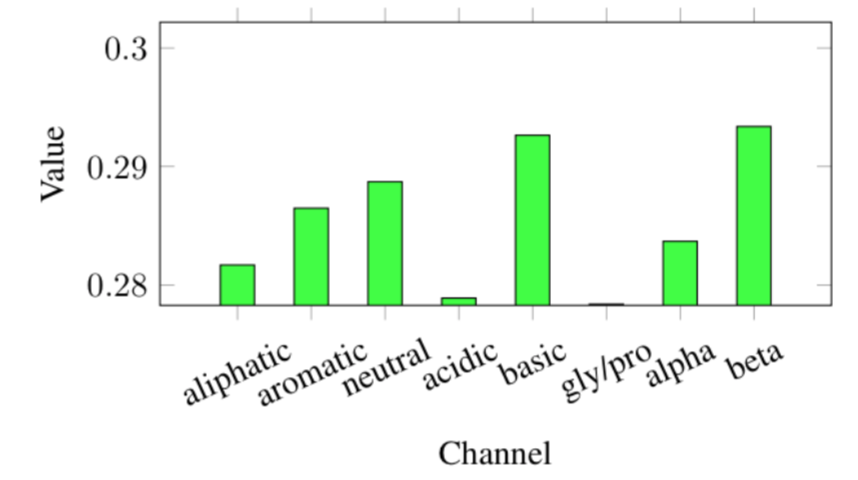
where is a vector with values that indicate if the ith prediction is correct. The magnitude of is equal to the number of samples used during testing for each dataset. Our 2D and 3D Capsule Network implementation obtained a prediction accuracy of 0.92 in both 2D and 3D KRAS-HRAS datasets while for the 2D and 3D PSI-BLAST datasets they obtained 0.68 and 0.84 respectively.
Figure 8 shows the scores per channel for an instance of the KRAS-HRAS dataset. a high score values means high probability to be predicted correctly as part of the channels of information in the protein instance.
4.5. Interpretability
To demonstrate the interpretability benefits of the Capsule Network implementation, we show how the activation vectors provide valuable information about the protein structure. After training the network, a specific PDB file is chosen and a modified version is created by changing information about some of its atoms (i.e. location in space, type of atom, etc.). Then, both the original and the modified versions are put through the network and their respective activation vectors are retrieved. Once obtained, the original output vectors are compared with the modified version’s by obtaining the distance between the individual elements and calculating the norm of the resulting vectors (one for each classification). This allows us to observe just how much each classification’s respective vector changes due to the modification made to the input, and therefore, analyze which parts of the input the network considers important for its classification.
Figure 9 shows cartoon representations generated in VMD of the original protein, found in PDB file 5XCO of the KRAS-HRAS dataset, and the protein after removing the alpha helix with residue ids 152 through 166.
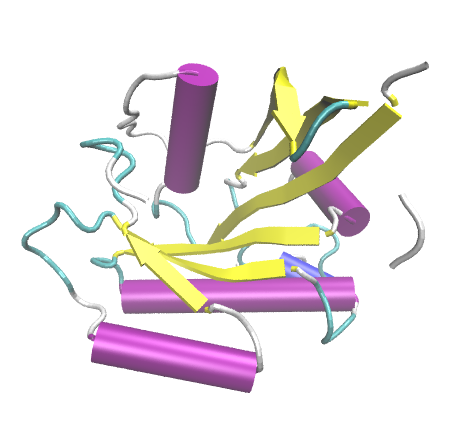
Table 7 shows how the classification changes with regards to specific changes in the protein and how the changes are reflected into the most significant components of the activation vectors.
| Change | Original | Modified | KRAS norm | HRAS norm |
| Removed Alpha Helix (87-104) | HRAS | HRAS | 5.20E-02 | 1.25E-01 |
| Removed Alpha Helix (66-74) | HRAS | HRAS | 0.17021 | 0.16162 |
| Removed Alpha Helix (152-166) | HRAS | KRAS | 1.0464 | 3.73E-03 |
| Removed Coil (117-126) | HRAS | KRAS | 1.0007 | 9.73E-01 |
| Removed Coil (144 -151) | HRAS | HRAS | 0.359 | 6.08E-01 |
4.6. Computational Resources
The results were generated using the Keras 2.2.0 API (Chollet et al., 2015) on top of the TensorFlow 1.8.8 (Abadi et al., 2016) computation backend. We used nodes at Chameleon Cloud (Mambretti et al., 2015) with 250GB of storage, 128GB of RAM, 48 Intel(R) Xeon(R) CPU E5-2670 v3 @ 2.30GHz, and two NVIDIA Tesla P100 GPU accelerators.
5. Conclusion and Future Work
In this work, we have discussed the implementation and application of a Capsule Network architecture to the classification of proteins. It shows the potential of Capsule Networks to tackle problems in structural biology. To the best of our knowledge, our team is the first one to apply Capsule Networks to this field. The results demonstrate a gain in accuracy of Capsule Networks when compared to traditional convolutional networks.
For future work, we plan to address the more complex problem of protein structure prediction using Capsule Networks. A typical computational approach to protein structure prediction is to sample the protein conformational space using a large number of 3D structures known as decoys. The quality of these decoys is evaluated and the most optimal decoys are selected. The proper selection of decoys becomes an important factor for an accurate protein structure prediction. The selection is done through scoring functions that combine certain features to provide an indicator of decoy quality. However, current scoring functions do not consistently select the best decoys. Deep learning offers great potential to improve decoy scoring by using sets of annotated decoys and learning the relations between the features and decoy quality. Moreover, it provides an opportunity to determine other features that may produce betters scores.
Acknowledgment
This work was supported in part by the U.S. Department of Energy under the Visiting Faculty Program (VFP), Berkeley Lab Undergraduate Faculty Fellowship (BLUFF) Program and the Sustainable Research Pathways (SRP) program. We thanks Dr. Xinlian Liu and Rafael Zamora-Resendiz for their feedback on this work. Computing allocations were provided through NSF funded Chameleon Cloud.
References
- (1)
- Abadi et al. (2016) Martín Abadi, Ashish Agarwal, Paul Barham, Eugene Brevdo, Zhifeng Chen, Craig Citro, Greg S Corrado, Andy Davis, Jeffrey Dean, Matthieu Devin, Sanjay Ghemawat, Ian Goodfellow, Andrew Harp, Geoffrey Irving, Michael Isard, Yangqing Jia, Rafal Jozefowicz, Lukasz Kaiser, Manjunath Kudlur, Josh Levenberg, Dan Mane, Rajat Monga, Sherry Moore, Derek Murray, Chris Olah, Mike Schuster, Jonathon Shlens, Benoit Steiner, Ilya Sutskever, Kunal Talwar, Paul Tucker, Vincent Vanhoucke, Vijay Vasudevan, Fernanda Viegas, Oriol Vinyals, Pete Warden, Martin Wattenberg, Martin Wicke, Yuan Yu, and Xiaoqiang Zheng. 2016. TensorFlow: Large-Scale Machine Learning on Heterogeneous Distributed Systems. (March 2016).
- Alipanahi et al. (2015) Babak Alipanahi, Andrew Delong, Matthew T Weirauch, and Brendan J Frey. 2015. Predicting the sequence specificities of DNA- and RNA-binding proteins by deep learning. Nat. Biotechnol. 33, 8 (Aug. 2015), 831–838.
- C. Vidovic et al. (2016) Marina M C. Vidovic, Nico Görnitz, Klaus-Robert Müller, and Marius Kloft. 2016. Feature Importance Measure for Non-linear Learning Algorithms. (Nov. 2016).
- Chollet et al. (2015) François Chollet and others. 2015. Keras. https://keras.io. (2015).
- Corcoran et al. (2018) Thomas Corcoran, Rafael Zamora-Resendiz, Xinlian Liu, and Silvia Crivelli. 2018. A Spatial Mapping Algorithm with Applications in Deep Learning-Based Structure Classification. (Feb. 2018).
- Dill and MacCallum (2012) Ken A Dill and Justin L MacCallum. 2012. The protein-folding problem, 50 years on. Science 338, 6110 (Nov. 2012), 1042–1046.
- Goferman et al. (2012) Stas Goferman, Lihi Zelnik-Manor, and Ayellet Tal. 2012. Context-aware saliency detection. IEEE Trans. Pattern Anal. Mach. Intell. 34, 10 (Oct. 2012), 1915–1926.
- Gomes et al. (2017) Joseph Gomes, Bharath Ramsundar, Evan N Feinberg, and Vijay S Pande. 2017. Atomic Convolutional Networks for Predicting Protein-Ligand Binding Affinity. (March 2017).
- Huber (1964) Peter J. Huber. 1964. Robust Estimation of a Location Parameter. Ann. Math. Statist. 35, 1 (03 1964), 73–101. DOI:http://dx.doi.org/10.1214/aoms/1177703732
- Mambretti et al. (2015) J. Mambretti, J. Chen, and F. Yeh. 2015. Next Generation Clouds, the Chameleon Cloud Testbed, and Software Defined Networking (SDN). In 2015 International Conference on Cloud Computing Research and Innovation (ICCCRI). 73–79.
- McCormick (2015) Frank McCormick. 2015. KRAS as a Therapeutic Target. Clin. Cancer Res. 21, 8 (April 2015), 1797–1801.
- Montavon et al. (2017) Grégoire Montavon, Wojciech Samek, and Klaus-Robert Müller. 2017. Methods for Interpreting and Understanding Deep Neural Networks. (June 2017).
- Ragoza et al. (2017) Matthew Ragoza, Joshua Hochuli, Elisa Idrobo, Jocelyn Sunseri, and David Ryan Koes. 2017. Protein–Ligand Scoring with Convolutional Neural Networks. J. Chem. Inf. Model. 57, 4 (April 2017), 942–957.
- Ribeiro et al. (2016) Marco Tulio Ribeiro, Sameer Singh, and Carlos Guestrin. 2016. Why should i trust you?: Explaining the predictions of any classifier. In Proceedings of the 22nd ACM SIGKDD international conference on knowledge discovery and data mining. 1135–1144.
- Rosasco et al. (2004) Lorenzo Rosasco, Ernesto De Vito, Andrea Caponnetto, Michele Piana, and Alessandro Verri. 2004. Are Loss Functions All the Same? Neural Comput. 16, 5 (May 2004), 1063–1076. DOI:http://dx.doi.org/10.1162/089976604773135104
- Sabour et al. (2017) Sara Sabour, Nicholas Frosst, and Geoffrey E Hinton. 2017. Dynamic Routing Between Capsules. In Advances in Neural Information Processing Systems 30, I Guyon, U V Luxburg, S Bengio, H Wallach, R Fergus, S Vishwanathan, and R Garnett (Eds.). Curran Associates, Inc., 3856–3866.
- Schaffhausen (2012) Joanna Schaffhausen. 2012. Advances in structure-based drug design. Trends Pharmacol. Sci. 33, 5 (May 2012), 223.
- Selvaraju et al. (2016) Ramprasaath R Selvaraju, Abhishek Das, Ramakrishna Vedantam, Michael Cogswell, Devi Parikh, and Dhruv Batra. 2016. Grad-CAM: Why did you say that? (Nov. 2016).
- Spencer et al. (2015) Matt Spencer, Jesse Eickholt, and Jianlin Cheng. 2015. A Deep Learning Network Approach to ab initio Protein Secondary Structure Prediction. IEEE/ACM Trans. Comput. Biol. Bioinform. 12, 1 (Jan. 2015), 103–112.
- Wallach et al. (2015) Izhar Wallach, Michael Dzamba, and Abraham Heifets. 2015. AtomNet: A Deep Convolutional Neural Network for Bioactivity Prediction in Structure-based Drug Discovery. (Oct. 2015).
- Wang et al. (2016) Sheng Wang, Jian Peng, Jianzhu Ma, and Jinbo Xu. 2016. Protein Secondary Structure Prediction Using Deep Convolutional Neural Fields. Sci. Rep. 6 (Jan. 2016), 18962.
- Wu et al. (2018) Zhenqin Wu, Bharath Ramsundar, Evan N Feinberg, Joseph Gomes, Caleb Geniesse, Aneesh S Pappu, Karl Leswing, and Vijay Pande. 2018. MoleculeNet: a benchmark for molecular machine learning. Chem. Sci. 9, 2 (Jan. 2018), 513–530.
- Zhou and Troyanskaya (2014) Jian Zhou and Olga G Troyanskaya. 2014. Deep Supervised and Convolutional Generative Stochastic Network for Protein Secondary Structure Prediction. (March 2014).