NICER Detection of Strong Photospheric Expansion during a Thermonuclear X-Ray Burst from 4U 182030
Abstract
The Neutron Star Interior Composition Explorer (NICER) on the International Space Station observed strong photospheric expansion of the neutron star in 4U 182030 during a Type I X-ray burst. A thermonuclear helium flash in the star’s envelope powered a burst that reached the Eddington limit. Radiation pressure pushed the photosphere out to , while the blackbody temperature dropped to . Previous observations of similar bursts were performed with instruments that are sensitive only above , and the burst signal was weak at low temperatures. NICER’s passband enables the first complete detailed observation of strong expansion bursts. The strong expansion lasted only , and was followed by moderate expansion with a apparent radius, before the photosphere finally settled back down at after the burst onset. In addition to thermal emission from the neutron star, the NICER spectra reveal a second component that is well fit by optically thick Comptonization. During the strong expansion, this component is six times brighter than prior to the burst, and it accounts for of the flux. In the moderate expansion phase, the Comptonization flux drops, while the thermal component brightens, and the total flux remains constant at the Eddington limit. We speculate that the thermal emission is reprocessed in the accretion environment to form the Comptonization component, and that changes in the covering fraction of the star explain the evolution of the relative contributions to the total flux.
Subject headings:
accretion, accretion disks — stars: neutron — stars: individual: 4U 1820-30 — X-rays: binaries — X-rays: bursts1. Introduction
Located in the globular cluster NGC 6624, 4U 182030 is an ultracompact X-ray binary with an orbital period of (Stella et al., 1987). Material of predominantly helium composition is accreted onto the neutron star (e.g., Cumming, 2003), where runaway thermonuclear burning powers the X-ray bursts that have been observed from this source since 1975 (Grindlay et al. 1976; for a recent review, see Galloway & Keek 2017). In the absence of hydrogen, nuclear burning proceeds rapidly, unhindered by waiting points from weak decays (e.g., Weinberg et al., 2006). Most fuel, therefore, burns at the onset, and a high peak luminosity is reached quickly. When the luminosity exceeds the Eddington limit, radiation pressure exceeds the gravitational pull, and photospheric radius expansion (PRE) is the result (Grindlay et al., 1980). During PRE, the luminosity remains near the Eddington limit. An increase in the emitting area due to expansion is, therefore, accompanied by a decrease of the photospheric temperature.
For most PRE bursts the observed blackbody radius increases by a factor of a few, whereas a small subset of PRE bursts exhibit strong expansion in excess of a factor (e.g., Galloway et al., 2008). A radius increase of a factor is referred to as “superexpansion” (in ’t Zand & Weinberg, 2010). Strong expansion may drive a wind from the neutron star (e.g., Ebisuzaki et al., 1983; Paczynski & Proszynski, 1986), and provide opportunities to constrain the neutron star’s compactness (e.g., van Paradijs & Lewin, 1987; in ’t Zand & Weinberg, 2010).
With instruments like the Proportional Counter Array (PCA; Jahoda et al., 2006) on the Rossi X-ray Timing Explorer (RXTE) the temperature decrease during the expansion leads to a substantial loss of signal out of the passband, producing a characteristic dip in the burst light curve (Paczynski, 1983). For the strongest expansion, the spectral parameters could not be reliably measured. The passband of the Neutron Star Interior Composition Explorer (NICER; Gendreau & Arzoumanian, 2017) on the International Space Station, however, extends down to , making it an ideal instrument to study strong expansion at high time resolution. Older instrumentation with a similar passband has observed bursts with at most moderate expansion (e.g., in ’t Zand et al., 2013).
In this Letter we study the first strong PRE burst from 4U 182030 detected with NICER. The instrument and observations are introduced in Section 2. Time-resolved spectroscopy shows that NICER can track the thermal burst emission as well as a Comptonization component throughout the expansion phase (Section 3). For the first time we can test models of expansion and wind generation (Section 4), and we discuss the prospects for future NICER studies of strong radius expansion bursts (Section 5).
2. Observations
In August 2017, 4U 182030 was in the hard spectral state (Section 3.1), and over days NICER observed the source for a total good exposure of ks. Five bursts were detected, each with a short duration () and a high peak count rate (). We perform a detailed analysis of the first burst in ObsID 1050300108 on MJD 57994.37115 (2017 August 29).
The X-ray Timing Instrument (XTI; Gendreau et al., 2016) on board NICER employs co-aligned X-ray concentrator optics and silicon-drift detectors (Prigozhin et al., 2012), with in operation. This configuration enables the detection of X-ray photons in the passband at high time resolution and energy resolution, with a peak effective area of at . We create XTI spectra with Heasoft version 6.22.1 and Nicerdas 2017-09-06_V002. The spectra are analyzed with Xspec 12.9.1p (Arnaud, 1996) and version 0.06 of the NICER response files. As background we use the blank-field spectrum of Keek et al. (2018), which is appropriate for the conditions of our observation with a low particle background and the ISS being on the night-side of the Earth. For our analysis, we group neighboring spectral bins to ensure a minimum of counts per bin.
3. Results
3.1. Persistent Emission
The burst happened near the start of the NICER pointing. Therefore, we characterize the persistent emission using a interval at the end of the pointing. We extract a spectrum in the band with counts (see Figure 2 below). Following the broadband analysis by Costantini et al. (2012), we fit the persistent emission with a combination of a Planck model (bbodyrad in Xspec) and a Comptonization component (compTT; Titarchuk 1994a). The Tübingen-Boulder model (TBabs) for interstellar absorption is employed with abundances from Wilms et al. (2000). The fit exhibits residuals near the instrumental edges around and . This indicates a small shift in the gain that is not included in the current model of the instrument response. We use Xspec’s gain model to optimize the energy scale of our data, finding a gain offset of and slope of , which is small with respect to the energy resolution. This substantially improves the fit, but some features remain in the residuals. Further improvements to the response model are needed to fully resolve these issues. In this study we regard it a systematic uncertainty. A goodness of fit per degree of freedom of () is obtained by adding a error in quadrature to the statistical error of each data point.
| Parameter | Value |
| TBabs | |
| bbodyrad | |
| compTT | |
The best-fitting parameter values and uncertainties are presented in Table 1. The absorption column, , is consistent within with the mean value obtained from Chandra grating spectra (Güver et al., 2010). We use the cflux model to determine the unabsorbed Comptonization flux in the band to be , and by extrapolation to the band we derive an unabsorbed bolometric flux of .
From the normalization of the blackbody we derive the apparent radius, , under assumption of an isotropically emitting spherical surface at a distance of (Valenti et al., 2004). This is larger than expected for the neutron star, and may represent emission from the inner disk. We caution that the best-fit blackbody parameters may be sensitive to the energy of the seed photons being Comptonized. Including the blackbody component, the total unabsorbed persistent flux is () or ().
As a measure of the Eddington flux, we find from the Multi-Instrument Burst Archive (MINBAR; e.g., Galloway et al., 2008) the weighted mean of the bolometric peak blackbody flux of PRE bursts observed with RXTE/PCA from 4U 182030: . Therefore, the total persistent flux measured with NICER is .
3.2. Burst Light Curve
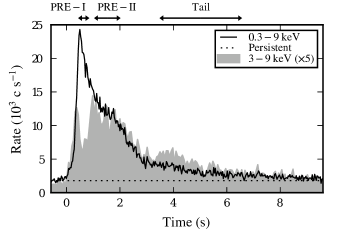
The burst light curve reaches a peak count rate of in the band (Figure 1). When we consider only the photons with energies in excess of , where past instruments such as RXTE/PCA were sensitive, a dip appears in the light curve. Such a dip has been found to be the characteristic signature of PRE (Grindlay et al., 1980). NICER’s coverage of the soft X-ray band provides a complementary view of this bright burst phase, and the count rate spikes. The XTI’s modularity accommodates these large count rates without pile-up or telemetry issues. The high count rate is maintained for a short duration (), and is quickly reduced to . The latter level appears as a “plateau”, after which the count rate returns to the persistent level on a timescale of .
No burst oscillations have been detected during this burst.
3.3. Burst Spectra
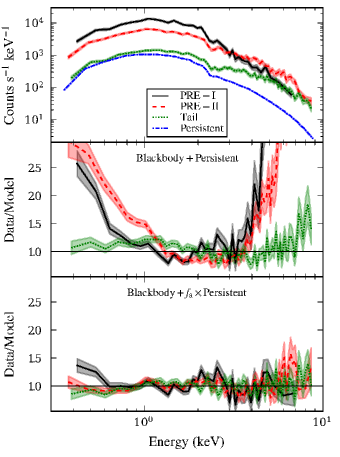
To investigate the importance of the different spectral components during the burst, we extract spectra from three time intervals. We select an interval of around the peak in the count rate (“PRE-I”; Figures 1, 2), in the subsequent plateau (“PRE-II”), and in the tail (“Tail”). We first fit the spectra with the usual burst model, where we keep the Comptonization component parameters fixed at the values from Table 1 and employ the blackbody component to model the thermal burst emission. The absorption column, , is fixed to the best-fitting value from the persistent emission. Furthermore, we use the same gain corrections as in Section 3.1. This spectral model does not provide a satisfactory description of the data ( for PRE-I, PRE-II, and the tail, respectively), with excesses appearing at both ends of the passband (Figure 2 middle panel). Next, we allow for a scaling factor, , to change the normalization of the Comptonization component (e.g., Worpel et al., 2013). This scaling is a purely phenomenological assumption. Using this scaling, the fits are vastly improved ( for PRE-I, PRE-II, and the tail, respectively), and provide a reasonable description of the spectra (Figure 2 bottom panel). We employ this “ model” in time resolved spectroscopy. In all these fits, the seed and electron temperatures of the Comptonization component during the burst are fixed at the values found for the persistent emission (Table 1). Although this produces good fits, it is not a self-consistent physical model.
Instead of Comptonization, we also tested the same model for disk reflection that was successfully applied to the 1999 superburst from 4U 182030 (Ballantyne & Strohmayer, 2004). It fails to provide an adequate fit, especially for the excess at (Figure 2 middle). We find a upper limit to the reflection fraction of , which is close to the value measured in the superburst.
3.4. Time-resolved Spectroscopy
We extract spectra from time intervals with durations between where the count rate peaks and in the tail. The spectra contain on average counts each ( counts in total).
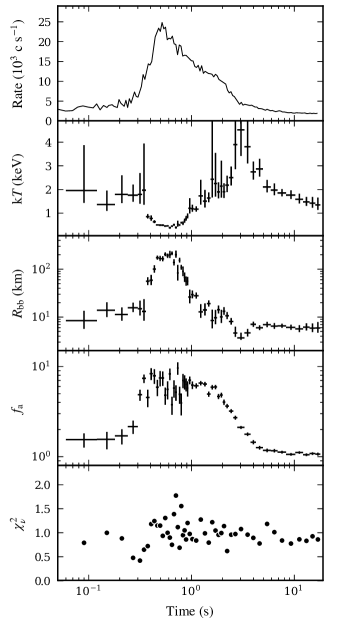
The spectra are fit with the model (Section 3.3). Strong photospheric expansion is apparent: reaches a maximum of , accompanied by a minimum in the temperature of (weighted means of six bins around the extrema). The phase of strong expansion lasts only . The subsequent decrease in radius slows down, however, for during a plateau of moderate expansion with and . The end of the PRE phase (“touchdown”) is marked by a peak in around , coinciding with a brief dip in (see also, e.g., Zhang et al., 2013), after which remains stable (). in the strong and moderate PRE phases are, respectively, and times the value in the tail. At touchdown, the temperature is near , but the uncertainties are large. For this value of , the peak of the photon counts spectrum is near , where the NICER effective area is substantially reduced with respect to its peak around .
At the burst onset there is a strong rise in to a mean value of . During the moderate expansion phase, begins to decline, returning to unity (the persistent level) in the burst tail.
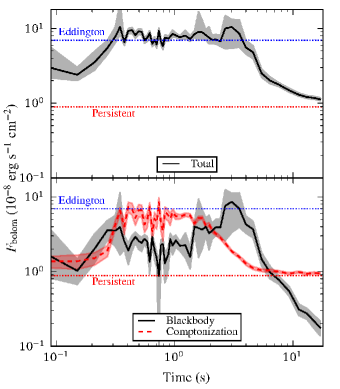
The total unabsorbed bolometric flux peaks at a plateau with a weighted mean value of , which is maintained up to touchdown (Figure 4 top). Subtracting the persistent emission, it is larger than for the RXTE/PCA bursts (Section 3.1). This falls within the typical observed variations in the peak fluxes of PRE bursts of the same source (e.g., Kuulkers et al., 2003). Integrating the flux above the persistent level, we find a total burst fluence of .
When we regard the two spectral components separately, the blackbody fluence is , and the Comptonization fluence in excess of the persistent level is . Therefore, a fraction of of the total burst fluence is in the Comptonization component. Prior to , the fraction is . Subsequently, the blackbody flux increases up to the touchdown, whereas the Comptonization flux decreases. At the flux fraction for Comptonization is .
After the touchdown at , the blackbody flux drops as a power law. Following the prescription of in ’t Zand et al. (2017), we fit a power law to the blackbody flux decline, and find an index , which is typical for short bursts from helium-rich fuel (in ’t Zand et al., 2014, 2017). Similarly, we determine the power-law slope of the decay of the Comptonization component in the time interval: .
4. Discussion
4.1. Comparison to Expansion and Wind Models
The 1980s saw the first models of PRE and radiation-driven winds for the most luminous bursts (e.g., Ebisuzaki et al., 1983; Paczynski, 1983). Paczynski & Proszynski (1986) created General Relativistic models that allowed them to probe strong expansion, and they remarked “Most likely, the stars with winds are too cool to be detectable with the existing X-ray instruments.” With the NICER observations of 4U 182030 we finally have the soft X-ray coverage at high time resolution to test these models and investigate the strong radius expansion regime. Their model with mass outflow rate predicts a photospheric radius that is within of the maximum that we derive. The predicted photospheric temperature of is close to our measured minimum of .
The model predicts an outflow velocity of . This value is strongly dependent on the outer boundary conditions, such as the optical depth where the observed signal originates: different conditions give velocities in the range of . The large change in within at the burst onset suggests an expansion of , which may be a lower limit on the outflow velocity.
In comparing our observations to these models, we included neither the systematic uncertainties from the source distance, anisotropy factors (e.g., He & Keek, 2016), and color corrections of the blackbody parameters (e.g., Suleimanov et al., 2012), nor the gravitational redshift. Nevertheless, it is encouraging that the observed properties of the strong PRE phase are well described by these relatively simple models. Predictions from models with improved boundary conditions (Joss & Melia, 1987) and radiation transport (Nobili et al., 1994) differ by factors of only a few.
4.2. Comparison to Previous Bursts: Superexpansion
During superexpansion bursts observed by RXTE/PCA, the thermal emission moved below the passband, and even the persistent component disappeared (in ’t Zand & Weinberg, 2010). This was observed from 4U 182030 at a low persistent flux. During bursts at times higher persistent flux, the source remained detectable, even though the bursts had a similar fluence and duration. in ’t Zand et al. (2012) speculated that higher accretion rates affect photospheric expansion through the ram pressure of the infalling material. The NICER burst occurred at a relatively high persistent flux, which corresponds to a mass accretion rate of (for hydrogen-deficient material and a neutron star radius). This is close to the model-predicted outflow rate . The ram pressure from accretion may have been important in setting the extent of the expansion, whereas superexpansion occurs only at lower accretion rates and ram pressures (in ’t Zand et al., 2012). To accurately predict the expansion behavior, future models need to include the accretion flow, and compare its ram pressure to that of the outflow.
4.3. Enhanced Comptonization Emission
The Comptonization component in our phenomenological model becomes six times brighter during the burst. We discuss potential interpretations of this component and of its time evolution.
Model spectra for strongly expanded atmospheres deviate from a blackbody due to Comptonization and free-free absorption and emission (e.g., Titarchuk, 1994b). Our observed Comptonization component is substantially brighter than the model predictions, and may instead be produced by reprocessing of burst emission in the accretion environment. For example, a spreading layer of accreted material could cover a substantial fraction of the stellar surface during PRE (e.g., Kajava et al., 2017), and its spectrum is thought to be well described by optically thick Comptonization emission with a temperature of (Suleimanov & Poutanen, 2006; Revnivtsev et al., 2013), similar to our compTT component (Table 1).
Alternatively, the burst emission could undergo Compton scattering in the disk or corona. In the strong PRE phase, the Comptonization component contributes of the flux. For such a large fraction of the neutron star’s thermal emission to be intercepted, the disk or its corona must have a large scale height close to the star (e.g., He & Keek, 2016). The flux fraction remains constant in this phase, despite large variations in . The fraction only decreases in the moderate PRE phase, once drops below . If the optically thick disk/corona is truncated at this radius, the whole neutron star is revealed when the star’s atmospheric radius becomes smaller than the disk’s inner radius. A truncated disk is expected in the hard spectral state (see also the discussion in in ’t Zand et al., 2012). In this scenario, part of the neutron star is covered during the strong PRE phase, and our measurement of represents the visible fraction of the neutron star surface. If the total flux were produced by the blackbody component, the larger normalization suggests a maximum expansion of .
If the thermal emission is Comptonized, one expects the spectral shape of the Comptonization component to change with the blackbody temperature. Nevertheless, we obtain good fits with a fixed shape, despite changes in the blackbody temperature and the Compton component luminosity. This is similar to other studies, where the shape of the enhanced component matches the persistent spectrum outside of the burst (see, e.g., Figure 4 of in ’t Zand et al., 2013). Further burst observations with NICER and additional theory/spectral modeling efforts will be instrumental in finding a more self-consistent physical description of superexpansion bursts.
5. Conclusions and Outlook
We have presented the first strong PRE burst from 4U 182030 observed with NICER. Because of NICER’s soft-band coverage, the properties of the thermal emission could be traced even when the blackbody temperature dropped to and the radius increased by a factor . Furthermore, in the soft band a Comptonization component was detected that accounts for up to of the energy flux. Because the total flux during PRE remained at the Eddington limit, we speculate that part of the neutron star was covered by the accretion environment, and the thermal emission from the neutron star was Comptonized. At the end of the PRE phase, the neutron star was uncovered due to geometrical changes.
The properties of the blackbody match to first order the predictions from models of steady-state outflows. Currently, no detailed time-dependent models exist, nor models that include the interaction with the accretion environment (e.g., Ballantyne & Everett, 2005). Our findings indicate these as important topics for improvement.
In a forthcoming paper we will study the other four bursts from 4U 182030. Anticipating improvements in NICER’s gain calibration and response model, we will search for discrete spectral features from the neutron star surface and the wind. Moreover, we will investigate constraints on the neutron star’s mass and radius that can be derived from the PRE phase. Further NICER observations of 4U 182030 may catch a burst at lower persistent flux, where the mass accretion inflow is smaller than the wind outflow, leading to different expansion behavior and the possibility of detecting redshifted absorption features (in ’t Zand et al., 2012).
References
- Arnaud (1996) Arnaud, K. A. 1996, in Astronomical Society of the Pacific Conference Series, Vol. 101, Astronomical Data Analysis Software and Systems V, ed. G. H. Jacoby & J. Barnes, 17
- Ballantyne & Everett (2005) Ballantyne, D. R., & Everett, J. E. 2005, ApJ, 626, 364
- Ballantyne & Strohmayer (2004) Ballantyne, D. R., & Strohmayer, T. E. 2004, ApJ, 602, L105
- Costantini et al. (2012) Costantini, E., et al. 2012, A&A, 539, A32
- Cumming (2003) Cumming, A. 2003, ApJ, 595, 1077
- Ebisuzaki et al. (1983) Ebisuzaki, T., Hanawa, T., & Sugimoto, D. 1983, PASJ, 35, 17
- Galloway & Keek (2017) Galloway, D. K., & Keek, L. 2017, ArXiv e-prints 1712.06227
- Galloway et al. (2008) Galloway, D. K., Muno, M. P., Hartman, J. M., Psaltis, D., & Chakrabarty, D. 2008, ApJS, 179, 360
- Gendreau & Arzoumanian (2017) Gendreau, K., & Arzoumanian, Z. 2017, Nature Astronomy, 1, 895
- Gendreau et al. (2016) Gendreau, K. C., et al. 2016, in Proc. SPIE, Vol. 9905, Space Telescopes and Instrumentation 2016: Ultraviolet to Gamma Ray, 99051H
- Grindlay et al. (1976) Grindlay, J., Gursky, H., Schnopper, H., Parsignault, D. R., Heise, J., Brinkman, A. C., & Schrijver, J. 1976, ApJ, 205, L127
- Grindlay et al. (1980) Grindlay, J. E., et al. 1980, ApJ, 240, L121
- Güver et al. (2010) Güver, T., Wroblewski, P., Camarota, L., & Özel, F. 2010, ApJ, 719, 1807
- He & Keek (2016) He, C.-C., & Keek, L. 2016, ApJ, 819, 47
- in ’t Zand et al. (2014) in ’t Zand, J. J. M., Cumming, A., Triemstra, T. L., Mateijsen, R. A. D. A., & Bagnoli, T. 2014, A&A, 562, A16
- in ’t Zand et al. (2012) in ’t Zand, J. J. M., Homan, J., Keek, L., & Palmer, D. M. 2012, A&A, 547, A47
- in ’t Zand et al. (2017) in ’t Zand, J. J. M., Visser, M. E. B., Galloway, D. K., Chenevez, J., Keek, L., Kuulkers, E., Sánchez-Fernández, C., & Wörpel, H. 2017, A&A, 606, A130
- in ’t Zand & Weinberg (2010) in ’t Zand, J. J. M., & Weinberg, N. N. 2010, A&A, 520, A81
- in ’t Zand et al. (2013) in ’t Zand, J. J. M., et al. 2013, A&A, 553, A83
- Jahoda et al. (2006) Jahoda, K., Markwardt, C. B., Radeva, Y., Rots, A. H., Stark, M. J., Swank, J. H., Strohmayer, T. E., & Zhang, W. 2006, ApJS, 163, 401
- Joss & Melia (1987) Joss, P. C., & Melia, F. 1987, ApJ, 312, 700
- Kajava et al. (2017) Kajava, J. J. E., Koljonen, K. I. I., Nättilä, J., Suleimanov, V., & Poutanen, J. 2017, MNRAS, 472, 78
- Keek et al. (2018) Keek, L., et al. 2018, ApJ, 855, L4
- Kuulkers et al. (2003) Kuulkers, E., den Hartog, P. R., in ’t Zand, J. J. M., Verbunt, F. W. M., Harris, W. E., & Cocchi, M. 2003, A&A, 399, 663
- Nobili et al. (1994) Nobili, L., Turolla, R., & Lapidus, I. 1994, ApJ, 433, 276
- Paczynski (1983) Paczynski, B. 1983, ApJ, 267, 315
- Paczynski & Proszynski (1986) Paczynski, B., & Proszynski, M. 1986, ApJ, 302, 519
- Prigozhin et al. (2012) Prigozhin, G., et al. 2012, in Proc. SPIE, Vol. 8453, High Energy, Optical, and Infrared Detectors for Astronomy V, 845318
- Revnivtsev et al. (2013) Revnivtsev, M. G., Suleimanov, V. F., & Poutanen, J. 2013, MNRAS, 434, 2355
- Stella et al. (1987) Stella, L., Priedhorsky, W., & White, N. E. 1987, ApJ, 312, L17
- Suleimanov & Poutanen (2006) Suleimanov, V., & Poutanen, J. 2006, MNRAS, 369, 2036
- Suleimanov et al. (2012) Suleimanov, V., Poutanen, J., & Werner, K. 2012, A&A, 545, A120
- Titarchuk (1994a) Titarchuk, L. 1994a, ApJ, 434, 570
- Titarchuk (1994b) —. 1994b, ApJ, 429, 340
- Valenti et al. (2004) Valenti, E., Ferraro, F. R., & Origlia, L. 2004, MNRAS, 351, 1204
- van Paradijs & Lewin (1987) van Paradijs, J., & Lewin, W. H. G. 1987, A&A, 172, L20
- Weinberg et al. (2006) Weinberg, N. N., Bildsten, L., & Schatz, H. 2006, ApJ, 639, 1018
- Wilms et al. (2000) Wilms, J., Allen, A., & McCray, R. 2000, ApJ, 542, 914
- Worpel et al. (2013) Worpel, H., Galloway, D. K., & Price, D. J. 2013, ApJ, 772, 94
- Zhang et al. (2013) Zhang, G., Méndez, M., Belloni, T. M., & Homan, J. 2013, MNRAS, 436, 2276