NICER Observes the Effects of an X-Ray Burst on the Accretion Environment in Aql X-1
Abstract
Accretion disks around neutron stars regularly undergo sudden strong irradiation by Type I X-ray bursts powered by unstable thermonuclear burning on the stellar surface. We investigate the impact on the disk during one of the first X-ray burst observations with the Neutron Star Interior Composition Explorer (NICER) on the International Space Station. The burst is seen from Aql X-1 during the hard spectral state. In addition to thermal emission from the neutron star, the burst spectrum exhibits an excess of soft X-ray photons below 1 keV, where NICER’s sensitivity peaks. We interpret the excess as a combination of reprocessing by the strongly photoionized disk and enhancement of the pre-burst persistent flux, possibly due to Poynting Robertson drag or coronal reprocessing. This is the first such detection for a short sub-Eddington burst. As these bursts are observed frequently, NICER will be able to study how X-ray bursts affect the disk and corona for a range of accreting neutron star systems and disk states.
Subject headings:
accretion, accretion disks — stars: neutron — stars: individual: Aql X-1 — X-rays: binaries — X-rays: bursts1. Introduction
In June 2017 the Neutron Star Interior Composition Explorer (NICER; Gendreau & Arzoumanian, 2017) was installed on the International Space Station. Among its first observations were two Type I X-ray bursts from the low-mass X-ray binary Aquila X-1 (catalog Aql X-1). X-ray bursts are known from over such systems in our Galaxy, where hydrogen- and helium-rich material is accreted from a companion star onto a neutron star (for a recent review, see Galloway & Keek, 2017). Runaway thermonuclear fusion of the accreted matter powers a brief (typically ) X-ray flash during which the neutron star outshines the inner regions of the accretion disk. Sudden strong irradiation can have a multitude of effects on the disk (Ballantyne & Everett, 2005), but it has been challenging to detect changes in the accretion environment, because the majority of burst observations have constrained only the thermal emission from the neutron star (e.g., Swank et al., 1977; Galloway et al., 2008).
Most burst observations have been performed with instruments that are sensitive to photon energies above , such as the Proportional Counter Array (PCA; Jahoda et al., 2006) on the Rossi X-ray Timing Explorer (RXTE; Bradt et al., 1993). The burst spectra are usually fit with a thermal (blackbody) component in addition to a constant “persistent” component. The latter describes the X-ray emission from accretion processes as measured outside of the burst, and is assumed to remain unchanged during the burst. Deviations from the burst spectral model are found when considering a large sample of observations with RXTE/PCA (Worpel et al., 2013, 2015), which may indicate reprocessing of the burst emission or enhancement of the accretion flow due to the burst’s radiation drag on the disk (Poynting-Robertson drag; Walker, 1992; Miller & Lamb, 1993; Lamb & Miller, 1995, e.g., ), and a deficit of photons at during the bursts suggests coronal cooling (Maccarone & Coppi, 2003; Chen et al., 2012, 2013; Ji et al., 2014; Kajava et al., 2017). Furthermore, hours-long superbursts exhibit an iron emission line and absorption edge produced by reprocessing of the burst by the inner disk (e.g., Ballantyne, 2004). Often collectively referred to as “reflection”, reprocessing involves both scattering and absorption/re-emission by the disk. The shape of the reflection spectrum depends on the ionization of the metals in the disk and on its inner radius, , because relativistic Doppler broadening is stronger close to the neutron star. The two superbursts seen by RXTE/PCA strongly ionized the disk and temporarily disrupted the inner disk (Ballantyne & Strohmayer, 2004; Keek et al., 2014).
Most bursts are too short to enable detection of the iron line. Further reflection features are predicted in the soft X-ray band below , including a multitude of emission lines on top of a free-free continuum (Ballantyne, 2004). Burst reflection may, therefore, explain the soft excess over a blackbody detected during a bright burst observed with both Chandra and RXTE/PCA (in ’t Zand et al., 2013) and two long bursts seen with the Swift X-Ray Telescope (Degenaar et al., 2013; Keek et al., 2017). Moreover, an increase of the persistent emission may also contribute to the soft excess.
NICER combines a passband with high throughput, and provides a substantially larger effective area around than previous missions. It offers the exciting opportunity to study reflection and other signatures of burst-disk interaction even during short bursts. In this Letter we investigate one of NICER’s first X-ray burst observations: a bright burst from Aql X-1. This source exhibits frequent accretion outbursts during which X-ray bursts have been observed (Koyama et al., 1981), and disk reflection has been detected in the persistent emission (King et al., 2016; Ludlam et al., 2017). After describing the NICER observations of Aql X-1 (Section 2), we perform a detailed analysis of the soft excess in the burst spectrum (Section 3). We discuss how an enhanced persistent component and disk reflection contribute (Section 4), and conclude that NICER’s ability to detect burst-disk interaction in short bursts enables investigations for a wide range of sources and spectral states.
2. Observations
NICER’s X-ray Timing Instrument (XTI; Gendreau et al., 2016) consists of co-aligned X-ray concentrator optics each paired with a silicon-drift detector (Prigozhin et al., 2012). The XTI provides a peak effective collecting area of and a energy resolution at . In the interval 2017 June 20 – July 3, NICER collected with functioning detectors a total good exposure of on Aql X-1 during a hard-state accretion outburst. Two Type-I bursts were observed: one in ObsID 0050340108 at MJD 57936.58042 with a peak rate of , and another in ObsID 0050340109 at MJD 57937.61102 peaking at . Neither burst shows significant oscillations near the neutron star’s spin frequency (Zhang et al., 1998).
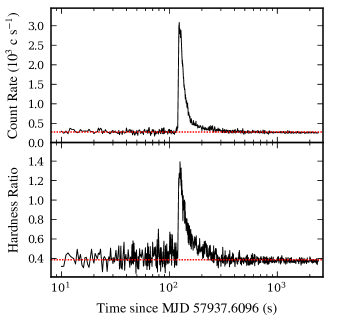
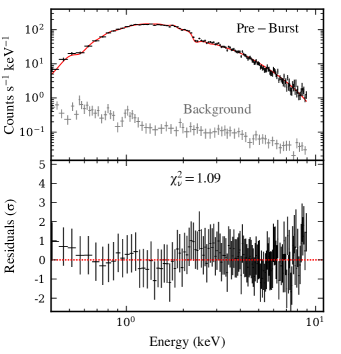
In this Letter we analyze the brighter of the two bursts (Figure 1; the other suffers from a high particle background). During its observation the instrument pointing was accurate and stable. The ISS was on the nightside of the Earth, and the Moon was not near the pointing direction, such that optical loading effects were not significant. The ISS was not near the high particle background region of the South Atlantic Anomaly. By virtue of NICER’s modularity, dead time and pile-up are not an issue even at the burst peak. We process and analyze the data using Heasoft version 6.22.1, Nicerdas 2017-09-06_V002, Xspec 12.9.1p (Arnaud, 1996), and version 0.06 of the NICER response files. Gain is calibrated separately for each detector. As a measure of the cosmic and instrument background, we create a spectrum from a blank-field observation of RXTE background region 5 (Jahoda et al., 2006), which was also obtained at night. The count rate as a function of energy is , such that our observations of Aql X-1 are strongly source dominated at all energies (Figure 2). In the source spectra we group neighboring spectral bins with fewer than counts, and in our Figures we rebin the spectra to a bin width of at least (NICER data oversample the detector resolution).
3. Results
We analyze the spectra of the persistent emission prior to the burst and of the burst itself, looking for signatures of the impact of the burst on the accretion environment.
3.1. Pre-burst Emission
The burst occurred near the pointing’s onset, and the source does not exhibit variability outside the burst (Figure 1). We analyze the pre-burst persistent emission from a interval. We limit the analysis to the keV band to avoid potential noise at both ends of the passband. The spectrum is well described by a thermal bremsstrahlung model (bremss in Xspec; e.g., Czerny et al. 1987). More complex models (e.g., Ludlam et al., 2017) require a longer exposure to constrain their parameters, whereas our primary need is a simple description of the persistent spectrum. Interstellar absorption is modeled using the Tübingen-Boulder model (TBabs) with abundances from Wilms et al. (2000). With a goodness of fit of for degrees of freedom, the best-fitting plasma temperature is , the unabsorbed in-band flux is , and the absorption column is ( uncertainties).
Extrapolating the bremsstrahlung model over the keV range, we find an unabsorbed bolometric flux of . We compare it to the peak fluxes of Eddington-limited bursts from Aql X-1 observed with RXTE/PCA: (Worpel et al., 2015). The pre-burst flux level is, therefore, .
The value of is well within the range derived from observations of the source with the XMM-Newton, Chandra, and Swift observatories (e.g., Campana et al., 2014). measurements from radio and infrared maps of Galactic hydrogen111See http://www.swift.ac.uk/analysis/nhtot/ (Schlegel et al., 1998; Kalberla et al., 2005; Willingale et al., 2013) find within of the source , which is lower than our value. Because the difference is modest, we use our value in the burst analysis for consistency.
3.2. Burst Peak
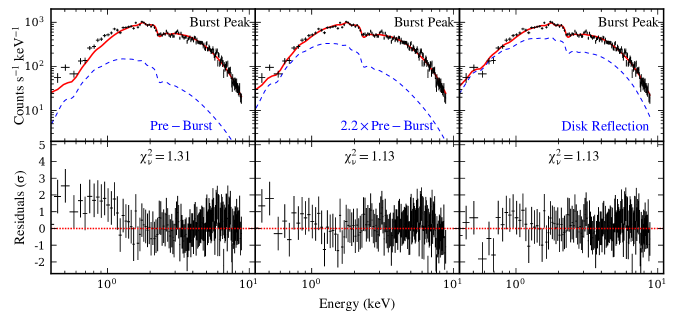
We extract a spectrum around the time when the flux peaks (Figure 3) during a interval (starting at in Figure 4). First we employ the commonly used spectral model for bursts: we keep the parameters of the pre-burst spectrum fixed, and we add an absorbed blackbody (bbodyrad) component to model the thermal emission from the burst. When left free, the best-fitting value of is substantially smaller than both the pre-burst fit and the Galactic hydrogen maps indicate. Similar to Keek et al. (2017), we fix to the pre-burst value: the fit yields (), and a substantial soft excess is visible in the fit residuals below (Figure 3 left). At , the observed count rate is times the value of the best-fitting blackbody model, and the excess is times the background.
We investigate two interpretations of the soft excess. Following Worpel et al. (2013) we include a multiplication factor, , for the normalization of the bremsstrahlung component. We find a best-fitting value of . The fit is improved (, ), and the soft-excess is largely removed from the residuals (Figure 3 middle). Comparing this fit to the previous fit with an F-test indicates a significant improvement with a null-hypothesis probability of .
Alternatively, the excess may result from reprocessing by the disk. We employ the burst reflection model that was successfully applied to the two RXTE/PCA superbursts (Ballantyne, 2004; Ballantyne & Strohmayer, 2004; Keek et al., 2014), which consists of a table of detailed reflection spectra calculated for blackbody illumination of a (in this case, solar-composition) disk. A reflection component is added to our spectral model, and the absorption and bremsstrahlung parameters are kept fixed. Relativistic Doppler broadening of the reflection component is modeled with the rdblur convolution model (Fabian et al., 1989), using an emissivity profile that drops off with the third power of the disk radius, and assuming a disk inclination angle of (King et al., 2016). We find a similar significant improvement in the fit as with the model: (; Figure 3 right). The reflection fraction (the flux ratio of the reflection to blackbody component) is . As no discrete features such as lines are visible, the fit prefers the largest values of the ionization parameter in our table model, , where “” indicates that the search for the confidence region is pegged at the table boundary of . For similar reasons, the fit prefers the strongest broadening, which is given by an inner disk radius of ( is the gravitational radius), but this parameter is not strongly constrained.
3.3. Time-resolved Spectroscopy
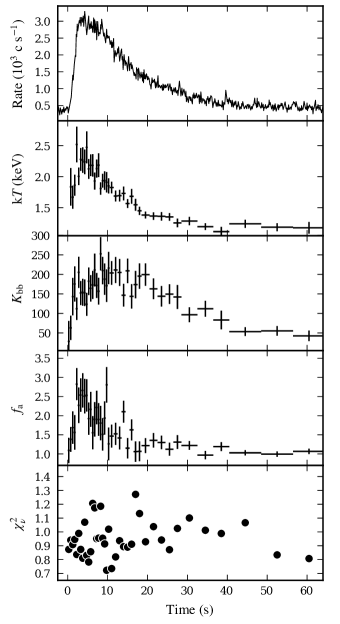
We analyzed a time interval around the peak, but the spectral parameters evolve on shorter time scales, requiring time-resolved spectroscopy. We divide the burst into intervals of at the burst onset, and after the peak we double the duration each time the count rate drops by another factor of , such that we have similar statistics throughout the burst. We analyze the first minute of the burst where the parameters of two spectral components can be constrained, although the tail of the burst is detected for another due to NICER’s soft-band sensitivity to declining temperatures (Figure 1).
First we fit the model. increases at the burst onset to a maximum, and returns to in the tail (Figure 4). In seven bins around the peak, the weighted mean is . We use the Xspec model cflux to determine the unabsorbed bolometric flux of the spectral components (Figure 5 top). The flux of the scaled pre-burst component, , follows the blackbody flux, : a linear fit to the first of the burst yields (, ), where is the persistent flux from Section 3.1.
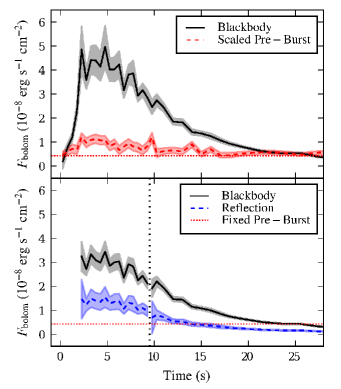
Next we repeat the time-resolved fits with the reflection model. This model includes more parameters, which are hard to constrain within short time intervals. Because was weakly constrained in Section 3.2, we fix its value to , inferred from reflection spectroscopy of the persistent emission in the soft state of Aql X-1 (King et al., 2016). An updated analysis of the soft state (Ludlam et al., 2017) and a study of the hard state (Sakurai et al., 2012) reveal similar , and our burst results are insensitive to the differences. A preliminary investigation of the persistent emission from all NICER data on Aql X-1 shows a broad Fe line similar in shape to that seen with NuSTAR during the soft state (Ludlam et al., 2017), supporting our choice of . Furthermore, we limit the fit to the spectra in an interval around the peak (starting at in Figure 4), where we can reasonably expect to be large. We fit all spectra in that interval simultaneously, assuming and to be the same everywhere, and is fit for each spectrum. We find and ( with ). is consistent within with the values from the fit with the model (Figure 4). Immediately following this time interval, we repeat this exercise for the tail of the burst, obtaining and ( with ), which are consistent with the values around the peak. The blackbody flux is lower than for the model (Figure 5), because the reflection model also contributes to the thermal continuum.
In sevens bins around the peak, the weighted mean of the bolometric unabsorbed blackbody flux is for the model and for the reflection model ( including the reflection component), which is (Section 3.1). The bolometric flux at the peak of all components combined (including pre-burst for the reflection fit) is for the model and for the reflection model, which are consistent within .
4. Discussion
We find that both an enhanced persistent component and disk reflection can explain the soft excess detected by NICER in a burst from Aql X-1. Other interpretations may be possible. For example, free-free absorption in the neutron star atmosphere could produce a soft excess (e.g., Suleimanov et al., 2012). However, we find that fits with atmosphere models are unable to explain the full soft excess, whereas reflection and enhanced persistent emission were found to be important for the interpretation of, e.g., the superbursts seen with RXTE/PCA (Ballantyne & Strohmayer, 2004; Keek et al., 2014). Here we discuss how these two components can provide a consistent physical picture of the impact of the burst.
4.1. Enhanced Persistent Emission
The model scales the persistent flux prior to the burst. The peak value of is typical for bursts without photospheric expansion at a similar persistent flux (Worpel et al., 2015). Worpel et al. (2015) used RXTE/PCA spectra, which do not cover the soft band , and it is therefore interesting that we obtain a roughly similar value. We find that the increase in the persistent flux is proportional to the blackbody flux, suggesting that the increase is caused by burst irradiation. It is possible that radiation drag enhances accretion during the burst (Worpel et al., 2013). Alternatively, the soft excess may be produced by reprocessing of the burst flux in an optically thin medium such as the corona. RXTE/PCA observations of similar bursts from Aql X-1 in the hard state exhibit a substantial flux decrease in the band, possibly caused by coronal cooling induced by the burst (Chen et al., 2013). The simplistic model does not probe this temperature evolution, and the application of physically better motivated models requires broad-band observations with NICER and NuSTAR or ASTROSAT.
4.2. Disk Reflection
The soft excess could also be produced by reprocessing on the disk (Ballantyne, 2004). For a highly ionized disk, the fluorescent Fe K line from reflection is challenging to detect during a burst with NICER, whereas the soft excess is highly significant (Keek et al., 2016). For an inclination angle of (King et al., 2016) the expected reflection fraction is for a thin disk that extends to the neutron star (He & Keek, 2016). The disk has, however, been observed to truncate at (King et al., 2016; Sakurai et al., 2012). From He & Keek (2016) Figure 5 we estimate that for a and radius neutron star this gap reduces the reflection fraction to . We find triple this value, , for the burst. If one assumes that the burst does not change the disk geometry, only of the soft excess is due to reflection, and the rest could result from an enhancement of the persistent flux. To produce , the impact of the burst must have caused the inner disk to (temporarily) extend close to the neutron star surface. A similar suggestion was made for the long burst from IGR J170626143 (Keek et al., 2017).
The intermittent presence of dips observed from Aql X-1 may hint at a larger inclination angle of (Galloway et al., 2016). At this angle, is expected when the disk extends to the stellar surface (He & Keek, 2016), and for . Under these assumptions, reflection contributes only a small part of the soft excess detected by NICER.
Unfortunately, we could not track during the burst from the reflection signal. This may require the analysis of a larger sample of bursts, a superburst observation with NICER, or a future mission with even larger collecting area such as STROBE-X (Wilson-Hodge et al., 2017).
5. Conclusions and Outlook
One of NICER’s first X-ray burst observations was a sub-Eddington burst from Aql X-1 in the hard state. The spectrum exhibits a soft excess over the thermal burst emission, which can be explained by either enhanced persistent (accretion) emission or disk reflection. From the known disk truncation radius, we expect at least a third of the excess to be disk reflection. For reflection to produce all of the excess, burst irradiation must cause the inner disk to temporarily move close to the stellar surface. Alternatively, the excess may be powered by Poynting-Robertson drag or coronal reprocessing. Regardless of the precise interpretation, this demonstrates that bursts have a substantial impact on their accretion environment, even in the hard spectral state which is preferred for neutron star mass-radius measurements (e.g., Kajava et al., 2014). Whereas previously this was only detectable in rare cases or by considering large samples, a preliminary analysis of NICER burst observations finds the soft excess in a number of short bursts. This will allow us to study the burst-disk interaction across multiple sources and spectral states, mapping out how bursts impact different accretion geometries.
References
- Arnaud (1996) Arnaud, K. A. 1996, in Astronomical Society of the Pacific Conference Series, Vol. 101, Astronomical Data Analysis Software and Systems V, ed. G. H. Jacoby & J. Barnes, 17
- Ballantyne (2004) Ballantyne, D. R. 2004, MNRAS, 351, 57
- Ballantyne & Everett (2005) Ballantyne, D. R., & Everett, J. E. 2005, ApJ, 626, 364
- Ballantyne & Strohmayer (2004) Ballantyne, D. R., & Strohmayer, T. E. 2004, ApJ, 602, L105
- Bradt et al. (1993) Bradt, H. V., Rothschild, R. E., & Swank, J. H. 1993, A&AS, 97, 355
- Campana et al. (2014) Campana, S., Brivio, F., Degenaar, N., Mereghetti, S., Wijnands, R., D’Avanzo, P., Israel, G. L., & Stella, L. 2014, MNRAS, 441, 1984
- Chen et al. (2013) Chen, Y.-P., Zhang, S., Zhang, S.-N., Ji, L., Torres, D. F., Kretschmar, P., Li, J., & Wang, J.-M. 2013, ApJ, 777, L9
- Chen et al. (2012) Chen, Y.-P., Zhang, S., Zhang, S.-N., Li, J., & Wang, J.-M. 2012, ApJ, 752, L34
- Czerny et al. (1987) Czerny, M., Czerny, B., & Grindlay, J. E. 1987, ApJ, 312, 122
- Degenaar et al. (2013) Degenaar, N., Miller, J. M., Wijnands, R., Altamirano, D., & Fabian, A. C. 2013, ApJ, 767, L37
- Fabian et al. (1989) Fabian, A. C., Rees, M. J., Stella, L., & White, N. E. 1989, MNRAS, 238, 729
- Galloway et al. (2016) Galloway, D. K., Ajamyan, A. N., Upjohn, J., & Stuart, M. 2016, MNRAS, 461, 3847
- Galloway & Keek (2017) Galloway, D. K., & Keek, L. 2017, ArXiv e-prints 1712.06227
- Galloway et al. (2008) Galloway, D. K., Muno, M. P., Hartman, J. M., Psaltis, D., & Chakrabarty, D. 2008, ApJS, 179, 360
- Gendreau & Arzoumanian (2017) Gendreau, K., & Arzoumanian, Z. 2017, Nature Astronomy, 1, 895
- Gendreau et al. (2016) Gendreau, K. C., et al. 2016, in Proc. SPIE, Vol. 9905, Space Telescopes and Instrumentation 2016: Ultraviolet to Gamma Ray, 99051H
- He & Keek (2016) He, C.-C., & Keek, L. 2016, ApJ, 819, 47
- in ’t Zand et al. (2013) in ’t Zand, J. J. M., et al. 2013, A&A, 553, A83
- Jahoda et al. (2006) Jahoda, K., Markwardt, C. B., Radeva, Y., Rots, A. H., Stark, M. J., Swank, J. H., Strohmayer, T. E., & Zhang, W. 2006, ApJS, 163, 401
- Ji et al. (2014) Ji, L., Zhang, S., Chen, Y., Zhang, S.-N., Torres, D. F., Kretschmar, P., & Li, J. 2014, ApJ, 782, 40
- Kajava et al. (2017) Kajava, J. J. E., Sánchez-Fernández, C., Kuulkers, E., & Poutanen, J. 2017, A&A, 599, A89
- Kajava et al. (2014) Kajava, J. J. E., et al. 2014, MNRAS, 445, 4218
- Kalberla et al. (2005) Kalberla, P. M. W., Burton, W. B., Hartmann, D., Arnal, E. M., Bajaja, E., Morras, R., & Pöppel, W. G. L. 2005, A&A, 440, 775
- Keek et al. (2014) Keek, L., Ballantyne, D. R., Kuulkers, E., & Strohmayer, T. E. 2014, ApJ, 797, L23
- Keek et al. (2017) Keek, L., Iwakiri, W., Serino, M., Ballantyne, D. R., in’t Zand, J. J. M., & Strohmayer, T. E. 2017, ApJ, 836, 111
- Keek et al. (2016) Keek, L., Wolf, Z., & Ballantyne, D. R. 2016, ApJ, 826, 79
- King et al. (2016) King, A. L., et al. 2016, ApJ, 819, L29
- Koyama et al. (1981) Koyama, K., et al. 1981, ApJ, 247, L27
- Lamb & Miller (1995) Lamb, F. K., & Miller, M. C. 1995, ApJ, 439, 828
- Ludlam et al. (2017) Ludlam, R. M., Miller, J. M., Degenaar, N., Sanna, A., Cackett, E. M., Altamirano, D., & King, A. L. 2017, ApJ, 847, 135
- Maccarone & Coppi (2003) Maccarone, T. J., & Coppi, P. S. 2003, A&A, 399, 1151
- Miller & Lamb (1993) Miller, M. C., & Lamb, F. K. 1993, ApJ, 413, L43
- Prigozhin et al. (2012) Prigozhin, G., et al. 2012, in Proc. SPIE, Vol. 8453, High Energy, Optical, and Infrared Detectors for Astronomy V, 845318
- Sakurai et al. (2012) Sakurai, S., Yamada, S., Torii, S., Noda, H., Nakazawa, K., Makishima, K., & Takahashi, H. 2012, PASJ, 64, 72
- Schlegel et al. (1998) Schlegel, D. J., Finkbeiner, D. P., & Davis, M. 1998, ApJ, 500, 525
- Suleimanov et al. (2012) Suleimanov, V., Poutanen, J., & Werner, K. 2012, A&A, 545, A120
- Swank et al. (1977) Swank, J. H., Becker, R. H., Boldt, E. A., Holt, S. S., Pravdo, S. H., & Serlemitsos, P. J. 1977, ApJ, 212, L73
- Walker (1992) Walker, M. A. 1992, ApJ, 385, 642
- Willingale et al. (2013) Willingale, R., Starling, R. L. C., Beardmore, A. P., Tanvir, N. R., & O’Brien, P. T. 2013, MNRAS, 431, 394
- Wilms et al. (2000) Wilms, J., Allen, A., & McCray, R. 2000, ApJ, 542, 914
- Wilson-Hodge et al. (2017) Wilson-Hodge, C. A., et al. 2017, Results in Physics, 7, 3704
- Worpel et al. (2013) Worpel, H., Galloway, D. K., & Price, D. J. 2013, ApJ, 772, 94
- Worpel et al. (2015) —. 2015, ApJ, 801, 60
- Zhang et al. (1998) Zhang, W., Jahoda, K., Kelley, R. L., Strohmayer, T. E., Swank, J. H., & Zhang, S. N. 1998, ApJ, 495, L9+