Critical Filling Factor for the Formation of a Quantum Wigner Crystal
Screened by a Nearby Layer
Abstract
One of the most fascinating ground states of an interacting electron system is the so-called Wigner crystal where the electrons, in order to minimize their repulsive Coulomb energy, form an ordered array. Here we report measurements of the critical filling factor () below which a magnetic-field-induced, quantum Wigner crystal forms in a dilute, two-dimensional electron layer when a second, high-density electron layer is present in close proximity. The data reveal that the Wigner crystal forms at a significantly smaller compared to the () in single-layer two-dimensional electron systems. The measured exhibits a strong dependence on the interlayer distance, reflecting the interaction and screening from the adjacent, high-density layer.
pacs:
Valid PACS appear hereWhen the Coulomb energy () in an interacting electron system dominates over the kinetic energy, it has long been expected that the system condenses into a Wigner crystal (WC) where electrons order themselves in a periodic lattice Wigner.PR.46.1002 . A classical WC state was indeed realized in a very dilute two-dimensional electron system (2DES) confined to the surface of liquid He at sufficiently low temperatures when dominates the kinetic (thermal) energy Grimes.PRL.42.795 ; Fisher.PRL.42.798 . At higher densities, the Fermi energy becomes large and plays the role of the kinetic energy; in this case a quantum WC can be stabilized if is much larger than the Fermi energy Yoon.PRL.82.1744 and temperature is sufficiently low. The addition of a strong, quantizing, perpendicular magnetic field facilitates the formation of a quantum WC as it quenches the kinetic energy by forcing the electrons into the lowest Landau level (LL) Lozovik.JETP.22.11 ; Lam.PRB.30.473 ; Levesque.PRB.30.1056 . Such a magnetic-field-induced WC has been studied using various experimental techniques in very high mobility (low-disorder) 2DESs confined to modulation-doped GaAs quantum wells Andrei.PRL.60.2765 ; Jiang.PRL.65.633 ; Goldman.PRL.65.2189 ; Li.PRL.67.1630 ; Ye.PRL.89.176802 ; Chen.NatPhys.2.245 ; Tiemann.NatPhy.10.9.648 ; Hao.PRL.117.096601 ; MShayegan.Review . The measurements have established that, at LL filling factors smaller than , there is an insulating phase which is generally interpreted to signal the formation of a WC pinned by the small but ubiquitous disorder potential. In very low-disorder GaAs 2DESs, the WC correlation lengths deduced from the measurements are typically much larger than the WC lattice constant, implying large domains and long-range spatial order Ye.PRL.89.176802 .
Here we address a general and fundamental question: What happens to the WC if one brings a second layer in close proximity; in particular, how does such a layer modify the Coulomb interaction in the WC layer? In the case of a classical 2D WC, theory Peeter.PRL.50.2021 ; Peeter.PRB.30.159 and experiments Mistura.PRB.56.8360 indicate that placing a conductive plate below the thin liquid He film on which the 2D WC is formed screens the Coulomb interaction and weakens the stability of the WC. In order to boost the ratio of the Coulomb to the thermal energy and re-stabilize the WC, higher electron densities and/or lower temperatures are needed Peeter.PRL.50.2021 ; Peeter.PRB.30.159 ; Mistura.PRB.56.8360 . The role of screening on a quantum WC, however has not been studied so far. In our study we probe the stability of the magnetic-field-induced, quantum WC at very low temperatures in carefully-designed, bilayer electron systems (BLESs) with very asymmetric layer densities. The majority-density layer acts as the screening layer, and influences the critical LL filling factor () below which the WC forms in the minority layer. Our measured in BLESs with different interlayer distances reveal that, if the screening layer is close by ( nm), can be reduced by more than an order of magnitude compared to the for a single-layer 2DES. This observation implies that, for a WC, the weakening of the Coulomb interaction caused by a screening layer shifts (or, equivalently the critical density below which the WC forms) to smaller values. Our systematic measurements of and its dependence on the interlayer distance and other parameters of the BLES provide unique data which should stimulate quantitative, rigorous calculations.
Our samples are grown via molecular beam epitaxy and contain two 30-nm-wide GaAs quantum wells (QWs), separated by varying thicknesses of Al0.24Ga0.76As barriers: 10 nm for samples A and B, 20 nm for sample C, and 50 nm for samples D and E. The QWs are modulation-doped with Si -layers asymmetrically. As grown, the majority- and minority-layer densities near zero magnetic field () are and , in units of cm-2 which we use throughout the manuscript. Samples A, C, and D have the majority layer on the top and minority layer on the bottom, while samples B and E have an inverted layer order. All the samples have a van der Pauw ( ) geometry, except for sample A which is a Hall bar. We use In-Sn alloy to make Ohmic contacts to both layers. Top and bottom gates are fabricated to tune each layer’s density. In order to measure the longitudinal () and Hall () resistance, we use low-frequency ( Hz) lock-in technique and a dilution refrigerator with a base temperature of mK.
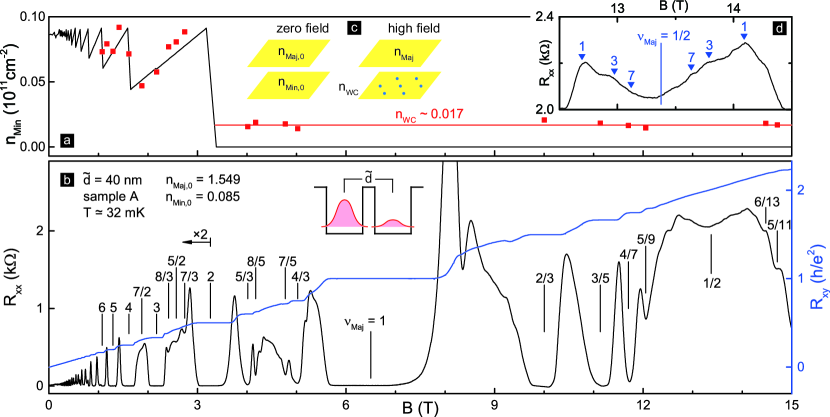
In Fig. 1, we demonstrate our determination of the WC density () and using data for sample A. Near , we measure and from the Fourier transform of the low-field Shubnikov-de Haas oscillations. The sum of and gives the total density, which we assume remains constant as a function of even at the largest . Using , , and the center-to-center distance (the sum of the barrier thickness and QW width; see Fig. 1(b) inset) as inputs, we apply a Landau level alignment (LLA) model to calculate the evolution of the layer densities as a function of Hao.PRB.96.081102 ; Suppl.Mat . The LLA model considers the fact that applying induces LLs in each layer, and that thermal equilibrium requires the Fermi levels to be the same in both layers. As a consequence, the evolution of the LLs in each layer changes the interlayer potential, and induces an interlayer charge transfer Hao.PRB.96.081102 ; Suppl.Mat .
We plot in Fig. 1(a) (black curve) the calculated -dependence of the minority-layer density () based on the LLA model. Experimentally, we measure the majority-layer density () as a function of from the positions of the quantum Hall states (QHSs), namely the minima of the trace in Fig. 1(b) Footnote_Fig1 . Because of the much higher , the minima at intermediate and high reflect the QHSs of the majority layer Hao.PRL.117.096601 ; Hao.PRB.96.081102 . By subtracting from the total density, we deduce as a function of and plot the data as red squares in Fig. 1(a). The calculated matches the experimental values reasonably well in the intermediate regime where the majority-layer filling factor , but at higher where , there is a noticeable difference between the calculated and experimental values. The calculation predicts the complete depletion of the minority layer following a large charge transfer at . However, the measured attains a finite, constant value up to the highest [red horizontal line in Fig. 1(a)].
We attribute the residual at high to the formation of a WC in the minority layer. Starting with certain and [Fig. 1(c)], as a function of electrons freely transfer between the layers, consistent with the LLA model. At high ( T), when is sufficiently low so that the minority-layer filling factor () is very small, the WC in the minority layer becomes energetically favored and terminates the charge transfer because a pinned WC is essentially incompressible. Note that remains constant for T, consistent with the formation of an incompressible WC Footnote_comp . This is further corroborated by our observation of commensurability oscillations (COs) which support the existence of the WC [Fig. 1(d)]. Near , the majority-layer electrons form composite fermions (CFs) and execute cyclotron motion in the effective magnetic field Jain.PRL.63.199 ; Halperin.PRB.47.7312 ; CFbook.Jain . If the CFs feel a periodic electric potential modulation from a WC layer in close proximity, exhibits maxima whenever the CFs’ cyclotron orbits encircle a certain integer number of the WC lattice points Hao.PRL.117.096601 . In Fig. 1(d), the blue triangles mark the expected positions of COs based on the modulation from the WC with the density . The reasonable agreement between the expected and measured positions of maxima supports the existence of the WC.
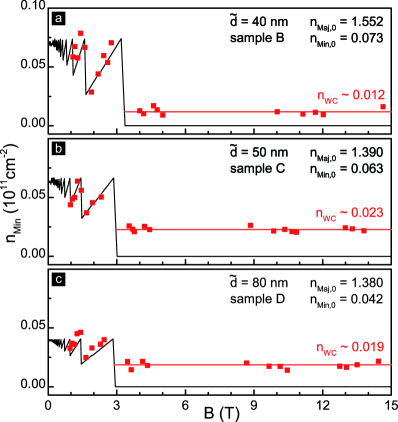
The phenomena observed in Fig. 1 is qualitatively seen in our other samples, as illustrated in Fig. 2. Here we show the calculated and measured values of for samples B, C and, D, which have equal to 40, 50, and 80 nm, respectively. In all three panels, we start with a sufficiently low , and the calculation based on the LLA model predicts a complete depletion of the minority layer for all the samples at high when . However, the measurements show that the minority layer retains a fraction of electrons in the high- regime. The data indicate that the retainment of the electrons in the minority layer at high is a general property of the asymmetric BLESs. As described in the preceding paragraph, we attribute the retained electrons to the formation of a WC with density in the minority layer.
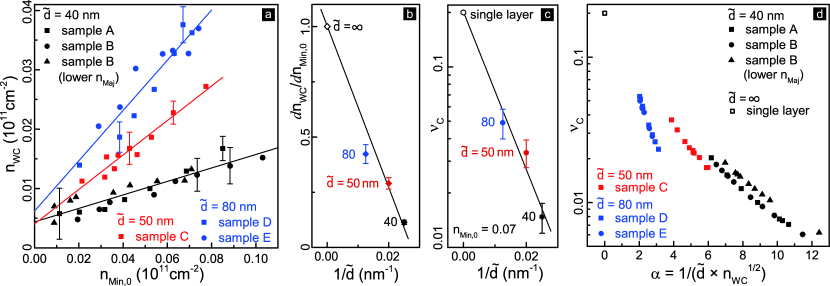
The value of for a given initial directly reflects the impact of the adjacent, majority layer. In Fig. 3(a), we plot the measured against for all the samples. For each sample, we make measurements for multiple values of which we tune by applying voltage bias to the gate near the minority layer. Despite the scatter and the measurement error bars, the data in Fig. 3(a) reveal a clear dependence on : For a fixed , increases with increasing . Moreover, for a given , shows an approximately linear dependence on . We would like to point out that varies slightly for different samples even though the wafers were designed to have the same density. Moreover, because of negative compressibility Eisenstein.PRB.50.1760 ; Katayama.SurfSci.305.405 ; Ying.PRB.52.R11611 ; Papadakis.PRB.55.9294 , also changes when we use the gate bias to tune . In the range of our experiments, the overall variation of , is (see, e.g. listed in Figs. 1 and 2). To appraise the role of , we also made a full batch of measurements on sample B ( nm) with lower by applying bias to the gate near the majority layer; the results are plotted as black triangles in Fig. 3(a). As seen in Fig. 3(a), the triangles lie only very slightly above the other black data points, suggesting a weak dependence on ; we will return to the role of later in the manuscript.
To further summarize the dependence on demonstrated in Fig. 3(a), we apply a least-squares linear fit to each group of data belonging to different , and plot the slopes () of the fitted lines against in Fig. 3(b) Footnote_LinFit . Moreover, for each data point in Fig. 3(a), we use and the value at , above which the interlayer charge transfer stops, to determine the for the formation of the WC. Figure 3(d) contains a plot of from all our measurements. In Fig. 3(c), we show a subset of this data, namely for a fixed , plotted as a function of Footnote_Fig3c .
Figure 3(b) reveals the tendency that, the larger is, the larger the fraction of electrons that stay in the minority layer and form a WC. At the same time, Fig. 3(c) demonstrates that, the larger is, the larger of the minority-layer WC. Both figures help portray the impact of the majority layer on the WC formed in the minority layer. In the case of small [e.g., nm in Figs. 3(b) and 3(c)], the nearby majority layer significantly screens the Coulomb interaction between the minority-layer electrons. With a weaker Coulomb interaction, the minority-layer electrons need a smaller for the WC to achieve the dominance of over the kinetic energy. As a consequence, a smaller fraction of electrons are retained as WC in the minority layer. In the case of large [e.g., and 80 nm in Figs. 3(b) and 3(c)], the screening by the majority layer becomes less significant, and the Coulomb interaction between minority-layer electrons becomes stronger, resulting in a larger and larger fraction of retained electrons. Note that, in the limit of infinite , the minority layer is in effect a single-layer 2DES, and all the minority-layer electrons should remain in this layer and form a WC at [open symbols in Figs. 3(b) and (c)]. The data in Figs. 3(b) and (c) indeed show an asymptotic behavior toward the expected value in the limit of infinite .
In Fig. 3(d), we plot from all the measurements against a dimensionless parameter in an attempt to quantify the impact of the screening by the adjacent majority layer. Intuitively, the smaller is, the stronger the screening, leading to a smaller for the formation of WC because the intralayer Coulomb interaction in the minority layer is further weakened. Considering that the intralayer Coulomb interaction in the minority layer is determined by the electrons’ average distance , we compare and , and use their ratio () to characterize the screening. In Fig. 3(d), we also plot for the WC in a single-layer 2DES at as a reference. Overall, the data from all the samples with varying and generally follow the same tendency toward the limit of single-layer 2DES, indicating the effect of screening on the formation of WC.
The data of sample B with lower [black triangles in Fig. 3(d), ] show slightly higher compared to the data of sample B with larger (black circles, ). According to the Thomas-Fermi approximation, the screening efficiency in a 2DES is independent of the layer density LDS.Davies , so of sample B should be the same for different . However, previous studies of negative compressibility demonstrate that, in an interacting BLES, the screening of one layer by another depends on the layer densities Eisenstein.PRB.50.1760 ; Katayama.SurfSci.305.405 ; Ying.PRB.52.R11611 ; Papadakis.PRB.55.9294 . This interaction-induced, density-dependent screening beyond the Thomas-Fermi approximation might be responsible for our observation of the dependence of on .
In conclusion, our measurements in multiple, asymmetric BLESs with small minority-layer densities reveal that the formation of a magnetic-field induced WC at high magnetic fields retains electrons in this layer and terminates the interlayer charge transfer. Moreover, we find that the critical filling factor for WC formation strongly depends on the interlayer distance and is significantly lower than for a single-layer WC, reflecting the interlayer interaction and screening from the adjacent, majority layer. We hope that our systematic and quantitative data, summarized in Fig. 3, would inspire rigorous theoretical work on the physics of a quantum WC under the impact of screening by a nearby layer.
Acknowledgements.
We thank R. N. Bhatt, L. W. Engel and J. K. Jain for helpful discussions. We acknowledge the National Science Foundation (Grant DMR 1709076) for measurements and the Gordon and Betty Moore Foundation (Grant GBMF4420), the Department of Energy Basic Energy Sciences (Grant DE-FG02-00-ER45841), and the National Science Foundation (Grants MRSEC DMR 1420541 and ECCS 1508925) for sample fabrication.References
- (1) E. Wigner, Phys. Rev. 46, 1002 (1934).
- (2) C. C. Grimes and G. Adams, Phys. Rev. Lett. 42, 795 (1979).
- (3) D. S. Fisher, B. I. Halperin, and P. M. Platzman, Phys. Rev. Lett. 42, 798 (1979).
- (4) J. Yoon, C. C. Li, D. Shahar, D. C. Tsui, and M. Shayegan, Phys. Rev. Lett. 82, 1744 (1999).
- (5) Y. E. Lozovik and V. I. Yudson, JETP Lett. 22, 11 (1975).
- (6) P. K. Lam and S. M. Girvin, Phys. Rev. B 30, 473 (1984).
- (7) D. Levesque, J. J. Weis, and A. H. MacDonald, Phys. Rev. B 30, 1056 (1984).
- (8) E. Y. Andrei, G. Deville, D. C. Glattli, F. I. B. Williams, E. Paris, and B. Etienne, Phys. Rev. Lett. 60, 2765 (1988).
- (9) H. W. Jiang, R. L. Willett, H. L. Stormer, D. C. Tsui, L. N. Pfeiffer, and K. W. West, Phys. Rev. Lett. 65, 633 (1990).
- (10) V. J. Goldman, M. Santos, M. Shayegan, and J. E. Cunningham, Phys. Rev. Lett. 65, 2189 (1990).
- (11) Y. P. Li, T. Sajoto, L. W. Engel, D. C. Tsui, and M. Shayegan, Phys. Rev. Lett. 67, 1630 (1991).
- (12) P. D. Ye, L. W. Engel, D. C. Tsui, R. M. Lewis, L. N. Pfeiffer, and K. West, Phys. Rev. Lett. 89, 176802 (2002).
- (13) Y. P. Chen, G. Sambandamurthy, Z. Wang, R. Lewis, L. Engel, D. Tsui, P. Ye, L. Pfeiffer, and K. West, Nat. Phys. 2, 452 (2006).
- (14) L. Tiemann, T. D. Rhone, N. Shibata, and K. Muraki, Nat. Phys. 10, 648 (2014).
- (15) H. Deng, Y. Liu, I. Jo, L. N. Pfeiffer, K. W. West, K. W. Baldwin, and M. Shayegan, Phys. Rev. Lett. 117, 096601 (2016).
- (16) For an early review, see M. Shayegan, ”Case for the Magnetic-field-induced Two-dimensional Wigner Crystal”, in Perspectives in Quantum Hall Effects, edited by S.D. Sarma and A. Pinczuk (Wiley, New York, 1997), pp. 343-383.
- (17) F. M. Peeters and P. M. Platzman, Phys. Rev. Lett. 50, 2021 (1983).
- (18) F. M. Peeters, Phys. Rev. B 30, 159 (1984).
- (19) G. Mistura, T. Günzler, S. Neser, and P. Leiderer, Phys. Rev. B 56, 8360 (1997).
- (20) H. Deng, Y. Liu, I. Jo, L. N. Pfeiffer, K. W. West, K. W. Baldwin, and M. Shayegan, Phys. Rev. B 96, 081102 (2017).
- (21) See Supplemental Material for details of the LLA model, which includes Refs. Hao.PRB.96.081102 ; Davies.PRB.54.R17331 ; Liu.PRL.107.266802 ; Ying.PRB.52.R11611 .
- (22) A. G. Davies, C. H. W. Barnes, K. R. Zolleis, J. T. Nicholls, M. Y. Simmons, and D. A. Ritchie, Phys. Rev. B 54, R17331 (1996).
- (23) Y. Liu, J. Shabani, D. Kamburov, M. Shayegan, L. N. Pfeiffer, K. W. West, and K. W. Baldwin, Phys. Rev. Lett. 107, 266802 (2011).
- (24) X. Ying, S. R. Parihar, H. C. Manoharan, and M. Shayegan, Phys. Rev. B 52, R11611 (1995).
- (25) In order to show QHSs in the low-field regime ( T) clearly in Fig. 1(b), we present the trace from another high-quality sample in van der Pauw geometry, which has the same , , and .
- (26) Data in Fig. 2(a) of Ref. Hao.PRB.96.081102 corroborate our conjecture: When the minority layer has high density so it does not form a WC and is therefore in a compressible state, the interlayer charge transfer continues in the high-field regime of .
- (27) J. K. Jain, Phys. Rev. Lett. 63, 199 (1989).
- (28) B. I. Halperin, P. A. Lee, and N. Read, Phys. Rev. B 47, 7312 (1993).
- (29) J. K. Jain, Composite Fermions (Cambridge University Press, Cambridge, UK, 2007).
- (30) J. P. Eisenstein, L. N. Pfeiffer, and K. W. West, Phys. Rev. B 50, 1760 (1994).
- (31) Y. Katayama, D. Tsui, H. Manoharan, and M. Shayegan, Surface Science 305, 405 (1994).
- (32) S. J. Papadakis, J. P. Lu, M. Shayegan, S. R. Parihar, and S. A. Lyon, Phys. Rev. B 55, 9294 (1997).
- (33) Because the exact form for the dependence of on is unknown, we use the linear fit as a simple approximation. The positive intercepts of the linear fits might originate from the deviation between the linear approximation and the exact form, or the error bar of the experimental data points, or both.
- (34) Converting data at other values of in Fig. 3(a) to and plotting them as in Fig. 3(c) leads to qualitatively similar behavior. Figure 3(d) provides a complete set of values deduced for all the data points of Fig. 3(a).
- (35) J. H. Davies, The Physics of Low-dimensional Semiconductors (Cambridge University Press, Cambridge, UK, 1998).