A quantitative analysis of systematic differences in positions and proper motions of Gaia DR2 with respect to VLBI
Abstract
We have analyzed the differences in positions of 9081 matched sources between the Gaia DR2 and VLBI catalogues. The median position uncertainty of matched sources in the VLBI catalogue is a factor of two larger than the median position uncertainty in the Gaia DR2. There are 9% matched sources with statistically significant offsets between both catalogues. We found that reported positional errors should be re-scaled by a factor of 1.3 for VLBI and 1.06 for Gaia, and in addition, Gaia errors should be multiplied by the square root of chi square per degree of freedom in order to best fit the normalized position differences to the Rayleigh distribution. We have established that the major contributor to statistically significant position offsets is the presence of optical jets. Among the sources for which the jet direction was determined, the position offsets are parallel to the jet directions for 62% of the outliers. Among the matched sources with significant proper motion, the fraction of objects with proper motion directions parallel to jets is a factor of 3 greater than on average. Such sources have systematically higher chi square per degree of freedom. We explain these proper motions as a manifestation of the source position jitter caused by flares that we have predicted earlier. Therefore, the assumption that quasars are fixed points and therefore, differential proper motions determined with respect to quasar photocenters can be regarded as absolute proper motions, should be treated with a great caution.
keywords:
galaxies: active – galaxies: jets – quasars: general – radio continuum: galaxies – astrometry: reference systems1 Introduction
Since 1980s very long baseline interferometry (VLBI) has been the most accurate absolute astrometry technique. The accuracy of VLBI absolute positions can reach the 0.1 mas level. With few exceptions, VLBI is able to provide absolute positions of only active galactic nuclei (AGNs). In 2016, the Gaia Data Release 1 (DR1) (Lindegren et al., 2016) ushered an emergence of the technique that rivals VLBI in accuracy. A quick analysis by Mignard et al. (2016) found that in general, the differences between common AGNs in VLBI and Gaia DR1 catalogues are close to their uncertainties, except for a 6% of common objects. Mignard et al. (2016) claims that “individual examination of a number of these cases shows that a likely explanation for the offset can often be found, for example in the form of a bright host galaxy or nearby star”. They conclude (page 13) that “the overall agreement between the optical and radio positions is excellent”. We see it differently. If two independent observing campaigns produced small (negligible) differences, that also implies that the contribution of a new campaign is also small (negligible) with respect to what has been known before. Science does not emerge from agreements. It emerges from disagreements. Therefore, we focused our analysis on differences between VLBI and Gaia AGN positions.
Our analysis of Gaia DR1 confirmed the existence of a population of sources with statistically significant VLBI/Gaia offsets (Petrov & Kovalev, 2017a). We found that such factors as the failures in quality control in both VLBI and Gaia, blended nearby stars, or bright host galaxies can account at maximum for 1/3 of that population. This analysis, as well as recent works of others (Mignard et al., 2016; Makarov et al., 2017; Frouard et al., 2018; Liu et al., 2018a, b, c), used arc lengths of VLBI/Gaia differences. Including the second dimension, the position angle of VLBI/Gaia offsets, resulted in a breakthrough. Though the distribution of the position angles counted from the declination axis turned out to be close to uniform, the distribution of the position angles with respect to the jet direction determined from analysis of VLBI images of matched sources revealed a strong anisotropy (Kovalev et al., 2017): the offsets have a preferable direction along the jet, and at a smaller extent in the direction opposite to the jet. We interpret it as a manifestation of a presence of optical jets at scales finer than the Gaia point spread function (PSF), i.e., 100–300 mas. Known optical jets in AGNs resolved with Hubble Space Telescope are cospatial (Gabuzda et al., 2006; Perlman et al., 2010; Meyer et al., 2018). Even in that case there will be position differences. It was emphasized in (Petrov & Kovalev, 2017b) that the response to an extended structure of a power detector used by Gaia and an interferometer that records voltage is fundamentally different. The Gaia positions correspond to the location of the optical centroid, while the VLBI positions are associated to the most compact and bright feature at the jet base. Therefore, the physical meaning of a VLBI/Gaia offset is a displacement of the optical centroid with respect to the jet base.
In April 2018, the Gaia DR2 was published (Lindegren et al., 2018). It has 48% more sources than Gaia DR1 and a significantly higher accuracy. Mignard et al. (2018) reported that in general, the VLBI/Gaia DR2 differences are small with some exceptions. They set out five reasons for discrepancies (page 10): 1) real offsets between the centres of emission at optical and radio wavelengths; 2) error in matching VLBI and Gaia objects; 3) an extended galaxy around the quasar; 4) double or lensed quasars; or 5) simply statistical outliers. The presence of optical jets was not put in the list as a likely explanation.
In Petrov & Kovalev (2017b) we examined the consequences of our interpretation of the VLBI/Gaia offsets due to the presence of optical jets. Among others, we made two predictions: 1) “further improvement in the position accuracy of VLBI and Gaia will not result in a reconciliation of radio and optical positions, but will result in improvement of the accuracy of determination of these position differences”, 2) “we predict a jitter in the Gaia centroid position estimates for radio-loud AGNs”. Since the Gaia DR2 accuracy is noticeably better than the Gaia DR1 accuracy, this motivated us to extend our previous analysis to the Gaia DR2 and check whether these predictions came true. To answer the question what is the most significant contributor to systematic position differences is the goal of this article.
2 Comparison of VLBI/Gaia positions
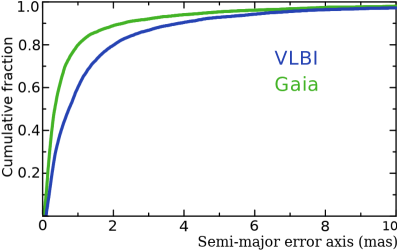
We matched the Gaia DR2 catalogue of 1,692,919,135 objects against the Radio Fundamental Catalogue rfc_2018b (L. Petrov and Y.Y. Kovalev in preparation, 2018)111Available online at http://astrogeo.org/rfc (RFC) of 15,155 sources. The RFC catalogue is derived using all VLBI observations under astrometric programs publicly available by August 01 2018. We used the same procedure of matching Gaia objects against the VLBI catalogue described in detail in Petrov & Kovalev (2017a) and got 9081 matches with the probability of false association below the level. The immediate comparison of formal uncertainties among matches showed that the Gaia uncertainties are smaller (see Figure 1). The median of VLBI semi-major axes of error ellipses is 0.74 mas against 0.34 mas for Gaia. Although VLBI can reach accuracies of 0.1 mas in absolute positions of strong sources, the majority of the sources were observed only once for 60 seconds, which is insufficient to derive their positions with that level of accuracy. The Gaia uncertainties of matches are roughly twice smaller than the VLBI uncertainties, though this statement cannot be generalized to the entire Gaia or VLBI catalogues.
Among 9081 matches, radio images at milliarcsecond resolution for 8143 sources are available. Using them, we have evaluated the jet directions for 4030 sources, i.e., for one half of the sample. We removed 48 sources that include 13 radio stars, 1 supernova remnant in the nearby star-forming galaxy, 10 gravitational lenses, and 24 double objects.
2.1 Analysis of VLBI/Gaia position angles with respect to the jet direction
We examined the arc lengths between the VLBI and Gaia source position estimates as well as the position angles of Gaia positions with respect to VLBI positions counted counter-clockwise with respect to the declination axis. Using reported position uncertainties and correlations between right ascensions and declinations, we computed the semi-major and semi-minor axes of error ellipse, as well as their position angles for both VLBI and Gaia position estimates. Then, assuming VLBI and Gaia errors are independent, we computed the uncertainties of arc lengths and position angles in the linear approximation:
| (6) |
where Corr is the correlation between right ascension and declination and the uncertainties in right ascensions are without the factor. Labels and stand for VLBI and Gaia respectively.
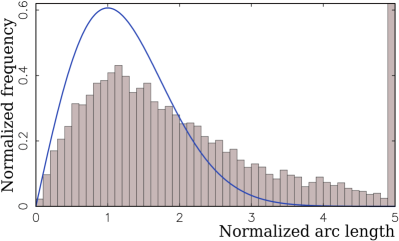
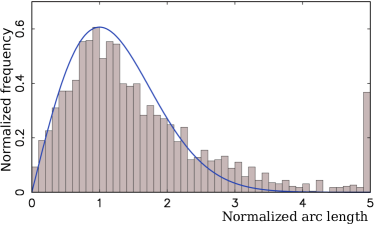
Figure 2 shows the distribution of the normalized arc-lengths among all the matches. The last bin contains 1067 sources with normalized arcs greater than 5, or 11.4%. The number of sources with normalized arcs greater than 4, what for this work we consider statistically significant, is 16.3%, or 1/6. The goal of our study is to explain these outliers.
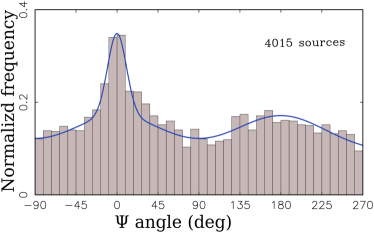
We computed the histograms of the distribution of the position angle offsets with respect to the jet directions determined from the analysis of VLBI images at milliarcsecond scales. We denote this quantity as . Such a histogram is shown in Figure 3. Comparing this Figure with the upper left Figure 3 in Kovalev et al. (2017), demonstrates that the anisotropy is revealed even more clearly: the peaks became sharper and narrower. The height of the peak with respect to the background is 2.8 versus 1.7 and the full width at half maximum (FWHM) is 0.42 rad versus 0.62 rad. We confirmed that anisotropy of angle is not an artifact of Gaia DR1, and the prediction made in Petrov & Kovalev (2017b) has come true.
We should note that the histogram of angles is affected by its measurement errors that depend on . We assume , neglecting errors in the determination of jet direction angles because at the moment, we cannot precisely characterize them. At large (say, more than 4), the distribution of the errors for a given measurement converges to the normal distribution. At low (say less than 0.25), the distribution is converging to the uniform distribution. The analytic expression for the errors can be found in page 233 of Thompson et al. (2017). Including measurements of with large errors smears the histogram. In order to mitigate smearing, we filtered out matches with rad. We found empirically that reducing the threshold further degrades the histograms as a consequence of the scarcity of remaining points, though does not change their shape noticeably.
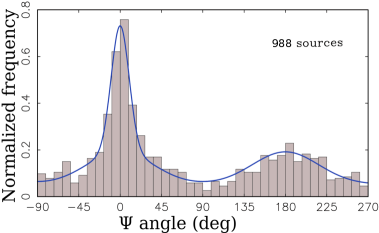
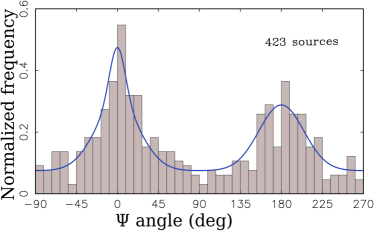
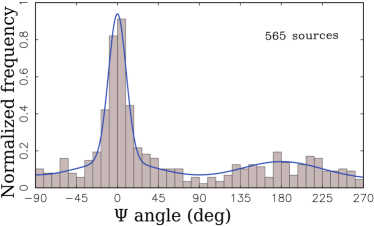
Figure 3b shows the histogram of angles for all the matches with rad. The peaks at and became much stronger. A further analysis revealed that the histograms are different for short and long arc lengths between VLBI and Gaia positions as shown in Figure 3c and 3d.
To characterize the histograms, we fitted a mathematical model to them as follows:
| (7) |
where is the normalized Gaussian function with first two moments and . We have selected a model that is as simple as possible. In the context of this study a choice of functions to represent the empirical distribution is irrelevant, as far as the mathematical model fits the distribution. Parameter describes the contribution of the main narrow peak, parameter describes the contribution of the secondary wide peaks that has the maxima at both 0 and , and the last term describes the contribution of the uniform component of the distribution. We noticed that the broad peaks at and have a similar shape and fitting them separately with two additional parameters does not improve the fit. The results of fitting this 4-parametric model to the histograms in Figures 3a–d are shown in Table 1.
| Case | fwhm1 | fwhm2 | # src | |||
|---|---|---|---|---|---|---|
| rad | rad | |||||
| a | 0.08 | 0.42 | 0.17 | 2.03 | 0.58 | 4017 |
| b | 0.23 | 0.40 | 0.22 | 1.48 | 0.33 | 985 |
| c | 0.07 | 0.35 | 0.17 | 1.01 | 0.47 | 423 |
| d | 0.24 | 0.40 | 0.17 | 1.84 | 0.28 | 565 |
We see that the main peak at with a FWHM around 0.4 rad is rather insensitive to the way how a subsample is drawn. We tentatively conclude that the fitted FWHM is the intrinsic width of the peak. The peak at is contributed predominately by the matches with large position offsets, and it is related to the presence of optical jets. Several factors contributed to the peak broadening: a) the intrinsic jet width; b) errors in determination of the jet direction; c) curvature of the jet, which makes jet direction determination problematic. Perturbations in the jet shape are magnified because of Doppler boosting. Typically, only a beginning of a jet is discernible at VLBI images due to limited dynamic range, while the Gaia centroid is sensitive to jets at scales comparable with the PSF and smaller.
Two secondary peaks are broad, with maxima at and . They are formed by matches almost exclusively with offsets shorter than 2–2.5 mas. The fraction of these secondary peaks in the distribution weakly depends on the subsample selection, 0.17–0.22, but its FWHM varies between subsamples. We interpret it as an indication that a simplistic 4-parameter model is too coarse to fully describe the empirical distribution which shape depends on the VLBI/Gaia offset length.
The sixth column in Table 1 shows the fraction of the sources which offset position angles have the uniform distribution, i.e., is their offsets are not related to the core-jet morphology. This fraction is 0.58 for the histogram made using all the observations. The fraction is reduced to 0.33 for the subsample of observations with rad and to 0.25 for the subsample with rad. This reduction occurs partly due to mitigation of the histogram smearing, and partly due to the selection bias. Since depends on both an uncertainty of position estimates and an arc-length, selecting a subsample with the upper limit for disproportionately favours the matches with long VLBI/Gaia offsets that for given position uncertainties get high chances to have low .
The distribution of the VLBI/Gaia position offset angles was studied by Plavin et al. (2018) for different purposes applying a different fraction analysis approach. The outcome of their study qualitatively agrees with results presented here.
2.2 Re-scaling VLBI and Gaia reported position uncertainties
The presence of strong peaks at histograms in Figures 3 means these matches are affected by systematic differences. These differences also affect the distribution of normalized arc lengths shown in Figure 2. In order to mitigate their impact, we re-drew the histogram and excluded the sources with angles within 0.5 rad of peaks at 0 and . As a result, we got a clean sample that is not affected by the presence of optical jets. We used this clean sample for characterizing Gaia and VLBI reported position uncertainties. We wanted to answer the question how realistic the uncertainties are.
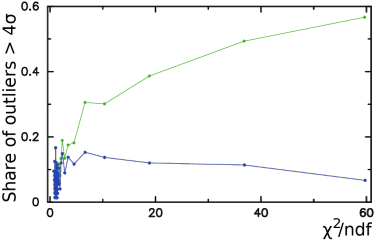
We noticed that the number of outliers, i.e., the matches with the normalized arc , grows with an increase of /ndf, where ndf is the number of degrees of freedom. is provided in variable astrometric_chi2_al of the Gaia DR2 archive. The number of degrees of freedom was computed as the difference of the variables astrometric_n_good_obs_al and astrometric_params_solved.
We sorted the dataset in the increasing order over /ndf and split it into 100 percentile groups of 91 objects each. Then we computed the fraction of outliers for each percentile group. The dependence of the fraction of outliers as a function of the mean /ndf within a percentile is shown with a green curve in Figure 4. It grows approximately as when 1.5–2. Since the number of degrees of freedom is the mathematical expectation of , in a case if all uncertainties of Gaia observables of a given source are underestimated by a common factor, multiplying them by corrects the impact of the measurements error underestimation. The blue curve in Figure 4 demonstrates that after re-scaling Gaia position uncertainties, the dependence of the number of outliers as a function of /ndf has disappeared. Scaling position errors by /ndf inflates them, which makes the normalized arc-lengths smaller. We argue that re-scaling Gaia position errors makes them more realistic by accounting for the additional noise that also increases /ndf.
In addition to source-dependent re-scaling that is based on /ndf statistics of a given source, we evaluated global scaling factors for both VLBI and Gaia that affect every source. This is the simplest way to mitigate the impact of systematic errors on uncertainties and make them more realistic without re-running a solution. Since the normalized arc lengths are affected by both uncertainties in VLBI and Gaia positions, we estimated the scaling factors of VLBI uncertainties by processing the subset of observations with and vice versus: we estimated scaling factors for the Gaia uncertainties (after scaling them by ) by processing the subset of observations with . We adjusted the scaling factors in such a way that the distribution of normalized arc-lengths of the subsample be approximated with the Rayleigh distribution . The scaling factors are 1.06 for Gaia and 1.30 for VLBI. Applying scaling parameters to uncertainties to account for the contribution of systematic errors is a common technique. For instance, a scaling factor 1.5 was used to inflate source position uncertainties in the ICRF1 catalogue (Ma et al., 1998).
| all | off-peak | on-peak | ||||
|---|---|---|---|---|---|---|
| r | # src | r | # src | r | # src | |
| all | 9.0 | 9033 | 6.6 | 7288 | 19.4 | 1702 |
| mas | 10.0 | 4496 | 5.9 | 3169 | 19.7 | 1323 |
| all with known | 11.2 | 4017 | 5.4 | 2313 | 22.1 | 1702 |
| mas | 11.4 | 1997 | 4.3 | 1109 | 20.3 | 888 |
Since as we have established, the Gaia systematic errors in AGN positions caused by optical structure have a strong concentration towards and , we expected that the removal of the matches with and rad and keeping only “off-peak” matches should affect the statistics of the number of outliers. We computed the fraction of matches with normalized residuals for for several sub-samples. Since we applied error re-scaling, the number of outliers has reduced with respect to our initial estimate mentioned above. The first row of Table 2 shows that excluding the sources within the peaks of the distribution of angle reduces the number of outliers by a factor of 1.36. On the contrary, considering only the sources within 0.5 rad of the peaks doubles the number of outliers. Since the jet directions were determined only for 45% of the matches, these statistics underestimate the impact of the presence of optical jets on Gaia positions. If to count only the sources with known jet directions, excluding the sources within the peaks reduces the number of outliers by a factor of 2.07. Rows 2 and 4 of Table 2 shows also the statistics for the subsamples of low 50% percentile of VLBI re-scaled errors. The reduction of the number of outliers is 1.77 for the 50% percentile of the overall sample of matched sources and 2.65 for the sub-sample of the sources with known jet directions. The reduction of the number of outliers is greater for the lower 50% percentile because the sources with smaller position uncertainties have smaller errors in determining the angle, what makes discrimination of the “on-peak” and “off-peak” sources more reliable.
Results in Table 2 show that the presence of optical structure parallel to the jet explains 62% of VLBI/Gaia position offsets significant at the level for a sub-sample of 23% of VLBI/Gaia matches that have known jet directions and VLBI position errors lower than the median. In order to generalize this result to the entire population of radio-loud AGNs, we need assume that the significance of VLBI/Gaia offsets does not depend on VLBI position error and does not depend on the measurability of the radio jet directions. The VLBI position errors above 0.2–0.3 mas level are limited by the thermal noise, and thus, the first assumption is valid. The validity of the second assumption is questionable. The detectability of parsec-scale radio jet depends on the jet brightness and the dynamic range of observations that in turn depends on the source flux density. Since the correlation between radio and optical fluxes is low, missing a jet just because a source was weak does not create a selection bias. However, if a jet direction for a given source was not detected because its radio jet is intrinsically weaker, missing such a source may create a selection bias, because a weak radio jet may imply a weak optical jet. A sub-sample of sources with determined jet direction may have a selection bias towards jets brighter in radio and optic with respect to the overall population.
2.3 The impact of systematic errors on determination of the orientation of the Gaia catalogue with respect to the VLBI catalogue
Any source catalogue can be rotated at an arbitrary angle, and the observables, e.g., group delays, remain the same. The orientation of a catalogue can be described by three angles. These three angles cannot be determined from observations in principle and are set by imposing certain conditions. The orientation of the RFC catalogue is set to require the net rotation with respect to the 212 so-called “defining” sources in the ICRF1 catalogue (Ma et al., 1998) be zero. The orientation of Gaia DR2 catalogue was established to have zero rotation with to respect to 2843 counterparts in the ICRF3-prototype catalogue using the frame rotator technique described in detail in Lindegren et al. (2012).
The systematic differences caused by the optical structure affect the procedure for establishing the catalogue orientation. To provide a quantitative measure of sensitivity of the orientation angles to systematic errors, we computed the three angles of Gaia DR2 orientation with respect to the RFC VLBI catalogue (See Table 3). We see that selecting different samples, including those the most affected by systematic errors (on-peak) and least affected (off-peak), resulted in differences in orientation angles around 0.02 mas. A large value of the orientation angle around axis 2 is somewhat unexpected, but since the ICRF3-prototype catalogue used for alignment of the Gaia DR2 is not publicly available, the origin of this relatively large value cannot be established.
| # Obs | Axis 1 | Axis 2 | Axis 3 | |
|---|---|---|---|---|
| all | 9033 | |||
| with jets | 4016 | |||
| off-peak | 2647 | |||
| on-peak | 1369 |
3 Analysis of Gaia and VLBI proper motions
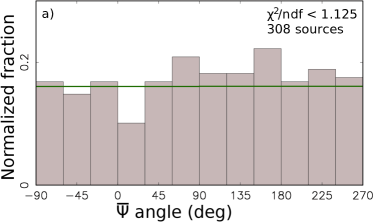
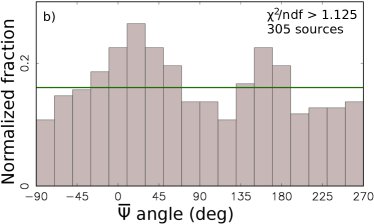
The Gaia DR2 provides proper motions and parallaxes for 78% sources. Among 9081 matches, proper motion estimates are available for 7774 sources. Since the AGNs are located at cosmological distances, their proper motions considered as a bulk tangential displacements are supposed to be well below the Gaia detection limit. A flare at the accretion disk or jet will change position of the centroid. A flare will cause a shift in the position of the centroid, and therefore, will result in a non-zero estimate of proper motion. Such a proper motion may be statistically significant even at Gaia level of accuracy. To check it, we made histograms of proper motions as a function of the position angles of the proper motion with respect to the jet directions denoted as . We analyzed the sample of 613 matched sources with rad. The histograms showed weak peaks. The peaks become much sharper when we split the sample into two subsets: the subset with /ndf less then the median 1.125 and the subset with /ndf greater than the median (See Figure 6).
We see that the subsample of matches with large /ndf shows two peaks at and that are significant, while the subsample with /ndf below the median does not. A non-linear motion is one of the reasons why /ndf deviates from 1. The histogram at Figure 6b tells us that among the sources with non-linear motion, the fraction of objects with proper motions along or opposite to jet direction is disproportionately high. This dependence on angle implies that the proper motion is caused by the photocenter changes parallel to the jet direction at least for a fraction of the sources.

We expect that most optical flares happen close to the center of an AGN, either in the accretion disk or in the jet base. We can not directly see where the optical jet flares occur. However, the following arguments apply. The radio variability is associated with the apparent jet base — the core (e.g., Kovalev et al., 2005; Lister et al., 2016). Optical synchrotron emission is more transparent with even brighter core and steeper jet spectrum (e.g., Mimica et al., 2009). As a result, the jet base is expected to be the prime source of optical flares. The correlation between direction of linear polarization between optical flares and radio core reported by Jorstad et al. (2007) confirms this.
Brightening a jet component shifts the centroid temporarily and irregularly. We call this behavior jitter and we predicted it in Petrov & Kovalev (2017b). Unlike to proper motions of stars, extending the observation interval does not result in a convergence of a proper motion estimate to some value with small uncertainty. Instead, it slowly converges to zero. Peaks at and in the histogram of over the sub-samples with high /ndf provide us the first evidence that predicted jitter indeed takes place. We used here estimates of AGN proper motions and /ndf as a proxy for jitter detection.
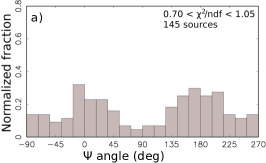
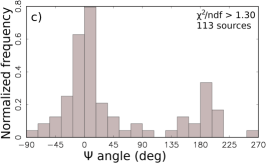
We explored further the impact of a selection based on /ndf on the distribution of position offset angles with respect to jet direction. We did not find a noticeable impact of /ndf for VLBI/Gaia offsets longer 2.5 mas, but we found such a selection affects the matches with VLBI/Gaia offsets shorter 2.5 mas. Figure 7 shows the distributions of angles for matches with rad divided into three sub-samples approximately equally distributed over /ndf. The peaks at and are broad for the sub-sample of low /ndf. They are getting sharper for the sub-sample of intermediate /ndf. The sub-sample with large /ndf is strikingly different than the sub-sample with low /ndf: the histogram has a very strong peak at , i.e., along the jet direction, and a smaller fraction of matches outside the main peaks.
Analysis of the connection of the Gaia DR2 proper motions with /ndf suggests that the matches with large /ndf are more prone to exhibit the jitter. This allows us to conclude tentatively that among the sub-sample of sources with VLBI/Gaia offsets shorter than 2.5 mas, flares and jitter occur predominantly in the objects that have Gaia offsets along the jet direction. This indicates that the mechanism that causes an increase of /ndf may not work or at least is not dominating for sources with . At the same time, Figures 6 and 8 suggest there is no strong preferable sign of the motion direction, either along or opposite to the jet. Such a pattern is consistent with a jitter caused by flares: depending on when a flare has happened, at the beginning or the end of observing interval, the direction of the proper motion may be opposite.
It is instructive to examine whether proper motions in AGN positions derived from VLBI data analysis show the same pattern. We ran a special VLBI solution using all available ionosphere-free linear combinations of group delays at 8.4 and 2.3 GHz since 1980 through 01 August 2018 and estimated proper motions of 3039 sources using least squares. Source structure was considered as a -function in processing VLBI observations during both fringe fitting and computation of theoretical group delays. We selected the sources that were observed in at least 2 sessions over an interval of at least 3 years and each observing session had at least 20 usable combinations of group delays. We applied the data reduction for the acceleration of the barycenter of the Solar system towards the Galactic center with right ascension 17h45m36.6s, declination , and magnitude m/s2. We applied no-net-rotation constraints on proper motion estimates among 628 sources with strong history of observations, namely, observed in at least 8 sessions over 4 years or longer and have at least 128 usable linear combinations of group delays.
Figure 8 shows the histograms of the proper motion position angles and with respect to jet directions among those matched sources from Gaia and VLBI that have magnitudes of the proper motions and position offsets significant at level for Gaia and for VLBI. There are 75 such sources in Gaia dataset and 284 in the VLBI dataset. The fraction of Gaia sources in bins at and is a factor of 3 greater than on average. The median proper motions in these samples is 1.15 mas in the Gaia subset and 0.022 mas in the VLBI subset, i.e., a factor of 52 less. The Gaia proper motions were evaluated over the 1.15 year time interval. The VLBI proper motions were evaluated over a time span in the range of 7.9 to 38.2 years with the median 26.5 years, a factor of 22.8 longer. The median magnitude of proper motions parallel to jet directions does not differ from the median magnitudes over the entire populations for both VLBI and Gaia.
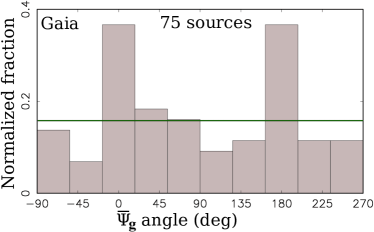
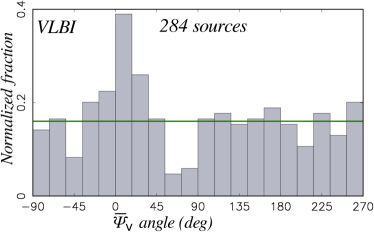
While the histogram of the Gaia proper motion position angles shows peaks at both and , a similar histogram of the VLBI proper motion position angles shows only a peak at . Explanation of this pattern in VLBI proper motions requires further investigation. As we showed in Petrov & Kovalev (2017b), unlike to a power detector, e.g. a CCD, an interferometer is not sensitive to the centroid change. Unaccounted contribution of an extended jet affects source position estimates at scales of tens microarcseconds. The unaccounted contribution of source structure to VLBI positions may reach a level of 0.1–1 mas if the image has more than one compact component, especially if the compact component is located at a distance comparable with a resolution of the interferometer. A change in the relative brightness or the distance between components due to flares causes a change in position estimates at given epochs, and as result, proper motion. The peak around at the low plot in Figure 8 confirms that at least for some sources this mechanisms works.
4 Other known causes of VLBI/Gaia positions offsets
A number of authors (Mignard et al., 2016; Makarov et al., 2017; Frouard et al., 2018) suggested alternative explanations of statistically significant offsets:
-
•
Error in matching VLBI and Gaia objects. They are easily controlled by computing the probability of false association based on the source density in the vicinity of the candidates to association. The cutoff of the probability of false association results in the mathematical expectation of the total number of false associations to 2. The coarseness of the source density model may increase the number of false associations, but very unlikely it can increase their count by an order of magnitude.
-
•
An extended galaxy around a quasar. Position estimates of extended objects may suffer from deficiencies of the current Gaia PSF model. To examine to which extent this affected VLBI/Gaia offsets, we investigated a subsample of the galaxies from the NGC catalogue (Sinnnott & de Jager, 1990). Since these are the brightest known background galaxies, if emission of background galaxies affects VLBI/Gaia offsets, the contribution of such emission is supposed to be the highest among the NGC subsample. We used positions of these sources from Simbad database (Wenger et al., 2000), cross-matched them against the RFC catalogue, and found 167 associations. Of them, 49, or 29%, have a counterpart in Gaia DR2. It is worth noting that the fraction of VLBI/Gaia matches among NGC galaxies is twice less than in the full sample. Without re-scaling the Gaia position uncertainties by the factor, approximately one half of these counterparts, 26 objects, have normalized arc-lengths exceeding 4. However, these objects have large . After re-scaling the Gaia position uncertainties, all but one objects had the normalized arc-length below 4.
We conclude that extended galaxies may have large VLBI/Gaia offsets, but they also have large . Scaling the uncertainties by the makes the normalized arc-lengths of galaxies indistinguishable from the rest of the sample.
-
•
Lensed quasars. There are 10 known gravitational lenses in the sample of VLBI/Gaia matches. Since gravitational lenses were extensively hunted using radio surveys (e.g., Browne et al., 2003), it is unlikely that the RFC has more than several missed gravitational lenses.
-
•
Double quasars. Makarov et al. (2017) presented a list of 28 sources with VLBI/Gaia DR1 significant offsets that have a close component on PanSTARRS images. Of them, 24 were found in Gaia DR2 and passed our test of the probability of false association . Of them, 11 have significant VLBI/Gaia DR2 offsets. The second component may be either a star or a merging galaxy. During galaxy mergers, the nuclei may be dislodged with respect to the center of mass of each individual galaxy. A study of such systems may help to constraint theories of galaxy mergers. However, the number of such systems is small (11 out of 2293 identified in Makarov et al. (2017), i.e., 0.5%).
5 Summary and conclusions
Here we summarize the main results of our comparison of AGN positions and proper motions from the Gaia DR2 against the most complete catalogue of VLBI positions to date, the RFC.
-
1.
The Gaia DR2 AGN position uncertainties of VLBI matched sources are a factor of two smaller than the VLBI position uncertainties. Gaia position catalogues are becoming the most precise astrometry catalogues at present.
-
2.
We predicted in Petrov & Kovalev (2017b) that the improvement in accuracy of VLBI and/or Gaia will not reconcile the VLBI and Gaia positions, but will make these differences more significant. This prediction has come true. The fraction of outliers grew from 6 to 9%, and the distribution of the position offset directions as a function of angle became sharper.
-
3.
We demonstrated that the main reason for the statistically significant VLBI/Gaia position offset is the presence of optical structure. Among the matched sources with the normalized arc lengths exceeding 4 that have measured jet directions, 52%–62%, i.e., the majority, have the position offsets parallel to the jet direction. Therefore, we conclude that the optical jet is the cause. Although this fraction may be somewhat lower for the entire population of matched AGNs, we got its firm lower limit: 27%. Other reasons mentioned by Mignard et al. (2018) can explain only a small fraction of outliers.
The presence of emission from a host galaxy within the Gaia point spread function may shift the centroid with respect to the nucleus if the galaxy central region structure is asymmetric or the AGN is dislodged with respect to the galaxy center of mass, we assume such a shift is independent on jet direction angle in the absence of evidence of such a dependency. Table 1 provides the upper limit of the fraction of outliers which position offsets do not depend on : 33%. It does not seem likely that all of these offsets are caused by the contribution of host galaxies, because the fraction of AGNs with discernible host galaxies is much less.
-
4.
We found that scaling the Gaia position uncertainties by eliminated the dependence of the fraction of outliers on . Examining the subset of matches with dominating VLBI or Gaia errors allowed us to evaluate the scaling factors for the VLBI uncertainties, 1.30, and the Gaia position uncertainties: . Eliminating the observations within 0.5 rad of and and using re-scaled uncertainties, made the distribution of normalized VLBI/Gaia arc-lengths much closer to the Rayleigh distribution: compare Figures 2 and 5.
-
5.
The contribution of VLBI and/or Gaia systematic errors on estimates of the orientation angles of the Gaia DR2 catalogue with respect to the VLBI catalogue does not exceed 0.02 mas.
-
6.
We predicted in Petrov & Kovalev (2017b) that flares in AGNs would cause a jitter in their positions because an increase of flux in one of the components of an extended source will change the centroid position. The analysis of Gaia proper motions provided us an indirect confirmation of this prediction: the sources with excessive Gaia residuals, i.e., large /ndf, have proper motion directions predominately parallel to the jet directions. The median magnitude of statistically significant proper motions is larger than 1 mas/yr over a 1.16 year interval, which is significantly higher than mas/yr over 5 years anticipated before the Gaia launch (Perryman et al., 2014). Although AGNs proper motions should not be interpreted as a bulk tangential motion, at the same time, these proper motions are not always artifacts of Gaia data analysis. The photo-centers of at least some quasars are not fixed points and the possibility of quasar proper motion should be taken into account in interpreting results of differential astrometry.
-
7.
We found that VLBI proper motions have a preferable direction along with the jet. Median VLBI proper motions of AGNs are a factor of 50 smaller than Gaia proper motions.
We do not claim that we have solved the problem of establishing the nature of all outliers. The distribution in Figure 5 still deviates from Rayleigh and we still did not uncover the nature of the 1/3 statistically significant offsets, but we made a quite substantial progress. We anticipate that a study of VLBI/Gaia position offsets will become a power tool for probing properties of the accretion disk and the relativistic jet in the AGNs, in line with the work of Plavin et al. (2018).
Acknowledgments
We used in our work the Astrogeo VLBI FITS image database222Available at http://astrogeo.org/vlbi_images that contains radio images contributed by A. Bertarini, L. Garcia, N. Corey, Y. Cui, L. Gurvits, X. He, D. Homan, S. Jorstad, S. Lee, R. Lico, M. Lister, E. Liuzzo, A. Marscher, C. Marvin, A. B. Pushkarev, E. Ros, T. Savolainen, K. Sokolovski, G. Taylor, A. de Witt, M. Xu, B. Zhang, and the authors. It is our pleasure to thank Eduardo Ros for suggestions that led to improvements of the manuscript.
This project is supported by the Russian Science Foundation grant 16-12-10481. This work has made use of data from the European Space Agency (ESA) mission Gaiaprocessed by the Gaia Data Processing and Analysis Consortium. Funding for the DPAC has been provided by national institutions, in particular the institutions participating in the Gaia Multilateral Agreement. We used in our work VLBA data provided by the Long Baseline Observatory that is a facility of the National Science Foundation operated under cooperative agreement by Associated Universities, Inc. This research has made use of the SIMBAD database, operated at CDS, Strasbourg, France.
References
- Browne et al. (2003) Browne I. W. A., et al., 2003, MNRAS, 341, 13
- Frouard et al. (2018) Frouard J., Johnson M. C., Fey A., Makarov V. V., Dorland B. N., 2018, AJ, 155, 229
- Gabuzda et al. (2006) Gabuzda D. C., Rastorgueva E. A., Smith P. S., O’Sullivan S. P., 2006, MNRAS, 369, 1596
- Jorstad et al. (2007) Jorstad S. G., et al., 2007, AJ, 134, 799
- Kovalev et al. (2005) Kovalev Y. Y., et al., 2005, AJ, 130, 2473
- Kovalev et al. (2017) Kovalev Y. Y., Petrov L., Plavin A. V., 2017, A&A, 598, L1
- Lindegren et al. (2012) Lindegren L., Lammers U., Hobbs D., O’Mullane W., Bastian U., Hernández J., 2012, A&A, 538, A78
- Lindegren et al. (2016) Lindegren L., et al., 2016, A&A, 595, A4
- Lindegren et al. (2018) Lindegren L., et al., 2018, A&A, p. A14
- Lister et al. (2016) Lister M. L., et al., 2016, AJ, 152, 12
- Liu et al. (2018a) Liu J.-C., Zhu Z., Liu N., 2018a, AJ, 156, 13
- Liu et al. (2018b) Liu J.-C., Malkin Z., Zhu Z., 2018b, MNRAS, 474, 4477
- Liu et al. (2018c) Liu N., Zhu Z., Liu J.-C., 2018c, A&A, 609, A19
- Ma et al. (1998) Ma C., et al., 1998, AJ, 116, 516
- Makarov et al. (2017) Makarov V. V., Frouard J., Berghea C. T., Rest A., Chambers K. C., Kaiser N., Kudritzki R.-P., Magnier E. A., 2017, ApJ, 835, L30
- Meyer et al. (2018) Meyer E. T., Petropoulou M., Georganopoulos M., Chiaberge M., Breiding P., Sparks W. B., 2018, ApJ, 860, 9
- Mignard et al. (2016) Mignard F., et al., 2016, A&A, 595, A5
- Mignard et al. (2018) Mignard F., Klioner S., Lindegren L., Hernandez J., Bastian U., Bombrun A., 2018, A&A, 616, A14
- Mimica et al. (2009) Mimica P., Aloy M.-A., Agudo I., Martí J. M., Gómez J. L., Miralles J. A., 2009, ApJ, 696, 1142
- Perlman et al. (2010) Perlman E. S., et al., 2010, ApJ, 708, 171
- Perryman et al. (2014) Perryman M., Spergel D. N., Lindegren L., 2014, ApJ, 789, 166
- Petrov & Kovalev (2017a) Petrov L., Kovalev Y. Y., 2017a, MNRAS, 467, L71
- Petrov & Kovalev (2017b) Petrov L., Kovalev Y. Y., 2017b, MNRAS, 471, 3775
- Plavin et al. (2018) Plavin A. V., Kovalev Y. Y., Petrov L., 2018, preprint (arXiv:1808.05115)
- Sinnnott & de Jager (1990) Sinnnott R. W., de Jager C., 1990, Space Sci. Rev., 54, 190
- Thompson et al. (2017) Thompson A. R., Moran J. M., Swenson Jr. G. W., 2017, Interferometry and Synthesis in Radio Astronomy, 3rd Edition. Springer, doi:10.1007/978-3-319-44431-4
- Wenger et al. (2000) Wenger M., et al., 2000, A&AS, 143, 9