Unusual electronic and vibrational properties in the
colossal thermopower material FeSb2
Abstract
The iron antimonide FeSb2 possesses an extraordinarily high thermoelectric power factor at low temperature, making it a leading candidate for cryogenic thermoelectric cooling devices. However, the origin of this unusual behavior is controversial, having been variously attributed to electronic correlations as well as the phonon-drag effect. The optical properties of a material provide information on both the electronic and vibrational properties. The optical conductivity reveals an anisotropic response at room temperature; the low-frequency optical conductivity decreases rapidly with temperature, signalling a metal-insulator transition. One-dimensional semiconducting behavior is observed along the axis at low temperature, in agreement with first-principle calculations. The infrared-active lattice vibrations are also symmetric and extremely narrow, indicating long phonon relaxation times and a lack of electron-phonon coupling. Surprisingly, there are more lattice modes along the axis than are predicted from group theory; several of these modes undergo significant changes below about 100 K, hinting at a weak structural distortion or phase transition. While the extremely narrow phonon line shapes favor the phonon-drag effect, the one-dimensional behavior of this system at low temperature may also contribute to the extraordinarily high thermopower observed in this material.
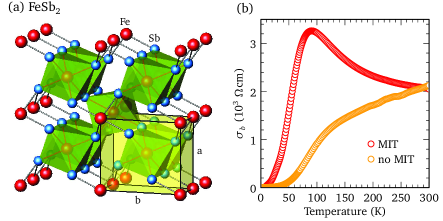
Introduction. FeSb2 crystallizes into an orthorhombic structure with two formula units per unit cell, as shown in Fig. 1(a). Despite this simple structure, there are two moieties of FeSb2 crystals, those with a putative metal-insulator transition (MIT) in which the dc conductivity along the b axis first increases below room temperature, reaching a broad maximum at about K, before decreasing dramatically as the temperature is further reducedJie et al. (2012), and a second class of materials without a MIT in which the dc conductivity immediately begins to decrease as the temperature is lowered Bentien et al. (2007); Sun et al. (2009, 2010); Jie et al. (2012), as shown in Fig. 1(b), for the two types of crystals examined in this work. Both classes of materials have a high thermoelectric power factor at low temperature; however, it is extraordinarily high in the materials with a MITJie et al. (2012). The thermoelectric efficiency is given by the dimensionless figure of merit , where , , , and are the conductivity, Seebeck coefficient, temperature, and thermal conductivity, respectively; the thermoelectric power is simply ; in FeSb2 the Seebeck coefficient may be as high as mV K-1 at low temperature, resulting in the highest power factor ever recorded Bentien et al. (2007). In general, there are two strategies for increasing ; reduce or increase the power factor . However, because the source of this large thermoelectric response is not entirely understood, with electronic correlations Petrovic et al. (2005); Perucchi, A. et al. (2006); Bentien et al. (2007); Sun et al. (2009, 2010); Herzog et al. (2010); Jie et al. (2012); Figueira, M.S. et al. (2012); Fuccillo et al. (2013); Sun et al. (2013); Takahashi et al. (2016), as well as the phonon-drag effect Tomczak et al. (2010); Pokharel et al. (2013); Liao et al. (2014); Battiato et al. (2015); Takahashi et al. (2016), having been proposed, it is not clear which approach offers the best chance of success.
The complex optical properties yield information about both the electronic and vibrational properties of a material, and can offer insights into the origin this unusual behavior. The real part of the optical conductivity is particularly useful as it yields information about the gapping of the spectrum of excitations in systems with a MIT, and in the zero-frequency limit, the dc conductivity is recovered, , allowing comparisons to be made with transport data. Furthermore, the infrared-active transverse-optic modes at the center of the Brillouin zone may be observed in as resonances superimposed upon an electronic background (or antiresonances if strong electron-phonon coupling is present). The optical properties of FeSb2 have been previously examined in the a-b planes Perucchi, A. et al. (2006) and along the c axis Herzog et al. (2010), revealing a semiconducting response at low temperature and evidence for electron-phonon coupling.
Results. Crystals of FeSb2 have been prepared by the usual methodsPetrovic et al. (2003); Bentien et al. (2006). The reflectance of several single crystals, with and without a MIT, has been measured over a wide frequency range ( meV to 4 eV) at a variety of temperatures for light polarized along the a, b, and c axes Homes et al. (1993) (Supplementary Fig. S1). Only naturally-occurring crystal faces have been examined, although after an initial measurement the c axis face was polished to remove some surface irregularities. Polishing broadens the lattice mode(s), but does not otherwise affect the optical properties. After the optical measurements were completed, the samples were dismounted and the dc resistivity, , was measured using a standard four-probe technique Jie et al. (2012) [the dc conductivity, , is shown along the axis in Fig. 1(b)].
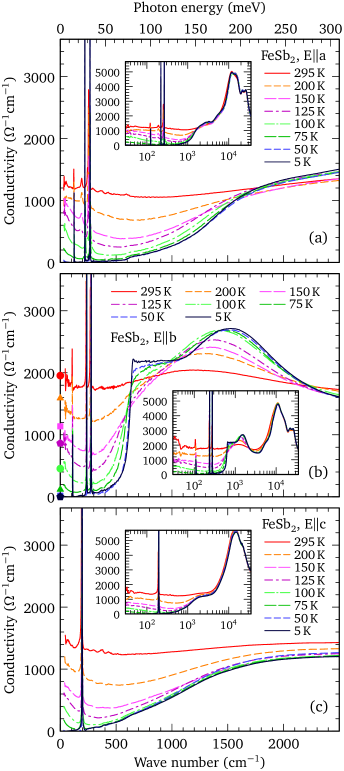
While the reflectance is a tremendously useful quantity, it is a combination of the real and imaginary parts of the dielectric function, and as such it is not necessarily intuitive or easily understood. It is much simpler to examine the real part of the optical conductivity, determined from a Kramers-Kronig analysis of the reflectance, Dressel and Grüner (2001) shown in the infrared region along the a, b, and c axes Figs. 2(a), (b), and (c) , respectively; the insets show the conductivity over a much wider frequency range. Interestingly, the temperature dependence of the reflectance for crystals with and without an MIT is identical in the infrared region (shown for light polarized along the b axis in Supplementary Fig. S2). Consequently, the low-frequency optical conductivity in Fig. 2 never shows the initial increase with decreasing temperature that is seen in the dc conductivity in samples with a MIT; instead, the low-frequency optical conductivity decreases with temperature along all three lattice directions, suggesting that no MIT is present. The apparent dichotomy between the temperature dependence of the dc resistivity and the optical conductivity in crystals with an MIT [Figs. 1(b) and S2(a)] indicates that the dc transport properties are being driven by an impurity band that is sufficiently narrow so that its response falls below our lowest measured frequency.
At room temperature, the real part of the optical conductivity may be described by a simple Drude model with Fano-shaped Lorentz oscillators to describe possible electron-phonon coupling,Homes et al. (2016)
| (1) |
where the first term denotes the (Drude) free carriers, with the square of the plasma frequency and scattering rate , where and are the carrier concentration and effective mass, respectively. The second term is a summation of oscillators with position , width , strength , and (dimensionless) asymmetry parameter , that describe the vibrations of the lattice or bound excitations (interband transitions); is the impedance of free space, yielding units for the conductivity of cm-1. In the limit a symmetric Lorentzian profile is recovered; however, as increases the line shape becomes increasingly asymmetric. The real part of the optical conductivity along the a and c axes at 295 K, shown in Figs. 2(a) and (c), respectively, are similar, with . Along the b axis the optical conductivity at room temperature is higher, with [Fig. 2(b)]. Fits to the optical conductivity at 295 K describe the data quite well and yield , 6770 and 6480 cm-1, and , 400 and 490 cm-1 along the a, b, and c axes, respectively (Supplementary Fig. S3); the optical conductivity along the b axis at room temperature is shown in Fig. 3(a). This anisotropy suggests that is slightly lower along the a axis, and that the larger value for along the b axis is a consequence of a lower scattering rate (Supplementary Table 1). As Fig. 2 indicates, the Drude component begins to decrease rapidly in strength below room temperature, along all three directions, with a commensurate loss of spectral weight (the area under the conductivity curve) that is transferred from low to high frequency Perucchi, A. et al. (2006). The Drude model may be used to track the temperature dependence of and down to about 75 K, below which the free-carrier response becomes too small to observe in our measurements. The Drude expression for the dc conductivity, , decreases rapidly as the temperature is lowered, suggesting that the transport may be described by an activation energy using the Arrhenius equation,
| (2) |
where . Transport measurements typically identify two gaps in FeSb2, meV below about 20 K, and meV in the K temperature range Bentien et al. (2007); Sun et al. (2009, 2010); Jie et al. (2012). The Arrhenius relation describes the temperature dependence of along all three lattice directions quite well (see Supplementary Fig. S4), and yields values for the transport gap of , 19.5 and meV along the a, b, and c axes, respectively, in good agreement with the high-temperature values for the transport gap.
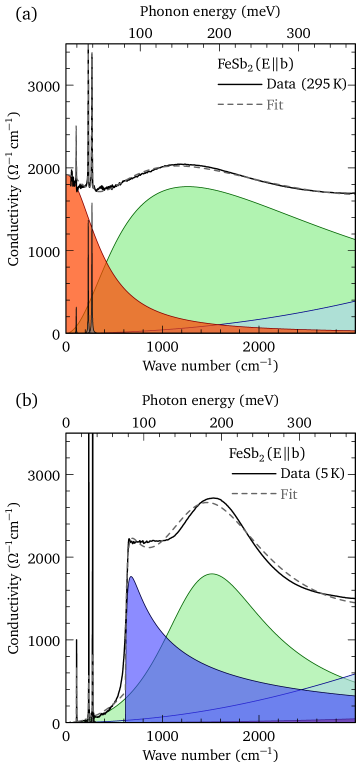
Discussion. While the Drude model with Fano-shaped Lorentz oscillators is able to reproduce the temperature-dependence of the optical conductivity along the a and c axes reasonably well, it fails to describe the sharp feature that develops along the b axis at low temperature. This step-like feature is the signature of a van Hove singularity in the density of states. The asymmetric profile in the real part of the low-temperature optical conductivity resembles the singularity response observed in one-dimensional semiconductors,
| (3) |
where , , and where is the semiconducting optical gap, and is the sine-Gordon coupling constant Controzzi et al. (2001). When this functional form is taken in linear combination with several Lorentzian oscillators, the optical conductivity is reproduced quite well with cm-1, cm-1, and , as shown in Fig. 3(b), clearly establishing the one-dimensional nature of the optical properties. The estimate for along the b axis considerably larger than ; however, it should be noted that the optical determination of probes only direct transitions between bands due to low momentum transfer. If the material has a direct gap, then the optical and transport gaps should be similar, ; however, in indirect-gap semiconductors, phonon-assisted transitions typically result in .
The observation of one-dimensional behavior in this material is of particular importance as it has been argued that lowered dimensionality may increase the value of the Seebeck coefficient Hicks and Dresselhaus (1993); Kim et al. (2009); Rhyee et al. (2009).
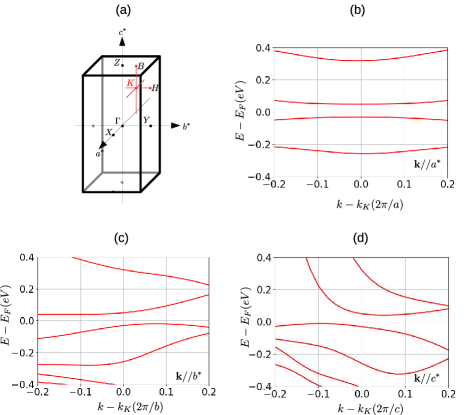
Electronic structure calculations can provide insight into the optical properties of a material. However, density functional theory (DFT) predicts a metallic rather than a semiconducting ground state, Tomczak et al. (2010) indicating that a more sophisticated approach is required. Consequently, first principle calculations have been performed using a linearized quasiparticle self-consistent GW and dynamical mean field theory (LQSGW+DMFT) approach Choi et al. (2016); DMF ; Kutepov et al. (2017) (details are provided in the Supplementary Information). Figure 4 shows the low-energy quasiparticle band structure near the K point () where the direct bandgap is a minimum. Here and are the reciprocal lattice vectors along the b and c axes. Around the K point, the calculation shows direct bandgap of meV, which is in a good agreement with the semiconducting optical gap of meV. In addition, low-dimensional behavior is observed near the K point; along the direction, quasiparticle bands for the conduction and valence electrons are almost flat, as illustrated by the quasiparticle band in Fig. 4(b). In contrast, the quasiparticle bands are dispersive along the and directions shown in Figs. 4(c) and (d). The fact that DMFT is necessary to generate a low-dimensional quasiparticle spectral function that is consistent with the semiconducting ground state indicates that electronic correlations are an essential ingredient in understanding the anisotropic optical and transport properties of FeSb2.
We now turn our attention to the equally interesting behavior of the infrared-active lattice modes. FeSb2 crystallizes in the orthorhombic space group, where c is the short axis [Fig. 1(a)]. The irreducible vibrational representation is then , of which only the , and modes are infrared-active along the c, b, and a axes, respectively Perucchi, A. et al. (2006). The temperature dependence of the real part of the optical conductivity has been projected onto the wave number versus temperature plane using the indicated color scales in Figs. 5(a), (b), and (c) for light polarized along the a, b, and c axes, respectively. The vibrations have been fit using oscillators with a Fano profile superimposed on an electronic background at 295 and 5 K (Supplementary Figs. S5, S6, and S7). The frequencies of the lattice modes at the center of the Brillouin zone and their atomic characters have also been calculated using first principles techniques and are in good agreement with previous results Miao et al. (2012); Lazarević et al. (2012) (details are provided in the Supplementary Information); the comparison between theory and experiment is shown in Table 1.
| Theory | Experiment | ||||||||||
| Character | 295 K | 5 K | |||||||||
| Mode | Fe | Sb | |||||||||
| 198 | 0.81 | 0.19 | 191.0 | 4.2 | 1030 | 195.1 | 1.0 | 1120 | |||
| 112 | 0.09 | 0.91 | 106.3 | 2.0 | 285 | 110.2 | 0.9 | 267 | |||
| 234 | 0.91 | 0.09 | 231.0 | 3.4 | 608 | 236.5 | 1.0 | 720 | |||
| 284 | 0.81 | 0.19 | 269.1 | 5.2 | 723 | 276.9 | 1.3 | 900 | |||
| 125 | 0.10 | 0.90 | 120.8 | 2.1 | 203 | 123.4 | 0.8 | 229 | |||
| — | — | — | 191.3 | 12.9 | 355 | — | — | — | |||
| — | — | — | — | — | — | 220.1 | 0.8 | 672 | |||
| 252 | 0.98 | 0.02 | 242.9 | 6.1 | 289 | 251.2 | 3.0 | 130 | |||
| 260 | 0.74 | 0.26 | 253.7 | 5.6 | 743 | 266.4 | 1.3 | 796 | |||
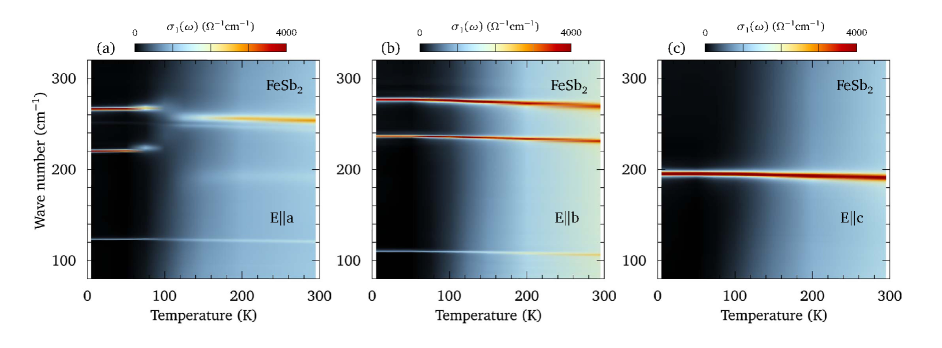
The behavior of the lattice modes are remarkable in several ways. Along the a, b and c axes the vibrations have line widths that are up to an order of magnitude smaller than the previously reported values Perucchi, A. et al. (2006); Herzog et al. (2010); at low temperature all the modes are extremely sharp and several have line widths of less than 1 cm-1, a result that has also been observed in some Raman-active modes Lazarević et al. (2010). The narrow line widths imply long phonon lifetimes () and mean-free paths, consistent with the suggestion of quasi-ballistic phonons Takahashi et al. (2016); Battiato et al. (2015), which affect through the phonon-drag effect where the phonon current drags the charge carriers, giving rise to an additional thermoelectric voltage Geballe and Hull (1954); Herring (1954); Weber and Gmelin (1991). In addition, while several of the infrared-active vibrations were previously reported to have a slightly asymmetric profile at high temperature Perucchi, A. et al. (2006); Herzog et al. (2010), in this work all the line shapes appear to be symmetric (), indicating that electron-phonon coupling is either very weak or totally absent. The single mode along the c axis, and the three modes along the b axis, shown in Figs. 5(c) and (b), respectively, increase in frequency (harden) with decreasing temperature, and are in excellent agreement with the calculated values (Table 1).
The behavior of the lattice modes along the a axis in Fig. 5(a) are dramatically different. At room temperature the three modes observed at , 243 and 254 cm-1 are in good agreement well with the calculated values for the modes at 125, 252, and 260 cm-1, respectively; however, a fourth reasonably strong mode at 191 cm-1 is also observed that is considerably broader than the other vibrations. As the temperature is reduced the mode at 191 cm-1 actually decreases slightly in frequency, while the remaining modes harden. Below about 100 K, the mode at cm-1 vanishes and a new, very strong mode appears at cm-1, while at the same time the modes at 243 and 254 cm-1 both shift to slightly higher frequencies; the mode at 121 cm-1 shows no signs of any anomalous behavior [Fig. 5(a) and Fig. S5]. The fate of the 191 cm-1 mode is uncertain; however, it is unlikely that it has evolved into the 220 cm-1 mode due to the large difference in oscillator strengths (Table 1). It is also unlikely that this is a manifestation of the mode, which has a comparable frequency, because that feature does not display the unusual temperature dependence of the mode observed along the a axis, nor is there any evidence of it along the b axis. The dramatic change in the nature of the lattice modes along the a axis at precisely the temperature where the resistivity begins to increase dramatically suggests there is a weak structural distortion or phase transition.
Summary. To conclude, the temperature dependence of the optical and dc transport properties of single crystals of FeSb2, both with and without a MIT, have been examined over a wide temperature and spectral range, along all three lattice directions. While the temperature dependence of the optical properties are essentially identical in the two types of crystals, the dc transport properties are dramatically different. This dichotomy can be explained by the presence of a sample-dependent impurity band that lies below the optical measurements. The optical conductivity in both types of crystals reveals an anisotropic response at room temperature, and singular behavior at low temperature along the axis, demonstrating a one-dimensional semiconducting response with meV, in agreement with ab inito calculations. The lattice modes along the and axes have symmetric profiles which narrow and harden with decreasing temperature, and their positions are in good agreement with first principles calculations. However, along the a axis there is an extra mode above 100 K; below this temperature the resistivity increases rapidly and the high-frequency vibrational modes undergo significant changes that hint a weak structural distortion or transition. Transport studies along this direction may shed light on the nature of this peculiar behavior. Although electron-phonon coupling is apparently either very weak or totally absent in this material, the fact that DMFT is required to reproduce the semiconducting ground state and anisotropic response indicates that electronic correlations play an important role in the optical and transport properties. While the extremely narrow phonon line shapes support the phonon-drag explanation of the high thermoelectric power, electronic correlations and the low-dimensional behavior along the b axis may also enhance the Seebeck coefficient Hicks and Dresselhaus (1993); Kim et al. (2009); Rhyee et al. (2009), making it likely that both contribute to the extremely high thermopower observed in FeSb2.
Methods. The temperature dependence of the absolute reflectance was measured at a near-normal angle of incidence using an in situ evaporation method Homes et al. (1993) over a wide frequency range on Bruker IFS 113v and Vertex 80v spectrometers. In this study mirror-like as-grown faces of single crystals have been examined. After an initial measurement, the c-axis face was determined to have a minor surface irregularity, so it was was polished and remeasured. Polishing broadens the lattice mode somewhat, but the electronic properties were not affected. The temperature dependence of the reflectance was measured up to eV, while polarization studies were conducted up to at least 3 eV. The complex optical properties were determined from a Kramers-Kronig analysis of the reflectance Dressel and Grüner (2001). The Kramers-Kronig transform requires that the reflectance be determined for all frequencies, thus extrapolations must be supplied in the limits. In the metallic state the low frequency extrapolation follows the Hagen-Rubens form, , while in the semiconducting state the reflectance was continued smoothly from the lowest measured frequency point to and 0.68 along the a and c axes, respectively, and along the b axis. The reflectance is assumed to be constant above the highest measured frequency point up to cm-1, above which a free electron gas asymptotic reflectance extrapolation is employed Wooten (1972).
Acknowledgments. The authors are grateful to T. Besara and T. Siegrist for confirming the crystal orientation. The authors would like to acknowledge useful discussions with T. M. Rice, A. Tsvelik, T. Valla, R. Yang, and I. Zaliznyak. Research supported by the U.S. Department of Energy, Office of Basic Energy Sciences as part of the Computation Material Science Program through the Center for Computational Material Spectroscopy and Design, and the Division of Materials Sciences and Engineering under Contract No. DE-SC0012704.
References
- Jie et al. (2012) Qing Jie, Rongwei Hu, Emil Bozin, A. Llobet, I. Zaliznyak, C. Petrovic, and Q. Li, “Electronic thermoelectric power factor and metal-insulator transition in FeSb2,” Phys. Rev. B 86, 115121 (2012).
- Bentien et al. (2007) A. Bentien, S. Johnsen, G. K. H. Madsen, B. B. Iversen, and F. Steglich, “Colossal Seebeck coefficient in strongly correlated semiconductor FeSb2,” EPL 80, 17008 (2007).
- Sun et al. (2009) P Sun, N Oeschler, S Johnsen, B B Iversen, and F Steglich, “Thermoelectric properties of the narrow-gap semiconductors FeSb2 and RuSb2 : A comparative study,” Journal of Physics: Conference Series 150, 012049 (2009).
- Sun et al. (2010) Peijie Sun, Niels Oeschler, Simon Johnsen, Bo B. Iversen, and Frank Steglich, “Narrow band gap and enhanced thermoelectricity in FeSb2,” Dalton Trans. 39, 1012–1019 (2010).
- Petrovic et al. (2005) C. Petrovic, Y. Lee, T. Vogt, N. Dj. Lazarov, S. L. Bud’ko, and P. C. Canfield, “Kondo insulator description of spin state transition in FeSb2,” Phys. Rev. B 72, 045103 (2005).
- Perucchi, A. et al. (2006) Perucchi, A., Degiorgi, L., Hu, Rongwei, Petrovic, C., and Mitrović, V. F., “Optical investigation of the metal-insulator transition in FeSb2,” Eur. Phys. J. B 54, 175–183 (2006).
- Herzog et al. (2010) A. Herzog, M. Marutzky, J. Sichelschmidt, F. Steglich, S. Kimura, S. Johnsen, and B. B. Iversen, “Strong electron correlations in FeSb2: An optical investigation and comparison with RuSb2,” Phys. Rev. B 82, 245205 (2010).
- Figueira, M.S. et al. (2012) Figueira, M.S., Silva-Valencia, J., and Franco, R., “Thermoelectric properties of the Kondo insulator FeSb2,” Eur. Phys. J. B 85, 203 (2012).
- Fuccillo et al. (2013) M. K. Fuccillo, Q. D. Gibson, Mazhar N. Ali, L. M. Schoop, and R. J. Cava, “Correlated evolution of colossal thermoelectric effect and Kondo insulating behavior,” APL Mater. 1, 062102 (2013).
- Sun et al. (2013) Peijie Sun, Wenhu Xu, Jan M. Tomczak, Gabriel Kotliar, Martin Søndergaard, Bo B. Iversen, and Frank Steglich, “Highly dispersive electron relaxation and colossal thermoelectricity in the correlated semiconductor FeSb2,” Phys. Rev. B 88, 245203 (2013).
- Takahashi et al. (2016) H. Takahashi, R. Okazaki, S. Ishiwata, H. Taniguchi, A. Okutani, M. Hagiwara, and I. Terasaki, “Colossal Seebeck effect enhanced by quasi-ballistic phonons dragging massive electrons in FeSb2,” Nature Commun. 7, 12732 (2016).
- Tomczak et al. (2010) Jan M. Tomczak, K. Haule, T. Miyake, A. Georges, and G. Kotliar, “Thermopower of correlated semiconductors: Application to and ,” Phys. Rev. B 82, 085104 (2010).
- Pokharel et al. (2013) Mani Pokharel, Huaizhou Zhao, Kevin Lukas, Zhifeng Ren, Cyril Opeil, and Bogdan Mihaila, “Phonon drag effect in nanocomposite FeSb2,” MRS Commun. 3, 31–36 (2013).
- Liao et al. (2014) Bolin Liao, Sangyeop Lee, Keivan Esfarjani, and Gang Chen, “First-principles study of thermal transport in FeSb2,” Phys. Rev. B 89, 035108 (2014).
- Battiato et al. (2015) M. Battiato, J. M. Tomczak, Z. Zhong, and K. Held, “Unified Picture for the Colossal Thermopower Compound ,” Phys. Rev. Lett. 114, 236603 (2015).
- Holseth and Kjekshus (1968) Hans Holseth and Arne Kjekshus, “Compounds with the Marcasite Type Crystal Structure. IV. The Crystal Structure of FeSb2,” Acta Chem. Scand. 23, 3043–3050 (1968).
- Petrovic et al. (2003) C. Petrovic, J. W. Kim, S. L. Bud’ko, A. I. Goldman, P. C. Canfield, W. Choe, and G. J. Miller, “Anisotropy and large magnetoresistance in the narrow-gap semiconductor FeSb2,” Phys. Rev. B 67, 155205 (2003).
- Bentien et al. (2006) A. Bentien, G. K. H. Madsen, S. Johnsen, and B. B. Iversen, “Experimental and theoretical investigations of strongly correlated FeSb2-xSnx,” Phys. Rev. B 74, 205105 (2006).
- Homes et al. (1993) Christopher C. Homes, M. Reedyk, D. A. Crandles, and T. Timusk, “Technique for measuring the reflectance of irregular, submillimeter-sized samples,” Appl. Opt. 32, 2976–2983 (1993).
- Dressel and Grüner (2001) M. Dressel and G. Grüner, Electrodynamics of Solids (Cambridge University Press, Cambridge, 2001).
- Homes et al. (2016) C. C. Homes, Y. M. Dai, J. Schneeloch, R. D. Zhong, and G. D. Gu, “Phonon anomalies in some iron telluride materials,” Phys. Rev. B 93, 125135 (2016).
- Controzzi et al. (2001) D. Controzzi, F. H. L. Essler, and A. M. Tsvelik, “Optical Conductivity of One-Dimensional Mott Insulators,” Phys. Rev. Lett. 86, 680–683 (2001).
- Hicks and Dresselhaus (1993) L. D. Hicks and M. S. Dresselhaus, “Thermoelectric figure of merit of a one-dimensional conductor,” Phys. Rev. B 47, 16631(R) (1993).
- Kim et al. (2009) Raseong Kim, Supriyo Datta, and Mark S. Lundstrom, “Influence of dimensionality on thermoelectric device performance,” J. App. Phys. 105, 034506 (2009).
- Rhyee et al. (2009) Jong-Soo Rhyee, Kyu Hyoung Lee, Sang Mock Lee, Eunseog Cho, Sang Il Kim, Eunsung Lee, Yong Seung Kwon, Ji Hoon Shim, and Gabriel Kotliar, “Peierls distortion as a route to high thermoelectric performance in In4Se3-δ crystals,” Nature 459, 965–968 (2009).
- Choi et al. (2016) Sangkook Choi, Andrey Kutepov, Kristjan Haule, Mark van Schilfgaarde, and Gabriel Kotliar, “First-principles treatment of Mott insulators: linearized QSGW+DMFT approach,” Quantum Materials 1, 16001 (2016).
- (27) For the GW part of the LQSGW+DMFT scheme, the code FlapwMBPT was used (http://scgw.physics.rutgers.edu).
- Kutepov et al. (2017) A. L. Kutepov, V. S. Oudovenko, and G. Kotliar, “Linearized self-consistent quasiparticle GW method: Application to semiconductors and simple metals,” Comp. Phys. Commun. 219, 407–414 (2017).
- Miao et al. (2012) Rende Miao, Guiqin Huang, Chunhui Fan, Zhong Bai, Yanbiao Li, Liang Wang, Li an Chen, Wenguang Song, and Qiangui Xu, “First-principles study on the lattice dynamics of FeSb2,” Solid State Commun. 152, 231–234 (2012).
- Lazarević et al. (2012) N. Lazarević, M. M. Radonjić, D. Tanasković, Rongwei Hu, C. Petrovic, and Z. V. Popović, “Lattice dynamics of FeSb2,” J. Phys.: Condens. Matter 24, 255402 (2012).
- Lazarević et al. (2010) N. Lazarević, Z. V. Popović, Rongwei Hu, and C. Petrovic, “Evidence for electron-phonon interaction in FeSb2 ( Co and Cr; ) single crystals,” Phys. Rev. B 81, 144302 (2010).
- Geballe and Hull (1954) T. H. Geballe and G. W. Hull, “Seebeck Effect in Germanium,” Phys. Rev. 94, 1134–1140 (1954).
- Herring (1954) Conyers Herring, “Theory of the Thermoelectric Power of Semiconductors,” Phys. Rev. 96, 1163–1187 (1954).
- Weber and Gmelin (1991) L. Weber and E. Gmelin, “Transport properties of silicon,” Appl. Phys. A 53, 136–140 (1991).
- Wooten (1972) F. Wooten, Optical Properties of Solids (Academic Press, New York, 1972) pp. 244–250.
![[Uncaptioned image]](/html/1808.04786/assets/x6.png)
![[Uncaptioned image]](/html/1808.04786/assets/x7.png)
![[Uncaptioned image]](/html/1808.04786/assets/x8.png)
![[Uncaptioned image]](/html/1808.04786/assets/x9.png)
![[Uncaptioned image]](/html/1808.04786/assets/x10.png)
![[Uncaptioned image]](/html/1808.04786/assets/x11.png)
![[Uncaptioned image]](/html/1808.04786/assets/x12.png)
![[Uncaptioned image]](/html/1808.04786/assets/x13.png)
![[Uncaptioned image]](/html/1808.04786/assets/x14.png)