Spin fluctuations in the light-induced high spin state of Cobalt valence tautomers
Abstract
We present a study of the static magnetic properties and spin dynamics in Cobalt valence tautomers (VT), molecules where a low-spin (LS) to high-spin (HS) crossover driven by an intramolecular electron transfer can be controlled by the temperature, by the external pressure or by light irradiation. In the investigated complex, a LS-Co(III) ion bound to a dinegative organic ligand can be reversibly converted into the HS-Co(II) bound to a mononegative one. By combining magnetization measurements with Nuclear Magnetic Resonance (NMR) and Muon Spin Relaxation (SR), we have investigated the static magnetic properties and the spin dynamics as a function of the temperature. Moreover, the effect of the external pressure as well as of the infrared light irradiation have been explored through magnetometry and NMR measurements to determine the spin dynamics of the HS state. The photoinduced HS state, which can have a lifetime of several hours below 30 K, is characterized by spin dynamics in the MHz range, which persist at least down to 10 K. The application of an external pressure causes a progressive increase of the LS-HS crossover, which reaches room temperature for pressures around 10 kbar.
I Introduction
In the trend towards miniaturization of magnetic data storage media, the ultimate size reduction of the information units is limited by the superparamagnetism of nanosized magnetic media as well as by the complexity of achieving controlled electrical contacts at the nanoscale with a low dissipation White2000 ; Richter2009 ; Moser2002 . An appealing solution to both challenges would be a combination of functional switchable molecules as bits and the use of light irradiation as read/write protocols Andreasson2015 ; Pischel2010 ; Dvornikov2009 . Single molecules have already shown to mimic electronic device architectures, suggesting the viability of this approach Song2011 ; Bogani2008 ; Mannini2009 ; Weibel2007 . Among them, iron(II)-based spin crossover complexes are a paradigmatic example of bistable materials where the magnetic state can be changed from a low-spin (LS) diamagnetic configuration into a high-spin (HS) paramagnetic one through a variety of external stimuli, including light irradiation, temperature variation and pressure application Halcrow2013 ; Decurtins1984 ; Decurtins1985 ; Gutlich2005 .
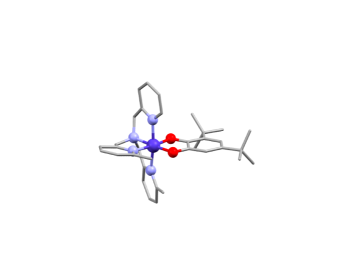
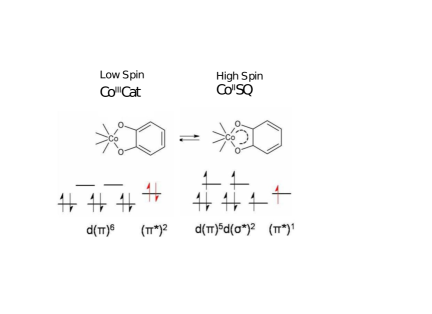
Another class of materials characterized by the possibility of reversibly switching among different electronic states is the one of Valence Tautomers (VT) Tezgerevska2014 ; Gutlich1997 ; Pierpont2001 ; Adams1993 ; Carbonera2004 ; Tao2006 ; Caneschi1998 ; Dei2010 . VT are constituted by a metal ion bound to a redox-active ligand: in these systems the two states can be interconverted by an intramolecular electron transfer between the metal ion and the ligand, followed by a change of the spin state of the ion. In the most investigated family of VTs, the two main building blocks are a cobalt ion and an organic ligand belonging to the dioxolene family (Fig. 1a). Two different electronic states can be realized (Fig. 1b): LS-Co(III) coupled to the ligand in its binegative diamagnetic state (Co(III)-catecholato state, with two electrons in the organic ligand molecular orbital) and HS-Co(II) bound to the ligand in its oxidized mononegative radical form (Co(II)-semiquinonato state, with only one electron in the orbital of the ligand) Dapporto2008 (we will refer to the low spin and high spin magnetic states with LS and HS, respectively, for the sake of simplicity). The interconversion between the two states can be driven by the temperature. The technological interest for these systems originates from the possibility to control the spin state via thermal, structural, optical and magnetic perturbations Poneti2010 , suggesting the use of these materials in the next generation of molecular spintronic devices Droghetti2011 . Moreover, it is possible to nanostructure them on a solid substrate via wet chemistry strategies, while keeping switchability at the nanoscale Poneti2015 ; Vazquez2016 . Furthermore, VT are, together with spin-crossover systems, good candidates for pressure sensors Roux1996 ; Caneschi2001 ; Li2008b ; Gutlich2004 , since the VT transition can be tuned by pressure and be revealed by a change in the light absorption spectrum of the material.
Remarkably, at low temperature cobalt-dioxolene electronic state can be switched with light irradiation Sato2007 ; Dapporto2008 . In order to exploit this feature to implement them as logic units, it is necessary to investigate both the lifetime of the photoinduced HS state as well as its spin dynamics. To determine the former, we have used a SQUID magnetometer coupled to an IR laser diode, while for the latter we have investigated the spin dynamics by means of magnetic resonance techniques. In particular, it is of major importance to determine how the spin fluctuations in VT evolve with temperature when the system is driven to the HS state by light irradiation, by using local-probe techniques as nuclear magnetic resonance (NMR) and muon spin relaxation (SR), since these fluctuations determine how long the information will be preserved before it gets lost. Moreover these techniques can be used to detect the effect of an external pressure on the VT state Sato2002 ; Adams1995 ; Sato2007 ; Dapporto2008 ; Poneti2015 ; Cui2004 ; Dai2013 .
We start by discussing the results of the SQUID experiments, which allowed to derive the temperature dependence of the magnetization, its build-up times under light irradiation and the effect of the external pressure on the LS-HS crossover temperature. Then we show how 1H NMR and SR allow us to investigate the low temperature dynamics of the HS molecules and the microscopic effects of the light and external pressure. Finally, 59Co NMR is exploited to deeply investigate the spin fluctuations of the light induced HS molecules at low temperatures.
II Experimental methods and results
II.1 SQUID
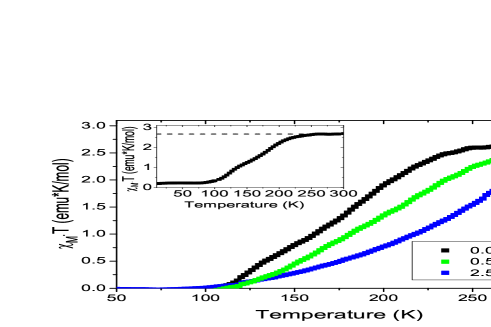
The synthesis of the powder sample was carried out following a previously published procedure Dapporto2008 . The temperature dependence of the magnetic susceptibility was measured with an MPMSXL7 SQUID magnetometer, by cooling (4 K/min) in 0.1 T (inset of Fig. 2). A clear reduction of is observed, with a broad crossover from the HS to the LS state extending from 200 to 100 K and centered around 160 K Dapporto2008 . This crossover most likely reflects the presence of two overlapping transitions, which are associated with crystallographically inequivalent molecules in the lattice Dapporto2008 . The temperature dependence of was also investigated at different external pressures, by using a CuBe pressure cell (EasyLab, Mcell 10). Even if the background contribution from the cell modifies the shape of curves, upon increasing the pressure (measured with a Sn manometer) there is a clear progressive increase in the LS-HS crossover temperature (Fig. 2).
In order to irradiate the sample an optical fiber was placed along the SQUID stick and coupled with an external infrared Laser diode (Thorlabs M940F1), with a central wavelength of 940 nm and a measured output power around 6 mW at the end of the fiber. Under light irradiation, in the 4 - 55 K temperature range, was found to increase with time (Fig. 3). The susceptibility build-up can nicely be fit with a stretched exponential recovery law plus a constant term corresponding to the susceptibility value prior to irradiation:
| (1) |
is the light enhanced magnetic susceptibility, the build-up time and a stretching exponent with values ranging from 0.50, at T = 4 K, to 0.70, at T = 55 K.
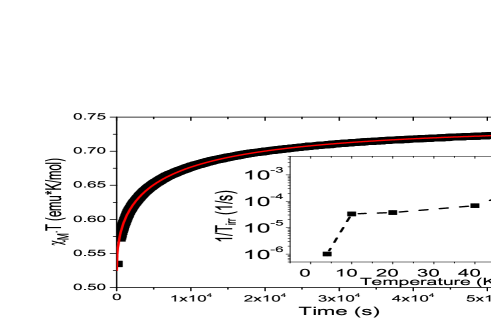
The build-up time increases at low temperatures and reaches several hours at 10 K. After switching off the light irradiation the susceptibility decays back to its thermal equilibrium value with an initial stretched exponential decay Beni2006 ; Li2008 , with a different decay time, reaching about s at 20 K (see Supplementary Material).
II.2 Nuclear Magnetic Resonance
1H (nuclear spin ) NMR experiments have been performed in 1.5, 1.1 and a 0.67 T in the 5 - 300 K temperature range. The 1H NMR spectrum was derived from the Fourier transform of half of the echo signal after a solid echo pulse sequence. The spectrum is characterized by a Gaussian shape with a weakly temperature dependent linewidth, increasing from 20 to 30 kHz by decreasing the temperature down to 10 K. 1H nuclear spin-lattice relaxation rate was derived from the recovery of nuclear magnetization after a saturation recovery pulse sequence. The recovery law was a stretched exponential:
| (2) |
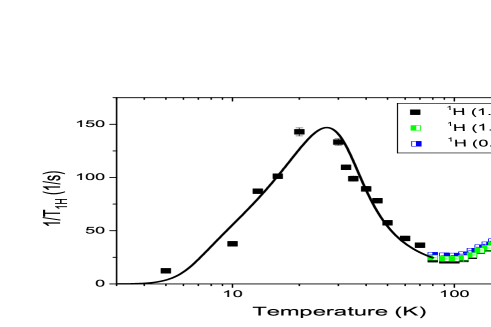
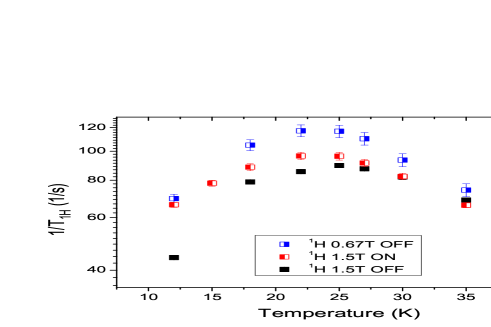
where is the 1H thermal equilibrium magnetization and a stretching exponent, ranging between 0.70 and 0.95, which accounts for a distribution of relaxation times due to the presence of inequivalent 1H sites. The temperature dependence of is shown in Fig. 4, for different values of the external magnetic field, for a cooling rate of 1 K/min. One notices a very slight decrease of the relaxation rate around room temperature by increasing the magnetic field strength (see Fig 4). The temperature dependence of is characterized by a high temperature plateau, by a drop on cooling across the HS-LS crossover and then by a marked peak centered around 20 K. This peak was investigated also with a faster cooling rate (6 K/min) at two different magnetic fields, as shown in Fig. 5. By comparing the results shown in Figs. 4 and 5 for T, one can notice that the peak in strongly depends on the cooling rate. Moreover, by increasing the magnetic field the peak intensity decreases.
Irradiation was achieved by using two 910 nm LEDs (Thorlabs LED910E), with an output power of 8 mW, placed close to the sample. The LEDs were switched on at room temperature, then the sample was cooled down to 15 K, kept at this temperature for several hours and then the measurements were carried out upon increasing the temperature, with LEDs switched on. One observes a slight increase of low peak under light irradiation (Fig. 5).
To explore the effect of pressure on the LS-HS conversion, high pressure 1H NMR experiments have been performed in a 4.69 T magnetic field at 300 K. The applied pressure ranged from 0 to 14 kbar, and was progressively increased in 2 kbar steps. The proton spin-lattice relaxation rate pressure dependence is shown in Fig. 6.

59Co () NMR measurements have been performed in a 6.95 T magnetic field. 59Co NMR powder spectrum, broadened by the quadrupolar coupling, was derived by recording the amplitude of the echo obtained after a Hahn echo saturation recovery sequence upon varying the irradiation frequency. The spectrum (see the inset to Fig.7, for T = 5 K) is characterized by a central peak, associated with the central transition, and by featureless less intense shoulders associated with the satellite transitions, which extend over several MHz.
The spin-lattice relaxation rate has been measured irradiating the central transition. The intensity of this line is observed to significantly decrease upon increasing the temperature and the signal could be detected only up to about 180 K (Fig. 8). At higher temperature, where almost all VT are in the HS state the fast nuclear relaxation prevents the observation of the 59Co NMR signal. In other terms, the signal being detected is the one arising from nuclei of VT molecules in the LS state. was derived by fitting the recovery of the nuclear magnetization after a saturation recovery pulse sequence with the recovery law for the central NMR line of nuclei Suter1998 . The temperature dependence of is shown in Fig.7.
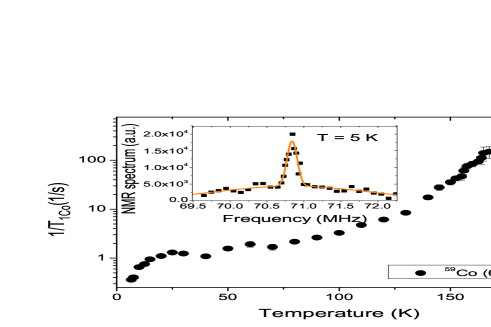
Fig. 8 shows the decrease of the product of the normalized signal intensity with the temperature.

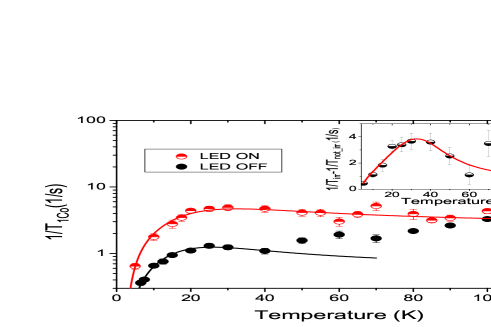
As in the case of 1H NMR experiments, the sample was irradiated with two LEDs (Thorlabs LED910E) mounted close to the sample and a cooling rate of 6 K/min was used during the 59Co NMR measurements, and the same heating sequence used for 1H NMR measurements was followed (except that the sample was cooled down to 5 K instead of 15 K). The light irradiation is found to cause a significant increase in (Fig.9) below 100 K.
II.3 Muon Spin Relaxation
SR experiments have been carried out at ISIS facility on HIFI beam line. The measurements have been performed both in Zero Field (ZF) and in a 200 Gauss Longitudinal magnetic field (LF). The decay of the muon asymmetry in ZF, after background corrections, has been fit with a simple exponential decay
| (3) |
where is the muon’s ZF decay rate. It is noticed that in zero field corresponds to about half of the total initial asymmetry, likely due to the presence of a muonium fraction Patterson1988 . The application of the longitudinal field causes both an increase in the initial asymmetry and a slowing down of the relaxation at high temperatures (see Supplementary Material). Muon’s asymmetry in LF runs can be reproduced with a stretched exponential decay:
| (4) |
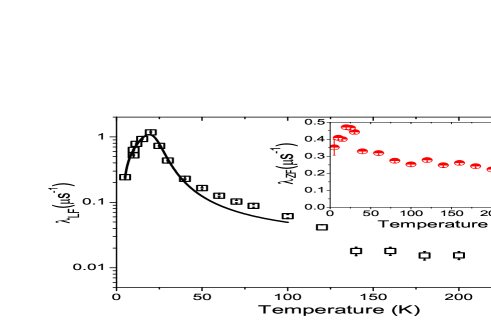
where is the longitudinal relaxation rate and a stretching exponent, with values ranging from about 0.35 at low temperatures to 0.60 at 20 - 25 K and to 0.50 at higher temperature. As it can be noticed from Fig. 10, muon relaxation is faster at low temperature and both in ZF and LF experiments a peak around 20 K is detected.
III Discussion
The temperature dependence of (inset of Fig.2) clearly shows that all molecules are paramagnetic at high temperature and start becoming diamagnetic upon decreasing the temperature below 200 K, as expected for this compound.Poneti2010 ; Dapporto2008 The high temperature plateau ( 2.67 emu K/mol, corresponding to 3.35 10-5 m3K/mol, there is a conversion factor between CGS and SI units) is expected for an ensemble of non interacting paramagnetic molecules:
| (5) |
where is the Avogadro number and the Landé factor. The sum of the contribution from the uncoupled radical (S=, emu K/mol) and from the high spin Co(II) ( emu K/mol that is the sum of a S=3/2 contribution (see Fig. 1) with emu K/mol and of an orbital term) yields a value around 2.9 emu K/mol Dapporto2008 , close to the experimental one. On the other hand, a ferromagnetic coupling between the HS-Co(II) ion and the radical would give rise to a local S = 2 spin, which would yield a value of about 3.2 - 3.4 emu K/mol, which is above the detected one. Notice that an antiferromagnetic coupling, would yield an S=1 state and a value for = 1 emu K/mol, quite different from the experimental. Hence, the configuration with a local S=3/2 Co(II) ion decoupled from the S=1/2 radical seems to provide the best description for the high temperature HS state Dapporto2008 .
The fraction of molecules which remain in the HS state even at low temperatures is given by:
| (6) |
where is the magnetic susceptibility of the LS state and is the magnetic susceptibility of an isostructural compound, not displaying the VT transition, which remains in the HS state over the whole temperature range Beni2008 . It is found that about 3 of the molecules remain in the HS state at 5 K, a value close to that found in the same compound Tayagaki2005 .
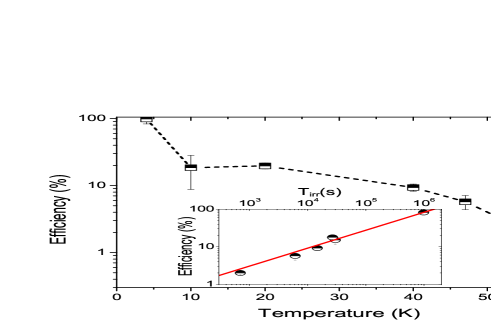
Irradiation at cryogenic temperatures with infrared light promotes molecules from the LS to the HS state and enhances the magnetization (Fig. 3) Dapporto2008 ; Neuwahl2002 ; Gentili2005 ; Schmidt2010 ; Beni2007 . The build-up times can reach several hours Schmidt2010 , making the whole process quite slow. The efficiency of the conversion, namely the fraction of molecules converted in the HS state, can be estimated as:
| (7) |
As the temperature is decreased the light conversion efficiency improves, due to the increased HS lifetime (Fig. 11). In other terms, as the temperature increases, thermal relaxation, driving the VT back to thermal equilibrium with the lattice (i.e. to the LS state), hinders the efficiency of light irradiation. The incomplete conversion achieved at 4 K (98 ) may also be due to the partial penetration of the light throughout the sample volume. It takes more than 8 hours to reach a conversion efficiency around 22 (Fig. 11). The efficiency seems to scale with following a power-law as shown in Fig. 11, suggesting that light penetration in the solid may be a key issue in determining the photoconversion time.
The decay time of the light-induced HS state, driven by phonon processes, was derived at three different temperatures and found to decrease with increasing temperature. In order to compare with previous results in the literature we considered just the data above 30 K and fit them with a thermally activated law Beni2006 ; Li2008
| (8) |
Even if characterized by a large uncertainty, one can roughly estimate an activation barrier K for T 30 K (data are reported in the Supplementary Material), which is consistent with the 390 K activation barrier previously reported Dapporto2008 . Some computational studies based on the Density Functional Theory have been carried out in Co-based valence tautomers Adams1997 ; Bencini2003 ; Sato2010 ; Starikov2011 similar to the one used in this work in order to estimate the barrier between the LS and HS states and a reasonable agreement with the experimental values was found.
The information on the temperature evolution of the VT spin state and on the HS lifetime derived by SQUID magnetometry can be suitably complemented by that derived from local probes, as nuclei and muons, which can provide information on the spin dynamics of HS molecules and on how it is affected by external stimuli. 1H NMR spin-lattice relaxation is nearly constant above 200 K as it is expected for weakly coupled spins in the high temperature limit slichter . The slight magnetic field dependence of observed at high temperatures (Fig.4), suggests the presence of low-frequency diffusive spin fluctuations, similar to those of low-dimensional paramagnets Carretta2004 ; FBranzoli2009 , or due to molecular motions. Below 200 K drops, due to the VT transition. At 100 K, when most VT molecules are diamagnetic, is reduced by 50 %, since the mean squared amplitude of the fluctuating local fields at the 1H nuclei is strongly diminished by the conversion.
At low temperatures (5 - 80 K) 1H displays a peak around 20 K, suggesting a slowing down of the spin fluctuations to frequencies approaching the nuclear Larmor frequency for that fraction of VT molecules which are still in the HS state at low temperature, those yielding the non-zero contribution to =0.24 emuK/mol. This behaviour is similar to that observed in molecular magnets, where a peak in is detected at temperatures of the order of the energy separation between the ground and the first excited states FBranzoli2009 ; Branzoli2009 ; Papinutto2005 (for a complete list see Ref. MRbook , pg 29-70, and references therein). The magnetic field dependence shown in Fig. 5 confirms this hypothesis, since the peak intensity decreases with the nuclear Larmor frequency(see also Eq. 9 in the following).
Thus, the fraction of VT in the HS state at a given temperature can be described as an ensemble of paramagnetic impurities embedded in a diamagnetic matrix, whose spin progressively slow down to frequencies approaching the tens of MHz range around 20 K. If one considers that the thermal population of the HS molecule states is given by with an effective barrier between the low-energy levels involved in the HS fluctuations and the corresponding partition function, one can weight the amplitude of the local field fluctuations driving the spin-lattice relaxation by . Then, by assuming a Lorentzian broadening of the HS state due to phonon scattering processes, one can write for the spin-lattice relaxation rate bppBPP1948 ; Corti1997 ; Carretta1993 :
| (9) |
We have considered a rectangular distribution for the activation energy with width . is the high temperature limit of the correlation time, is the mean squared amplitude of the local field fluctuations, the nuclear gyromagnetic ratio and the nuclear Larmor frequency. The fit yields an average barrier K and a smaller K (see Table 1), as one may deduce from the narrow peak reported in Fig.4. Notice that , significantly smaller than , is not a barrier separating the LS and HS states. As it can be noticed from Fig. 5 light irradiation slightly enhances the proton spin-lattice relaxation rate without affecting the temperature dependence close to the peak.
SR measurements, both in ZF and LF, show that muon relaxation rate is not much sensitive to the VT transition (Fig. 10), suggesting that around 160 K the spin dynamics are much faster than the muon lifetime (s). On the other hand, at low temperature, around 20 K, ZF and LF relaxation rates show a neat peak (Fig. 10) analogous to the one detected by 1H spin-lattice relaxation rate. A similar behavior of the muon spin relaxation rates has been also reported for spin crossover systems Blundell2004 as well as for other systems characterized by a spin freezing Campbell1994 ; Murnick1976 . In the LF measurements, where the nuclear dipolar contribution to the muon relaxation is suppressed, one observes a temperature dependence which is rather similar to that of . In fact, by fitting data with Eq. 9, one finds values for K and K, which are close to those derived from , confirming the hypothesis of the spin freezing of the HS molecules.
To get a deeper insight on the HS molecules spin dynamics we now turn to the discussion of 59Co spin-lattice relaxation rate which is a more sensitive to spin fluctuations, thanks to the hyperfine coupling with the paramagnetic ion. As pointed out in Sect. II.2, the signal being detected is the one from 59Co nuclei belonging to VT in the LS state. In fact, as it is shown in Fig. 8 the normalized signal intensity decreases above the LS-HS transition temperature and vanishes at high temperatures.
It is pointed out that at 180 K is much larger than (Fig. 7), which is unexpected since the relaxation rate should scale with the square of the gyromagnetic ratio (4.21 times larger for 1H) and the average hyperfine coupling is expected to be larger for 1H rather than for 59Co nuclei in the LS state, which on average are farther from the centre of the molecule. Hence, it is likely that the relaxation rate of 59Co nuclei in LS VT is enhanced through nuclear spin diffusion by the relaxation of 59Co nuclei in HS VT. In other terms, is probing a weighted average of the relaxation of the nuclei in LS and HS molecules but since the relaxation in the latter ones is much faster one is basically probing the relaxation of 59Co nuclei in LS molecules.
The spin transition driven by the electron transfer causes a marked reduction of 59Co nuclear spin-lattice relaxation rate, with a decrease of by more than two orders of magnitude between 180 and 50 K. At lower temperature, around 25 K, a small peak is observed (see Fig. 9). This peak is analogous to the one observed for . The points in the range (5 - 55 K) were fit using equation 9 (see Table 1) and a value for the barrier similar to that derived from 1H or muon spin relaxation was derived.
| 59Co OFF | ||||
| 59Co ON | ||||
| 59Co DIF. | ||||
| 1H OFF | ||||
| LF SR |
Infrared light irradiation enhances the at low temperature (Fig. 9) because of the increase in the number of molecules in the HS state, a much more marked effect than that obtained on protons. Moreover, under light irradiation value remains significantly lower than at K, pointing out that the conversion efficiency in the NMR experiments is lower than in SQUID magnetization measurements. This could be due to the limited penetration of the infrared radiation over the whole volume of the sample used in the NMR experiments. Eventhough, the enhancement of allows to probe the spin dynamics of those molecules which have been promoted to the HS state.
The low-temperature behaviour of upon irradiation can still be fit with Eq. 9 below 50 K with similar values for the activation energies (see Tab.1). In order to consider the spin dynamics due to the light-induced HS molecules only, we have subtracted the behaviour of before irradiation from the one in presence of irradiation. The resulting temperature dependence, shown in the inset of Fig. 9, was fit again with Eq. 9 and the best fit was achieved for K and K. Thus, it is noticed that there is a low-frequency (MHz range) dynamic which persists at low temperature with a barrier which is similar to that derived from 1H spin-lattice relaxation rate measurements. These values are significantly lower than the barrier estimated from the decay of the magnetization after light irradiation with the SQUID magnetometer. Indeed while this latter is the barrier needed to switch between the two VT states, the spin fluctuations probed by NMR and SR relaxations may involve transitions among states of the HS molecules characterized by a different energy separation. In view of future application these low-frequency fluctuations must be somewhat reduced or even removed by playing with the chemical structure of the molecule.
Finally we discuss the effect of an external pressure on the VT conversion. In Fig. 2 one observes that moderate pressures, of the order of a few kbar, shift the transition detected by measurements close to room temperature. The measurements performed at 300 K do support the magnetization results. As it is shown in Fig. 6, 1H spin-lattice relaxation rate decreases with increasing pressure, indicating a progressive transition of the VT from the HS to the LS state, ending at about 10 kbar, while for higher pressures does not change and the system remains in the LS state. In fact, the LS state is favoured by high pressures since it is characterized by a smaller volume giving rise to larger crystal field splittings with respect to the HS state Tezgerevska2014 ; Evangelio2005 ; Dei2010b . The observation of a pressure induced transition at room temperature is relevant for the application of VT as sensors.
IV Conclusion
By means of macroscopic magnetization and of nuclear and muon spin-lattice relaxation rate measurements we have investigated the magnetic properties of a cobalt compound showing Valence Tautomerism. In particular we have focused on the effect of infrared light irradiation at low temperatures and that of an external pressure on the interconversion between the two spin states associated with different intramolecular charge distribution. The SQUID magnetometry data result in good agreement with earlier reports and and point out two important facts: quite long build-up times (up to 9 hours) are needed to reach a conversion efficiency close to 100 % and the decay rate of light-induced magnetization is determined by an energy barrier which leads to many hours lifetimes for the HS state at low temperatures. On the other hand, by means of NMR and SR we have evidenced that spin fluctuations in the MHz range persist at low temperature. By increasing the number of HS molecules with infrared light irradiation the temperature evolution of the spin dynamics does not change significantly. Hence, although the light-induced HS state of VT can persist for hours at K, spin dynamics can be faster approaching timescale of seconds at temperatures around few Kelvin degrees. These results show that application of this material as a logic unit still needs further developments. On the other hand, we have shown that the VT transition can suitably be tuned by an external pressure and reaches room temperature at kbar, an observation which could pave the way to immediate application of valence tautomers as sensors. The marked increase in the crossover temperature with pressure suggests that the spin dynamics could also be significantly affected and possibly reduced by an external pressure.
Acknowledgements
Marco Moscardini is gratefully acknowledged for his technical assistance during the setup of the light irradiation experiments in the SQUID magnetometer. James Lord is gratefully acknowledged for his assistance during SR experiments carried out at the ISIS facility. Lorenzo Sorace is widely acknowledged for the fruitfull discussion during the revision of the manuscript.
References
- (1)
- (2) G. Poneti, M. Mannini, L. Sorace, P. Sainctavit, M. Arrio, E. Otero, C. Cezar, and A. Dei, Angew. Chem. Int. Ed. 49, 1954 (2010)
- (3) G. Poneti, L. Poggini, M. Mannini, B. Cortigiani, L. Sorace, E. Otero, P. Sainctavit, A. Magnani, R. Sessoli, and A. Dei, Chem. Sci. 6, 2268 (2015)
- (4) P. Dapporto, A. Dei, G. Poneti, and L. Sorace, Chem. Eur. J. 14, 10915 (2008)
- (5)
- (6) A. Dei, G. Poneti, and L. Sorace, Inorg. Chem. 49, 3271 (2010)
- (7) S. Blundell, F. Pratt, C. Steer, I. Marshall, and J. Letard, J. Phys. Chem. Sol. 65, 25 (2004)
- (8) I. Campbell, A. Amato, F. Gygax, D. Herlach, A. Schenck, R. Cywinski, and S. Kilcoyne, Phys. Rev. Lett. 72, 1291 (1994)
- (9) D. E. Murnick, A. T. Fiory, and W. J. Kossler, Phys. Rev. Lett. 36, 100 (1976)
- (10) T. Tezgerevska, K. Alley, and C. Boskovic, Coord. Chem. Rev. 268, 23 (2014)
- (11) A. Beni, A. Dei, D. Schultz, and L. Sorace, Chem. Phys. Lett. 428, 400 (2006)
- (12) B. Li, F. Yang, J. Tao, O. Sato, R. Huang, and L. Zheng, Chem. Commun. pp. 6019-6021 (2008)
- (13) R. Schmidt, D. Shultz, and J. Martin, Inorg. Chem. 49, 3162 (2010)
- (14) E. Evangelio and D. Molina, Eur. J. Inorg. Chem. 0, 2957 (2005)
- (15) H. Song, M. Reed, and T. Lee, Adv. Mat. 23, 1583 (2011)
- (16) L. Bogani and W. Wernsdorfer, Nat. Mat, 7, 179 (2008)
- (17) M. Mannini, F. Pineider, P. Sainctavit, C. Danieli, E. Otero, C. Sciancalepore, A. Talarico, A. Arrio, A. Cornia, D. Gatteschi, et al., Nat. Mat. 8, 194 (2009)
- (18) N. Weibel, S. Grunder, and M. Mayor, Org. Biomol. Chem. 5, 2343 (2007)
- (19) F. Neuwahl, R. Righini, and A. Dei, Chem. Phys. Let. 6, 408 (2002)
- (20) P. Gentili, L. Bussotti, R. Righini, A. Beni, L. Bogani, and A. Dei, Chem. Phys. 314, 9 (2005)
- (21) A. Beni, A. Dei, M. Rizzitano, and L. Sorace, Chem. Commun. pp. 2160–2162 (2007)
- (22) C. Slichter, Principles of Magnetic Resonance (Clarendon Press, Springer, Berlin, 1990)
- (23) P. Carretta, N. Papinutto, R. Melzi, P. Millet, S. Gonthier, P. Mendels, and P. Wzietek, J. Phys.: Condens. Matter 16, S849 (2004)
- (24) F. Branzoli, M. Filibian, P. Carretta, S. Klyatskaya, and M. Ruben, Phys. Rev. B 79, 220404 (2009)
- (25) F. Branzoli, P. Carretta, M. Filibian, G. Zoppellaro, M. Graf, J. Mascaros, O. Fuhr, S. Brink, and M. Ruben, J. Am. Chem. Soc. 131, 4387 (2009)
- (26) N. Papinutto, P. Carretta, S. Gonthier, and P. Millet, Phys. Rev. B 71, 174425 (2005)
- (27) N. Bloembergen, E. M. Purcell, and R. V. Pound, Phys. Rev. 73, 679 (1948)
- (28) M. Corti, S. Marini, A. Rigamonti, F. Tedoldi, D. Capsoni, and V. Massarotti, Phys. Rev. B 56, 11056 (1997)
- (29) P. Carretta, M. Corti, and A. Rigamonti, Phys. Rev. B 48, 3433 (1993)
- (30) S. Decurtins, P. Gütlich, K. Hasselbach, A. Hauser, and H. Spiering, Inorg. Chem. 24, 2174 (1985)
- (31) S. Decurtins, P. Gütlich, C. Köhler, H. Spiering, and A. Hauser, Chem. Phys. Lett. 105, 1 (1984)
- (32) P. Gütlich, V. Ksenofontov, and A. Gaspar, Coord. Chem. Rev. 249, 1811 (2005)
- (33) C. Pierpont, Coord. Chem. Rev. 216-217, 99 (2001)
- (34) P. Gütlich and A. Dei, Angew. Chem. Int. Ed. 36, 2734 (1997)
- (35) D. Adams, A. Dei, A. Rheingold, and D. Hendrickson, Angew. Chem. Int. Ed. 32, 880 (1993)
- (36) C. Roux, D. Adams, J. Itié, A. Polian, and D. Hendrickson, Inorg. Chem. 35, 2846 (1996)
- (37) A. Caneschi, A. Dei, F. Fabrizi de Biani, P. Gütlich, V. Ksenofontov, G. Levchenko, A. Hoefer, and F. Renz, Chem. Europ. J. 7, 3926 (2001)
- (38) O. Sato, S. Hayami, Z. Gu, K. Takahashi, R. Nakajima, K. Seki, and A. Fujishima, J. Photochem. Photobiol. A:Chem. 149, 111 (2002)
- (39) C. Carbonera, A. Dei, J. Létard, C. Sangregorio, and L. Sorace, Angew. Chem. Int. Ed. 43, 3136 (2004)
- (40) J. Tao, H. Maruyama, and O. Sato, J. Am. Chem. Soc. 128, 1790 (2006)
- (41) A. Caneschi, A. Cornia, and A. Dei, Inorg. Chem. 37, 3419 (1998)
- (42) A. Dei and L. Sorace, Appl. Mag. Reson. 38, 139 (2010)
- (43) D. Adams, B. Li, J. Simon, and D. Hendrickson, Angew. Chem. Int. Ed. 34, 1481 (1995)
- (44) O. Sato, A. Cui, R. Matsuda, J. Tao, and S. Hayami, Acc. Chem. Res. 40, 361 (2007)
- (45) A. Cui, K. Takahashi, A. Fujishima, and O. Sato, J. Photochem. Photobiol. A: Chem. 167, 69 (2004)
- (46) J. Dai, S. Kanegawa, Z. Li, S. Kang, and O. Sato, Eur. J. Inorg. Chem. 2013, 4150 (2013)
- (47) N. Vazquez-Mera, F. Novio, C. Roscini, C. Bellacanzone, M. Guardingo, J. Hernando, and D. Ruiz-Molina, J. Mater. Chem. C 4, 5879 (2016)
- (48) B. Li, J. Tao, H. Sun, O. Sato, R. Huang, and L. Zheng, Chem. Comm. 0, 2269 (2008)
- (49) P. Gütlich, A. Gaspar, V. Ksenofontov, and Y. Garcia, J. Phys.: Cond. Mat. 16, S1087 (2004)
- (50) T. Tayagaki, A. Galet, G. Molnár, M. Mũnoz, A. Zwick, K. Tanaka, J. Real, and A. Bousseksou, J. Phys. Chem. B 109, 14859 (2005)
- (51) A. Suter, M. Mali, J. Roos, and D. Brinkmann, J. Phys.: Condens. Matter 10, 5977 (1998)
- (52) R. White, J. Magn. Magn. Mater. 209, 1 (2000)
- (53) H. Richter, J. Magn. Magn. Mater. 321, 467 (2009)
- (54) A. Moser, K. Takano, D. Margulies, M. Albrecht, Y. Sonobe, Y. Ikeda, S. Sun, and E. Fullerton, J. Phys. D: Appl. Phys. 35, R157 (2002)
- (55) J. Andreásson and U. Pischel, Chem. Soc. Rev. 44, 1053 (2015)
- (56) U. Pischel, Aust. J. Chem. 63, 148 (2010)
- (57) A. Dvornikov, E. Walker, and P. Rentzepis, J. Phys. Chem. A 113, 13633 (2009)
- (58) B. Patterson, Rev. Mod. Phys. 60, 69 (1988)
- (59) A. Droghetti and S. Sanvito, Phys. Rev. Lett. 107, 047201 (2011)
- (60) A. Beni, A. Dei, S. Laschi, M. Rizzitano, and L. Sorace, Chem. Eur. J. 14, 1804 (2008)
- (61) D. Adams, L. Noodleman, and D. Hendrickson, Inorg. Chem. 36, 3966 (2011)
- (62) A. Starikov, R. Minyaev, A. Starikova, and V. Minkin, Doklady Chem. 440, 289 (2011)
- (63) D. Sato, Y. Shiota, G. Juhász, and K. Yoshizawa, J. Phys. Chem. 114, 12928 (2010)
- (64) A. Bencini, A. Caneschi, C. Carbonera, A. Dei, D. Gatteschi, R. Righini, C. Sangregorio, and J. Van Slagerov, J. Mol. Struct. 656, 141 (2003)
- (65) M. Halcrow, Spin Crossover Materials: Properties and Applications (Wiley and Sons, 2013)
- (66) P. Carretta and A. Lascialfari, NMR-MRI, SR and Mossbauer Spectroscopies in Molecular Magnets (Springer-Verlag Italia, 2007)