RNAmountAlign: efficient software for local, global, semiglobal pairwise and multiple RNA sequence/structure alignment
Abstract
Alignment of structural RNAs is an important problem with a wide range of applications. Since function is often determined by molecular structure, RNA alignment programs should take into account both sequence and base-pairing information for structural homology identification. A number of successful alignment programs are heuristic versions of Sankoff’s optimal algorithm. Most of them require run time. This paper describes C++ software, RNAmountAlign, for RNA sequence/structure alignment that runs in time and space; moreover, our software returns a -value (transformable to expect value ) based on Karlin-Altschul statistics for local alignment, as well as parameter fitting for local and global alignment.
Using incremental mountain height, a representation of structural information computable in cubic time, RNAmountAlign implements quadratic time pairwise local, global and global/semiglobal (query search) alignment using a weighted combination of sequence and structural similarity. RNAmountAlign is capable of performing progressive multiple alignment as well. Benchmarking of
RNAmountAlign against LocARNA, LARA, FOLDALIGN, DYNALIGN and STRAL shows that RNAmountAlign has reasonably good
accuracy and much faster run time supporting all alignment types.
Availability:
RNAmountAlign is publicly available at
http://bioinformatics.bc.edu/clotelab/RNAmountAlign.
1 Introduction
A number of different metrics exist for comparison of RNA secondary structures, including base pair distance (BP), string edit distance (SE) [22], mountain distance (MD) [26], tree edit distance (TE) [33], coarse tree edit distance (HTE) [23], morphological distance [44] and a few other metrics. In what appears to be the most comprehensive published comparison of various secondary structure metrics [1], it was shown that all of these distance measures are highly correlated when computing distances between structures taken from the Boltzmann low-energy ensemble of secondary structures [6] for the same RNA sequence – so-called intra-ensemble correlation. In contrast, these distance measures have low correlation when computing distances between structures taken from Boltzmann ensembles of different RNA sequences of the same length – so-called inter-ensemble correlation. For instance, the intra-ensemble correlation between base pair distance (BP) and mountain distance (MD) is , while the corresponding inter-ensemble correlation drops to . Intra-ensemble correlation between string edit distance (SE) and the computationally more expensive tree edit distance (TE) is , while the corresponding intra-ensemble correlation drops to – see Table 1.
| BP | MD | SE | TE | HTE | |
|---|---|---|---|---|---|
| BP | 0.210 | 0.134 | 0.133 | 0.230 | |
| MD | 0.822 | 0.519 | 0.607 | 0.515 | |
| SE | 0.960 | 0.853 | 0.590 | 0.310 | |
| TE | 0.943 | 0.879 | 0.975 | 0.597 | |
| HTE | 0.852 | 0.844 | 0.879 | 0.913 |
Due to poor inter-ensemble correlation of RNA secondary structure metrics, and the fact that most secondary structure pairwise alignment algorithms depend essentially on some form of base pair distance, string edit distance, or free energy of common secondary structure, we have developed the first RNA sequence/structure pairwise alignment algorithm that is based on (incremental ensemble) mountain distance. Our software, RNAmountAlign, uses this distance measure, since the Boltzmann ensemble of all secondary structures of a given RNA of length can represented as a length vector of real numbers, thus allowing an adaptation of fast sequence alignment methods. Depending on the command-line flag given, our software, RNAmountAlign can perform pairwise alignment, (Needleman-Wunsch global [29], Smith-Waterman local [37] or semiglobal [11] alignment) as well as progressive multiple alignment (global and local), computed using a guide tree as in CLUSTAL [41]. Expect values for local alignments are computed using Karlin-Altschul extreme-value statistics [19, 20], suitably modified to account for our new sequence/structure similarity measure. Additionally, RNAmountAlign can determine -values (hence -values) by parameter fitting for the normal (ND), extreme value (EVD) and gamma (GD) distributions.
We benchmark the performance of RNAmountAlign on pairwise and multiple global sequence/structure alignment of RNAs against the widely used programs LARA, FOLDALIGN, DYNALIGN, LocARNA and STRAL. LARA (Lagrangian relaxed structural alignment) [2] formulates the problem of RNA (multiple) sequence/structure alignment as a problem in integer linear programming (ILP), then computes optimal or near-optimal solutions to this problem. The software FOLDALIGN [13, 12, 38], and DYNALIGN [25] are different approximate implementations of Sankoff’s optimal RNA sequence/structure alignment algorithm. FOLDALIGN sets limits on the maximum length of the alignment as well as the maximum distance between subsequences being aligned in order to reduce the time complexity of the Sankoff algorithm. DYNALIGN [25] implements pairwise RNA secondary structural alignment by determining the common structure to both sequences that has lowest free energy, using a positive (destabilizing) energy heuristic for gaps introduced, in addition to setting bounds on the distance between subsequences being aligned. In particular, the only contribution from nucleotide information in Dynalign is from the nucleotide-dependent free energy parameters for base stacking, dangles, etc. LocARNA (local alignment of RNA) [45, 34] is a heuristic implementation of PMcomp [15] which compares the base pairing probability matrices computed by McCaskill’s algorithm. Although the software is not maintained, STRAL [5] which is similar to our approach, uses up- and downstream base pairing probabilities as the structural information and combines them with sequence similarity in a weighted fashion.
LARA, mLocARNA (extension of LocARNA), FOLDALIGNM [42, 12] (extension of FOLDALIGN), Multilign [46, 47] (extension of DYNALIGN) and STRAL support multiple alignment. LARA computes all pairwise sequence alignments and subsequently uses the T-Coffee package [30] to construct multiple alignments. Both FOLDALIGNM and mLocARNA implement progressive alignment of consensus base pairing probability matrices using a guide tree similar to the approach of PMmulti [15]. For a set of given sequences, Multilign uses DYNALIGN to compute the pairwise alignment of a single fixed index sequence to each other sequence in the set, and computes a consensus structure. In each pairwise alignment, only the index sequence base pairs found in previous computations are used. More iterations in the same manner with the same index sequence are then used to improve the structure prediction of other sequences. The number of pairwise alignments in Multilign is linear with respect to the number of sequences. STRAL performs multiple alignment in a fashion similar to CLASTALW [40]. Table 2 provides an overview of various features, to the best of our knowledge, supported by the software benchmarked in this paper.
| Software | Local | Global | Semiglobal | E-value | F1(Pairwise) | SPS(Multiple) |
|---|---|---|---|---|---|---|
| RNAmountAlign | 0.84 | 0.84 | ||||
| LocARNA | — | — | 0.81 | 0.84 | ||
| LARA | — | — | — | 0.84 | 0.85 | |
| FOLDALIGN | — | 0.80 | 0.77 | |||
| DYNALIGN | — | — | — | 0.68 | 0.67 | |
| STRAL | — | — | — | 0.82 | - |
RNAmountAlign can perform semiglobal alignments in addition to global and local alignments. As in the RNA tertiary structural alignment software DIAL
[7], semiglobal alignment allows the user to perform a query
search, where the query is entirely matched to a local portion of the target.
Quadratic time alignment using affine gap cost is implemented in
RNAmountAlign using the Gotoh method [10] with
the following pseudocode, shown for the case of semiglobal alignment.
Let denote an affine cost for size gap, defined by and
for positive gap initiation [resp. extension]
costs [resp. ].
For query and target ,
define matrices as follows:
for all ,
for all , while for positive we have
sim , , .
For , , let
and
,
and define
and
.
Determine the maximum semiglobal alignment score in row , then
perform backtracking to obtain an optimal semiglobal (or query search)
alignment.
In this paper we provide a very fast, comprehensive software package capable of pairwise/multiple local/global/semiglobal alignment with -values and -values for statistical significance. Moreover, due to its speed and relatively good accuracy, the software can be used for whole-genome searches for homologues of a given orphan RNA as query. This is in contrast to Infernal [28], which requires a multiple alignment to construct a covariance model for whole-genome searches.
2 Materials and methods
2.0.1 Incremental ensemble expected mountain height
Introduced in [16], the mountain height111We follow [16, 26] in our definition of mountain height, and related notions of ensemble mountain height and distance, while [17] and Vienna RNA package [23] differ in an inessential manner by defining . of secondary structure at position is defined as the number of base pairs in that lie between an external loop and , formally given by
| (1) |
The ensemble mountain height [17] for RNA sequence at position is defined as the average mountain height, where the average is taken over the Boltzmann ensemble of all low-energy structures of sequence . If base pairing probabilities have been computed, then it follows that
| (2) |
and hence the incremental ensemble mountain height, which for values is defined by can be readily computed by
| (5) |
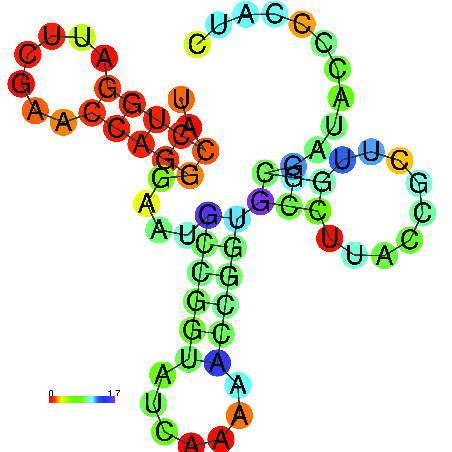
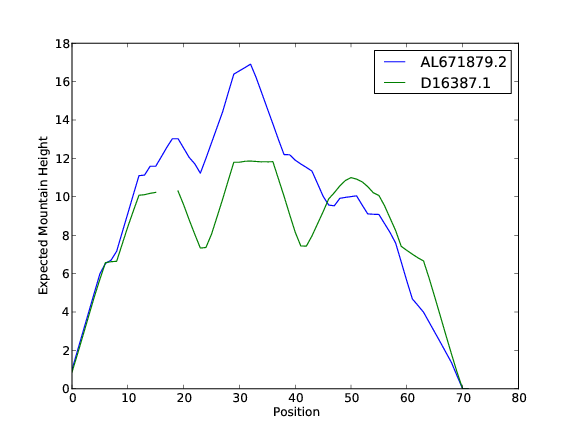
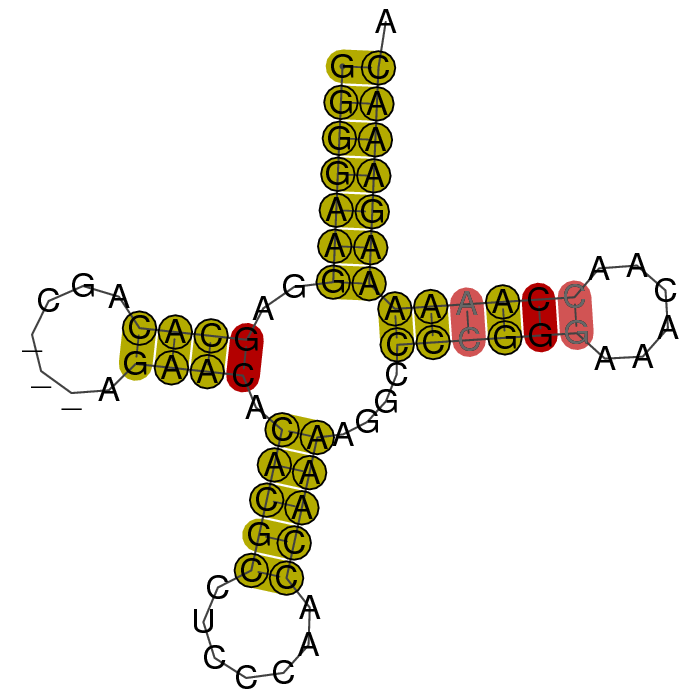
It is clear that , and that both ensemble mountain height and incremental ensemble mountain height can be computed in time that is quadratic in sequence length , provided that base pairing probabilities have been computed. Except for the cubic time taken by a function call of RNAfold from Vienna RNA package [23], the software RNAmountAlign has quadratic time and space requirements. Figure 1 depicts a global alignment of two transfer RNAs, computed by RNAmountAlign, shown as superimposed ensemble mountain height displays with gaps.
2.0.2 Transforming distance into similarity
In [36], Seller’s (distance-based) global pairwise alignment algorithm [32] was rigorously shown to be equivalent to Needleman and Wunsch’s (similarity-based) global pairwise alignment algorithm [29]. Recalling that Seller’s alignment distance is defined as the minimum, taken over all alignments of the sum of distances between aligned nucleotides plus the sum of (positive) weights for size gaps, while Needleman-Wunsch alignment similarity is defined as the maximum, taken over all alignments of the sum of similarities between aligned nucleotides plus the sum of (negative) gap weights for size gaps, Smith and Waterman [36] show that by defining
| (6) | |||||
| (7) |
and by taking the minimum distance, rather than maximum similarity, the Needleman-Wunsch algorithm is transformed into Seller’s algorithm. Though formulated here for RNA nucleotides, equivalence holds over arbitrary alphabets and similarity measures (e.g. BLOSUM62).
For from Eq (5) we have
| (11) |
Define the distance between characters in the dot-bracket representation of a secondary structure by
| (15) |
Let denote an alignment between two arbitrary secondary structures of (possibly different) lengths , where and denotes the gap symbol. We define the structural alignment distance for by summing over those positions where neither character is a gap symbol, then adding for all size gaps in . Using previous definitions of incremental ensemble expected mountain height from Eq (5), we can generalize structural alignment distance from the simple case of comparing two dot-bracket representations of secondary structures to the more representative case of comparing the low-energy Boltzmann ensemble of secondary structures for RNA sequence to that of RNA sequence . Given sequences and , let denote an alignment between the incremental ensemble expected mountain height of and and the ensemble incremental expected mountain height of . Generalize structural distance defined in Eq (15) to defined by , where and are real numbers in the interval , and define ensemble structural alignment distance for by summing over all positions for which neither character is a gap symbol, then adding positive weight for all size gaps. By Eq (6) and Eq (7), it follows that an equivalent ensemble structural similarity measure between two positions , denoted , is obtained by multiplying and by :
| (16) |
This equation will be used later, since our algorithm RNAmountAlign combines both sequence and ensemble structural similarity. Indeed, with maximum value of 0 while RIBOSUM85-60, shown in Table 3, has similarity values in the interval . In order to combine sequence with structural similarity, both ranges should be rendered comparable as shown in the next section.
2.0.3 Pairwise alignment
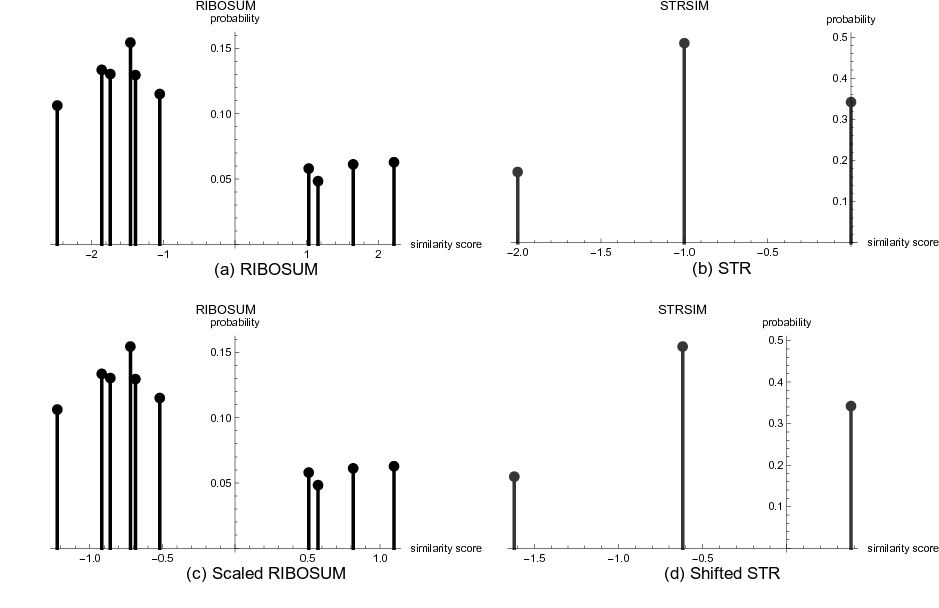
In order to combine sequence and ensemble structural similarity, we determine a multiplicative scaling factor and an additive shift factor such that the mean and standard deviation for the distribution of sequence similarity values from a RIBOSUM matrix [21] (after being multiplied by ) are equal to the mean and standard deviation for the distribution of structural similarity values from STRSIM (after additive shift of ). The RIBOSUM85-60 nucleotide similarity matrix used in this paper is given in Table 3, and the distributions for RIBOSUM and STRSIM values are shown in Figure 2 for the 72 nt transfer RNA AL671879.2. Given query [resp. target] nucleotide frequencies [] that sum to , the mean and standard deviation of RIBOSUM nucleotide similarities can be computed by
| (17) | |||||
| (18) |
Setting , where is defined in Eq (15), for given query [resp. target] base pairing probabilities [resp. ] of dot-bracket characters, it follows that the mean and standard deviation of structural similarities can be computed by
| (19) | |||||
| (20) |
Now we compute a multiplicative factor and an additive shift term , both dependent on frequencies and , such that the mean [resp. standard deviation] of nucleotide similarity multiplied by is equal to the mean [resp. standard deviation] of structural similarity after addition of shift term :
| (21) | |||||
| (22) |
| A | C | G | U | |
|---|---|---|---|---|
| A | +2.22 | -1.86 | -1.46 | -1.39 |
| C | -1.86 | +1.16 | -2.48 | -1.05 |
| G | -1.46 | -2.48 | +1.03 | -1.74 |
| U | -1.39 | -1.05 | -1.74 | +1.65 |
Given the query RNA and target RNA with incremental ensemble expected mountain heights of , of , and user-defined weight , our final similarity measure is defined by
where are computed by Eqs (21,22) depending on probabilities [resp. ] and [resp. ] of the query [resp. target]. All benchmarking computations were carried out using , although it is possible to use position-specific weight defined as the average probability that is paired in and is paired in .
Our structural similarity measure is closely related to that of STRAL, which we discovered only after completing a preliminary version of this paper. Let and be the probability that position of sequence a is paired to a position on the left or right, respectively. The similarity measure used in STRAL is defined by
| (24) |
From Eq (2.0.3) and Eq (5) our measure can be defined as
| (25) | |||||
Though RNAmountAlign was developed independently much later than STRAL, our software offers functionalities unavailable in STRAL, which latter appears to be no longer maintained.222Since we were unable to compile STRAL, our benchmarking results for STRAL use an adaptation of our code to support Eq (2.0.3). There are nevertheless some differences in how progressive alignment is implemented in STRAL that could affect run time. For instance, RNAmountAlign supports local and semiglobal alignment, and reports -values and E-values; these features are not available in STRAL.
To illustrate the method, suppose that the query [resp. target] sequence is the 72 nt tRNA AL671879.2 [resp. 69 nt tRNA D16498.1]. Then nucleotide query [resp. target] probabilities are (approximately) , , , , [resp. , , , ]. From the base pairing probabilities returned by RNAfold -p [23], we determine that , , [resp. , , ]. Using these probabilities in Eqs (17–20), we determine that , , and , . By Eq (21) and Eq (22), we determine that RIBOSUM scaling factor and . It follows that the mean and standard deviation of -scaled RIBOSUM values are identical with that of -shifted STRSIM values, hence can be combined in Eq (2.0.3). Since sequence identity of the BRAliBase 2.1 alignment of these tRNAs is only 28%, we set structural similarity weight in Eq (2.0.3), and obtained a (perfect) global alignment computed by RNAmountAlign. Figure 2 depicts the distribution of RIBOSUM85-60 [resp. STRSIM] values in this case, both before and after application of scaling factor [resp. shift ] – recall that and ] depend on of tRNA AL671879.2 and of tRNA D16498.1.
2.0.4 Statistics for pairwise alignment
Karlin-Altschul statistics for local pairwise alignment. For a finite alphabet and similarity measure , suppose that the expected similarity is negative and that is positive for at least one choice of . In the case of BLAST, amino acid and nucleotide similarity scores are integers, for which the Karlin-Altschul algorithm was developed [19]. In contrast, RNAmountAlign similarity scores scores are not integers (or more generally values in a lattice), because Eq (2.0.3) combines real-valued -scaled RIBOSUM nucleotide similarities with real-valued -shifted STRSIM structural similarities, which depend on query [resp. target] probabilities [resp. ]. For that reason, we use the following reformulation of a result by Karlin, Dembo and Kawabata [20], the similarity score for RNA nucleotides is defined by Eq (2.0.3).
Theorem 1 (Theorem 1 of [20])
Given similarity measure between nucleotides in alphabet , let be the unique positive root of , and let random variable denote the score of a length gapless alignment. For large ,
where denotes high maximal segment scores for local alignment of random RNA sequences and , and where
Fitting data to probability distributions. Data were fit to the normal distribution (ND) by the method of moments (i.e. mean and standard deviation were taken from data analysis). Data were fit to the extreme value distribution (EVD)
| (26) |
by an in-house implementation of maximum likelihood to determine , as described in supplementary information to [21]. Data were fit to the gamma distribution by using the function fitdistr(x,’gamma’) from the package MASS in the R programming language, which determines rate and shape parameters for the density function
| (27) |
with where is the shape parameter, the rate is , where is known as the scale parameter.
2.0.5 Multiple alignment
Suppose are the nucleotide probabilities obtained after the concatenation of all sequences. Let be computed by individually folding each sequence and taking the arithmetic average of probabilities of ( , and ) over all sequences. The mean and standard deviation of sequence and structure similarity are computed similar to Eqs (17-20).
| (28) | |||||
| (29) |
| (30) | |||||
| (31) |
Sequence multiplicative scaling factor and the structure additive shift factor are computed from these values using Eqs (21,22).
RNAmountAlign implements progressive multiple alignment using UPGMA to construct the guide tree. In UPGMA, one first defines a similarity matrix , where is equal to (maximum) pairwise sequence similarity of sequences and . A rooted tree is then constructed by progressively creating a parent node of the two closest siblings. Parent nodes are profiles (PSSMs) that represent alignments of two or more sequences, hence can be treated as pseudo-sequences in a straightforward adaptation of pairwise alignment to the alignment of profiles. Let’s consider an alignment of sequences composed of columns. Let denote column of the alignment (for ). Suppose , for , indicates the probability of occurrence of a nucleotide or gap at column of alignment . Then sequence similarity SEQSIM between two columns is defined by
| (32) |
where
| (35) |
The structural measure for a profile is computed from the incremental ensemble heights averaged over each column. Let denote the arithmetic average of incremental ensemble mountain height at column
| (36) |
where is the incremental ensemble mountain height at position of sequence obtained from Eq (5). Here, let if is a gap. Structural similarity between two columns is defined by
| (37) |
Finally, the combined sequence/structure similarity is computed from
2.1 Benchmarking
2.1.1 Accuracy measures
Sensitivity, positive predictive value, and F1-measure for pairwise alignments were computed as follows. Let denotes an alignment, where , and the aligned sequences include may contain gap symbols — provided that it is not the case that both and are gaps. The number TP of true positives [resp. FP of false positives] is the number of alignment pairs in the predicted alignment that belong to [resp. do not belong to] the reference alignment. The sensitivity () [resp. positive predictive value ()] of a predicted alignment is TP divided by reference alignment length [resp. TP divided by predicted alignment length]. The -score is the harmonic mean of sensitivity and PPV, so . For the computation of ,, and , pairs of the form and are also counted. In the case of local alignment, since the size of the reference alignment is unknown, only the predicted alignment length and PPV are reported. To compute the accuracy of multiple alignment, we used sum-of-pair-scores (SPS) [41], defined as follows. Suppose that denotes a multiple alignment of the form . For , define if is aligned with in both the reference and predicted alignments, and otherwise. Sum-of-pairs score SPS is then the sum, taken over all , of the . Though SPS can be considered as the average sensitivity, taken over all sequence pairs in the alignment, this is not technically the case, since our definition of sensitivity also counts pairs of the form and from the reference alignment.
To measure the conservation of secondary structures in alignments, structural conservation index (SCI) was computed using RNAalifold [3]. RNAalifold computes SCI as the ratio of the free energy of the alignment, computed by RNAalifold, with the average minimum free energy of individual structures in the alignment. SCI values close to [resp. ] indicate high [resp. low] structural conservation. All computations made with Vienna RNA Package used version 2.1.7 [23] using default Turner 2004 energy parameters [43]).
2.1.2 Dataset for global and local alignment comparison
For pairwise global alignment benchmarking in Table 4 and Figures 3, 4, S2 and S3 all 8976 pairwise alignments in k2 from BRAliBase 2.1 database [9] were used. For multiple global alignment benchmarking in Fig 7, k5 BRAliBase 3 was used [8]. This dataset includes 583 reference alignments, each composed of 5 sequences. For pairwise local alignment benchmarking, 75 pairwise alignments having sequence identity were randomly selected from each of 20 well-known families from the Rfam 12.0 database [27], many of which were considered in a previous study [4], yielding a total of 1500 alignments. Following [39], these alignments were trimmed on the left and right, so that both first and last aligned pairs of the alignment do not contain a gap symbol. For sequences [resp. ] from each alignment, random sequences [resp. ] were generated with the same nucleotide frequencies, then a random position was chosen in [resp. ] in which to insert [resp. ], thus resulting in a pair of sequences of lengths and . Finally, since sequence identity was at most 70%, the RIBOSUM70-25 similarity matrix was used in RNAmountAlign. Preparation of the benchmarking dataset for local alignment was analogous to the method used in multiple local alignment of [39]. We used LocARNA (version 1.8.7), FOLDALIGN (version 2.5), LARA (version 1.3.2) DYNALIGN (from version 5.7 of RNAstructure), and STRAL (in-house implementation due to unavailability) for benchmarking.
2.1.3 Dataset for correlation of -values for different distribution fits
A pool of 2220 sequences from the Rfam 12.0 database [27] was created as follows. One sequence was selected from each Rfam family having average sequence length at most nt, with the property that the base pair distance between its minimum free energy (MFE) structure and the Rfam consensus structure was a minimum. Subsequently, for each of 500 randomly selected query sequences from the pool of 2220 sequences, 1000 random target sequences of length 400 nt were generated to have the same expected nucleotide frequency as that of the query. For each query and random target, five semiglobal (query search) alignments were created using gap initiation costs of with gap extension cost equal to one-third the gap initiation cost. For each alignment score for query and random target, the -value was computed as for ND, EVD and GD, where is the cumulative density function evaluated at . Additionally, a heuristic -value was determined by calculating the proportion of alignment scores for given query that exceed .
3 Results
We benchmarked RNAmountAlign’s performance for pairwise and multiple alignments on BraliBase k2 and k5 datasets, respectively.
3.1 Pairwise alignment
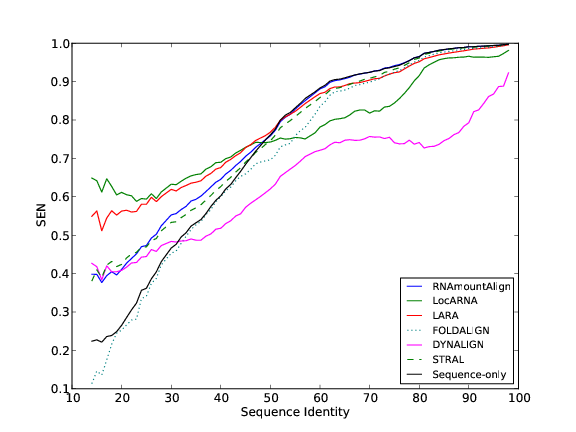
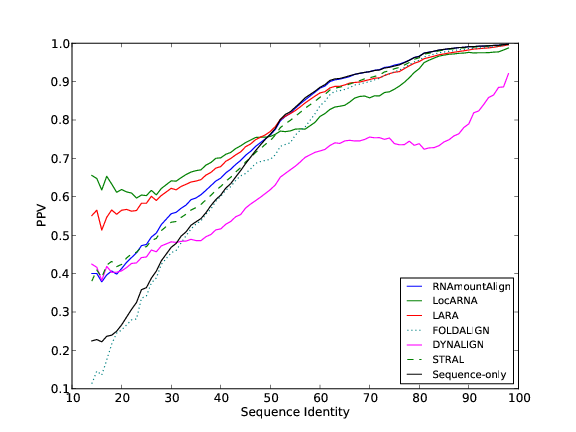
Figures 3, S2 and S3 depict running averages of pairwise global alignment F1-measure, sensitivity, and positive predictive value (PPV) for the software described in this paper, as well as for LocARNA, FOLDALIGN, LARA, DYNALIGN, and STRAL. For pairwise benchmarking, reference alignments of size 2, a.k.a. K2, were taken from the BRAliBase 2.1 database [9]. BRAliBase 2.1 K2 data are based on seed alignments of the Rfam 7.0 database, and consist of 8976 alignments of RNA sequences from 36 Rfam families.
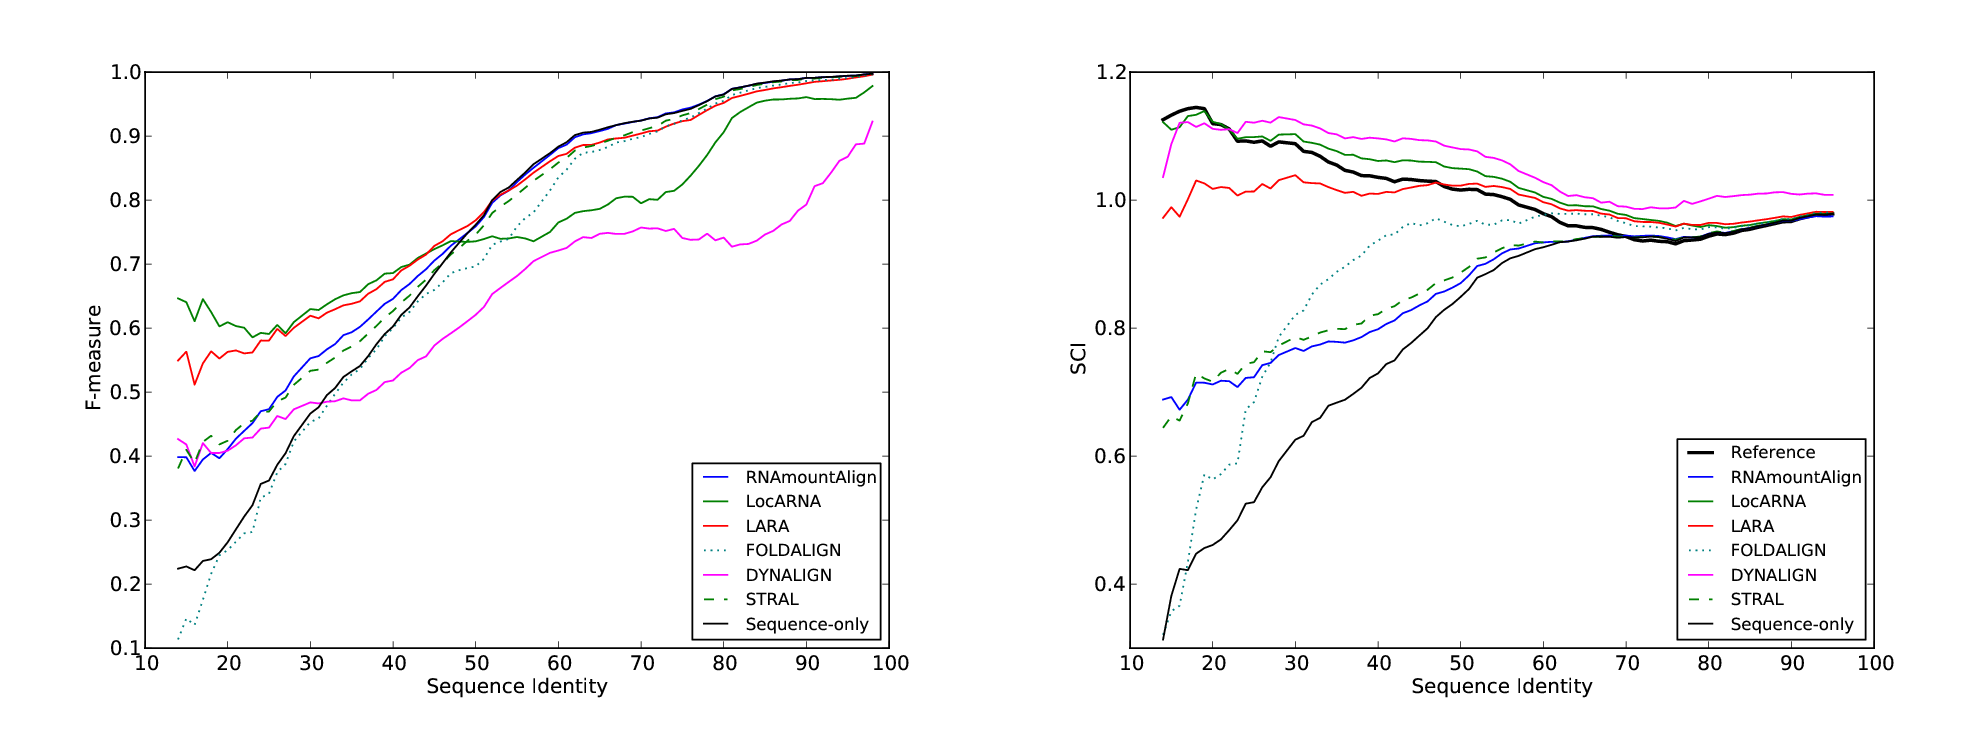
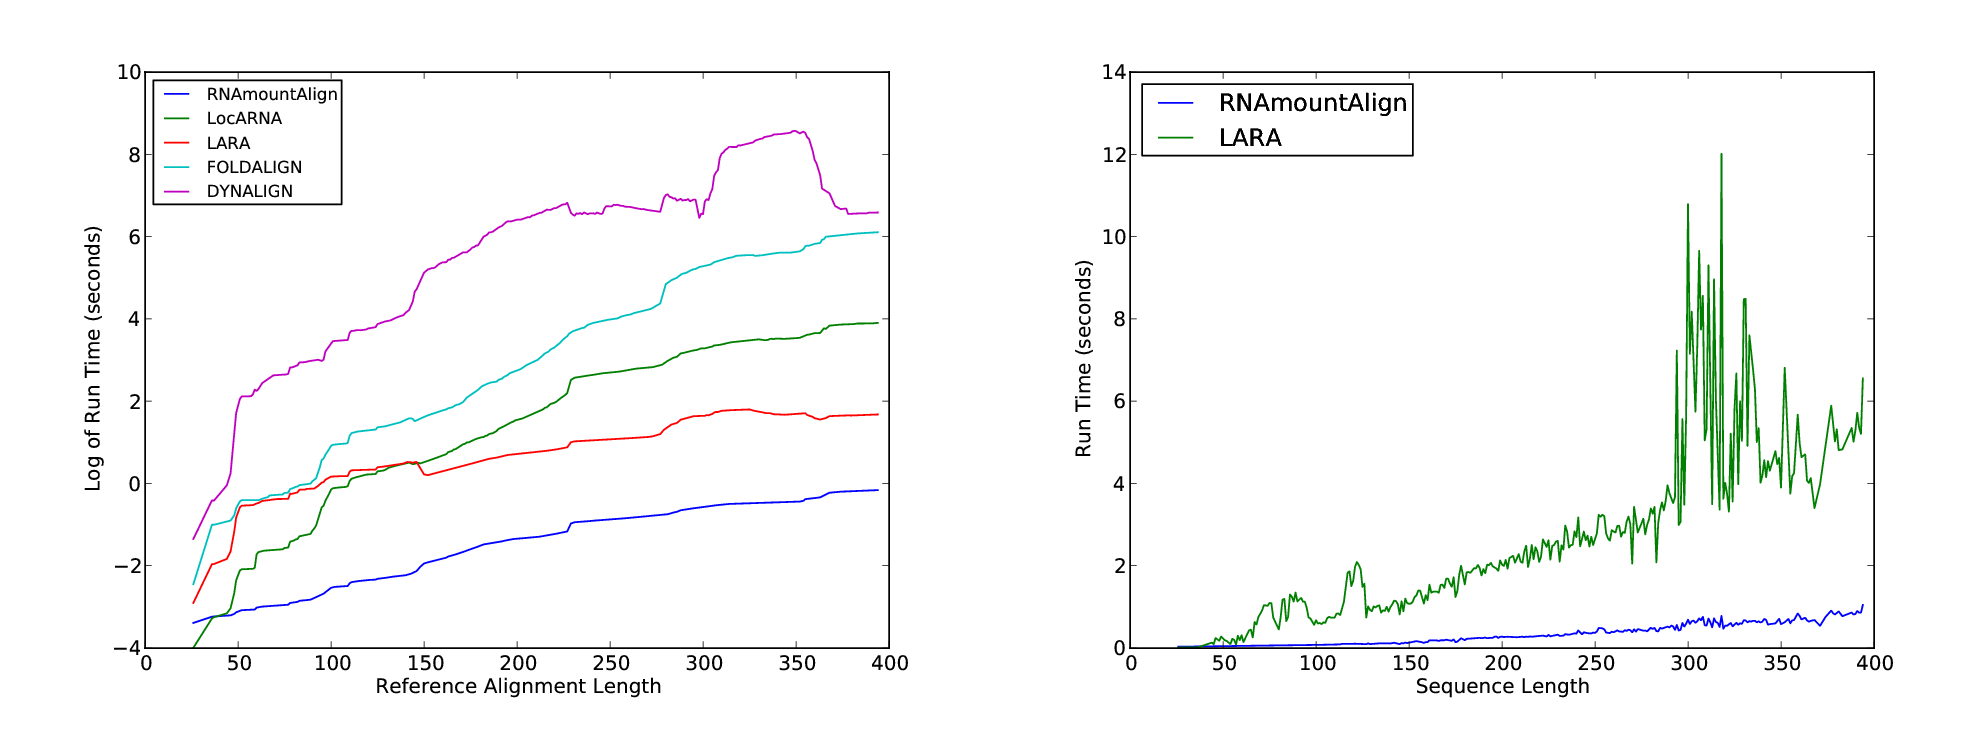
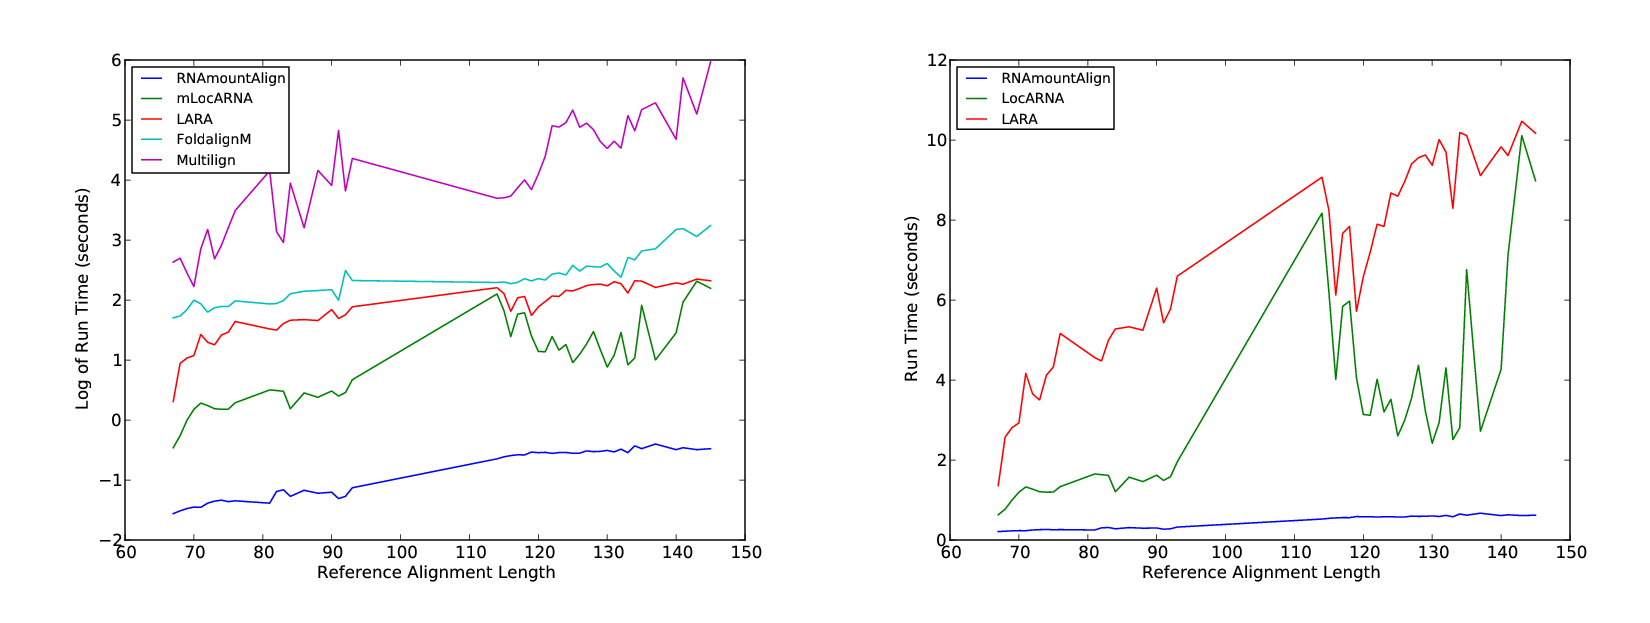
Running averages of sensitivity, positive predictive value, and F1-measure, averaging over windows of size 11 nt (interval ), were computed as a function of sequence identity, where it should be noted that the number of pairwise alignments for different values of sequence identity can vary for the BRAliBase 2.1 data (e.g. there are only 35 pairwise alignments having sequence identity ). Default parameters were used for all other software. For our software RNAmountAlign, gap initiation cost was -3, gap extension -1, and sequence/structure weighting parameter was (value obtained by optimizing on a small set of 300 random alignments from Rfam 12.0, not considered in training or testing set). The sequence-only alignment is computed from RNAmountAlign with the same gap penalties, but for . While its accuracy is high, RNAmountAlign is faster by an order of magnitude than LocARNA, LARA, FOLDALIGN, and DYNALIGN – indeed, algorithmic time complexity of our method is compared with for these methods. Since STRAL could not be compiled on any of our systems, we implemented its algorithm by modifying RNAmountAlign and obtained results for STRAL’s default parameter settings. Therefore, the run time of STRAL is identical to RNAmountAlign but we achieve slightly higher F1-measure, sensitivity and PPV. Moreover, RNAmountAlign supports semiglobal and local alignments as well as reporting -values. The right panel of Fig 4 depicts actual run times of the fastest software, RNAmountAlign, with the next fastest software, LARA. Unlike the graph in the left panel, actual run times are shown, graphed as a function of sequence length, rather than logarithms of moving averages.
In addition, Table 4 displays average pairwise global alignment F1 scores for RNAmountAlign, LocARNA, LARA, FOLDALIGN, DYNALIGN, and STRAL when benchmarked on 36 families from the BRaliBase K2 database comprising altogether 8976 RNA sequences with average length of . Averaging over all sequences, the F1 scores for the programs just mentioned were respectively , , , , , ; i.e. F1 score of LARA slightly exceeded the F1 score of RNAmountAlign and of STRAL, while other methods trailed by several percentage points. Supplementary Information (SI) Tables S1 and S2 display values for global alignment sensitivity and positive predictive value, benchmarked on the same data for the same programs – these results are similar to the F1-scores in Tables 2 and 4.
Although there appears to be no universally accepted criterion for quality of local alignments, Table 5 shows pairwise local alignment comparisons for the above-mentioned methods supporting local alignment: RNAmountAlign, FOLDALIGN, and LocARNA. We had intended to include SCARNA_LM [39] in the benchmarking of multiple local alignment software; however, SCARNA_LM no longer appears to be maintained, since the web server is no longer functional and no response came from our request for the source code. Since the reference alignments for the local benchmarking dataset are not known, and sensitivity depends upon the length of the reference alignment, we only report local alignment length and positive predictive value. Abbreviating RNAmountAlign by MA, FOLDALIGN by FA, and LocARNA by LOC, Table 5 shows average run time in seconds of MA (), FA (), LOC (), average alignment length of reference alignments (), MA (), FA (), LOC (), and average PPV scores MA (), FA (), LOC ().
| Type | NumAln | SeqId | MA(F) | LocARNA(F) | LARA(F) | FA(F) | DA(F) | STRAL(F) |
|---|---|---|---|---|---|---|---|---|
| 5.8S rRNA | ||||||||
| 5S rRNA | ||||||||
| Cobalamin | ||||||||
| Entero 5 CRE | ||||||||
| Entero CRE | ||||||||
| Entero OriR | ||||||||
| gcvT | ||||||||
| Hammerhead 1 | ||||||||
| Hammerhead 3 | ||||||||
| HCV SLIV | ||||||||
| HCV SLVII | ||||||||
| HepC CRE | ||||||||
| Histone3 | ||||||||
| HIV FE | ||||||||
| HIV GSL3 | ||||||||
| HIV PBS | ||||||||
| Intron gpII | ||||||||
| IRES HCV | ||||||||
| IRES Picorna | ||||||||
| K chan RES | ||||||||
| Lysine | ||||||||
| Retroviral psi | ||||||||
| S box | ||||||||
| SECIS | ||||||||
| sno 14q I II | ||||||||
| SRP bact | ||||||||
| SRP euk arch | ||||||||
| T-box | ||||||||
| TAR | ||||||||
| THI | ||||||||
| tRNA | ||||||||
| U1 | ||||||||
| U2 | ||||||||
| U6 | ||||||||
| UnaL2 | ||||||||
| yybP-ykoY | ||||||||
| Pooled Average |
| TYPE | SEED(LENGTH) | MA(LENGTH) | MA(PPV) | MA(TIME) | FA(LENGTH) | FA(PPV) | FA(TIME) | LOC(LENGTH) | LOC(PPV) | LOC(TIME) |
|---|---|---|---|---|---|---|---|---|---|---|
| 5 8S rRNA | 158.487.40 | 71.2041.55 | 0.800.32 | 3.700.43 | 168.3389.23 | 0.750.25 | 509.56411.83 | 767.6743.35 | 0.010.03 | 9571.396152.56 |
| 5S rRNA | 120.872.09 | 34.7925.44 | 0.450.46 | 1.900.13 | 133.8184.46 | 0.650.34 | 331.86488.57 | 584.0023.69 | 0.020.04 | 3093.171934.60 |
| Cobalamin | 221.0313.67 | 28.6016.77 | 0.570.44 | 7.671.14 | 451.73256.29 | 0.220.28 | 6830.159052.56 | 1028.2059.27 | 0.020.02 | 25712.4015252.51 |
| Hammerhead 3 | 64.2411.08 | 31.8820.40 | 0.380.42 | 0.380.11 | 36.9131.83 | 0.300.41 | 23.9511.81 | 279.0538.70 | 0.040.06 | 159.87123.44 |
| let-7 | 85.733.11 | 55.3728.14 | 0.750.22 | 0.890.10 | 72.9527.35 | 0.480.33 | 65.5128.66 | 390.7621.37 | 0.040.05 | 462.12283.01 |
| Lysin | 193.9113.07 | 68.7142.73 | 0.300.33 | 6.270.80 | 163.76104.21 | 0.570.30 | 554.25730.12 | 918.4148.19 | 0.030.04 | 18690.2610232.32 |
| mir-10 | 75.711.27 | 55.0921.97 | 0.670.24 | 0.720.04 | 66.9130.83 | 0.480.36 | 45.6819.80 | 358.5515.96 | 0.030.04 | 333.63227.10 |
| Purine | 102.010.93 | 129.0586.84 | 0.410.39 | 1.370.07 | 69.806.70 | 0.880.15 | 87.2730.47 | 497.4116.81 | 0.030.05 | 2395.401571.67 |
| RFN element | 147.2313.62 | 44.1124.91 | 0.940.11 | 2.830.56 | 114.5998.77 | 0.800.24 | 619.681289.50 | 687.7162.46 | 0.030.05 | 5893.833827.59 |
| S-box leader | 120.1316.14 | 50.3530.00 | 0.570.36 | 1.680.44 | 88.7260.79 | 0.790.21 | 190.03493.08 | 554.0955.21 | 0.030.04 | 2399.581484.64 |
| SECIS | 68.552.88 | 25.7621.34 | 0.050.19 | 0.530.05 | 54.2553.42 | 0.160.28 | 51.0765.81 | 318.5316.40 | 0.020.03 | 279.38187.58 |
| SNORD113 | 79.696.10 | 40.0323.27 | 0.330.42 | 0.750.07 | 47.6330.40 | 0.620.40 | 44.3218.12 | 373.6921.77 | 0.020.02 | 641.43421.62 |
| SRP bact | 96.209.99 | 30.8114.92 | 0.690.41 | 0.990.30 | 105.0882.04 | 0.660.32 | 225.15336.93 | 423.5574.67 | 0.020.04 | 726.66659.87 |
| THI element | 117.2011.95 | 33.0314.43 | 0.510.45 | 1.620.30 | 84.4585.58 | 0.750.31 | 253.89352.01 | 535.4043.83 | 0.020.02 | 2319.391468.99 |
| tRNA | 76.055.79 | 37.3145.09 | 0.230.40 | 0.700.09 | 62.1538.30 | 0.670.40 | 73.4578.89 | 360.2924.06 | 0.020.04 | 479.15265.22 |
| Tymo tRNA-like | 86.251.35 | 41.2721.96 | 0.500.39 | 0.790.05 | 78.9733.70 | 0.760.21 | 84.7055.19 | 409.1314.22 | 0.040.05 | 684.12411.97 |
| U1 | 167.162.58 | 48.3632.73 | 0.690.34 | 4.520.16 | 221.36121.42 | 0.610.23 | 1755.351255.41 | 804.1924.78 | 0.030.05 | 11142.216902.37 |
| U4 | 163.2524.55 | 50.6427.53 | 0.420.41 | 3.721.30 | 91.7541.17 | 0.790.20 | 263.51140.53 | 742.1784.30 | 0.020.03 | 9361.295839.12 |
| UnaL2 | 54.250.66 | 48.8025.71 | 0.700.40 | 0.360.01 | 36.113.30 | 0.990.04 | 23.058.38 | 263.798.94 | 0.030.06 | 171.59104.10 |
| ykoK | 175.397.32 | 82.0558.19 | 0.680.36 | 4.670.45 | 147.5569.66 | 0.810.20 | 472.79583.01 | 844.2731.56 | 0.030.05 | 12019.336178.91 |
| ykoK | 144.2663.44 | 81.0654.94 | 0.650.38 | 4.740.45 | 144.2663.44 | 0.810.20 | 449.03526.67 | 482.9727.04 | 0.000.00 | 12693.377330.66 |
| Pooled Average | 118.6747.86 | 50.3542.33 | 0.530.42 | 2.302.12 | 114.86125.33 | 0.640.36 | 625.532554.61 | 556.82227.00 | 0.030.04 | 5317.968585.19 |
Taken together, these results suggest that RNAmountAlign has comparable accuracy, but much faster run time, hence making it a potentially useful tool for genome scanning applications. Here it should be stressed that all benchmarking results used equally weighted contributions of sequence and ensemble structural similarity; i.e. parameter when computing similarity by Eq (2.0.3). By setting , RNAmountAlign alignments depend wholly on structural similarity (see Figure 1). Indeed, for the following BRAliBase 2.1 alignment with 28% sequence identity, by setting , RNAmountAlign returns the correct alignment.
GGGGAUGUAGCUCAGUGGUAGAGCGCAUGCUUCGCAUGUAUGAGGCCCCGGGUUCGAUCCCCGGCAUCUCCA
GUUUCAUGAGUAUAGC---AGUACAUUCGGCUUCCAACCGAAAGGUUUUUGUAAACAACCAAAAAUGAAAUA
of 72 nt tRNA AL671879.2 with 69 nt tRNA D16387.1. Fig 1 shows the superimposed mountain heights for this alignment.
3.2 Statistics for pairwise alignment
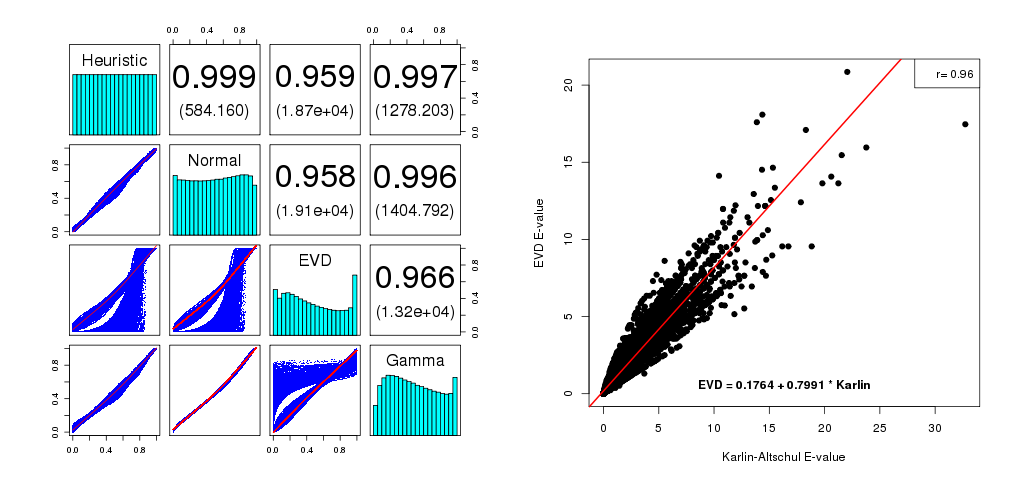
Fig 5 shows fits of the relative frequency histogram of alignment scores with the normal (ND), extreme value (EVD) and gamma (GD) distributions, where local [resp. semiglobal] alignment scores are shown in the left [resp. right] panel. The EVD provides the best fit for local alignment sequence-structure similarity scores, as expected by Karlin-Altschul theo [20, 19]. Moreover, Fig 6 shows a 96% correlation between (expect) E-values computed by our implementation of the Karlin-Altschul method, and E-values obtained by maximum likelihood fitting of local alignment scores. In contrast, the ND provides the best fit for semiglobal sequence/structure alignment similarity scores, at least for the sequence considered in Fig 5. This is not an isolated phenomenon, as shown in Fig 6, which depicts scatter plots, Pearson correlation values and sums of squared residuals (SSRs) when computing -values for semiglobal (query search) alignment scores between Rfam sequences and random RNA. As explained earlier, a pool of 2220 sequences from the Rfam 12.0 database [27] was created by selecting one sequence of length at most nt from each family, with the property that base pair distance between its minimum free energy (MFE) structure and the Rfam consensus structure was a minimum. Then 500 sequences were randomly selected from this pool, and for each of five gap initiation and extension costs with . Taking each of the 500 sequences successively as query sequence and for each choice of parameters, random 400 nt RNAs were generated with the same expected nucleotide relative frequency as that of the query. For each alignment score for query and random target, the -value was computed as minus the cumulative density function, , for fitted normal (ND), extreme value (EVD) and gamma (GD) distributions, thus defining -values. Additionally, a heuristic -value was determined by calculating the proportion of alignment scores for given query that exceed . For each set of million () -values (heuristic, ND, EVD, GD), Pearson correlation values were computed and displayed in the upper triangular portion of Fig 6, with SSRs shown in parentheses. Note that residuals were computed for regression equation , where column values constitute the independent variable. Assuming that heuristic -values constitute the reference standard, it follows that -values computed from the normal distribution correlate best with semiglobal alignment scores computed by RNAmountAlign.
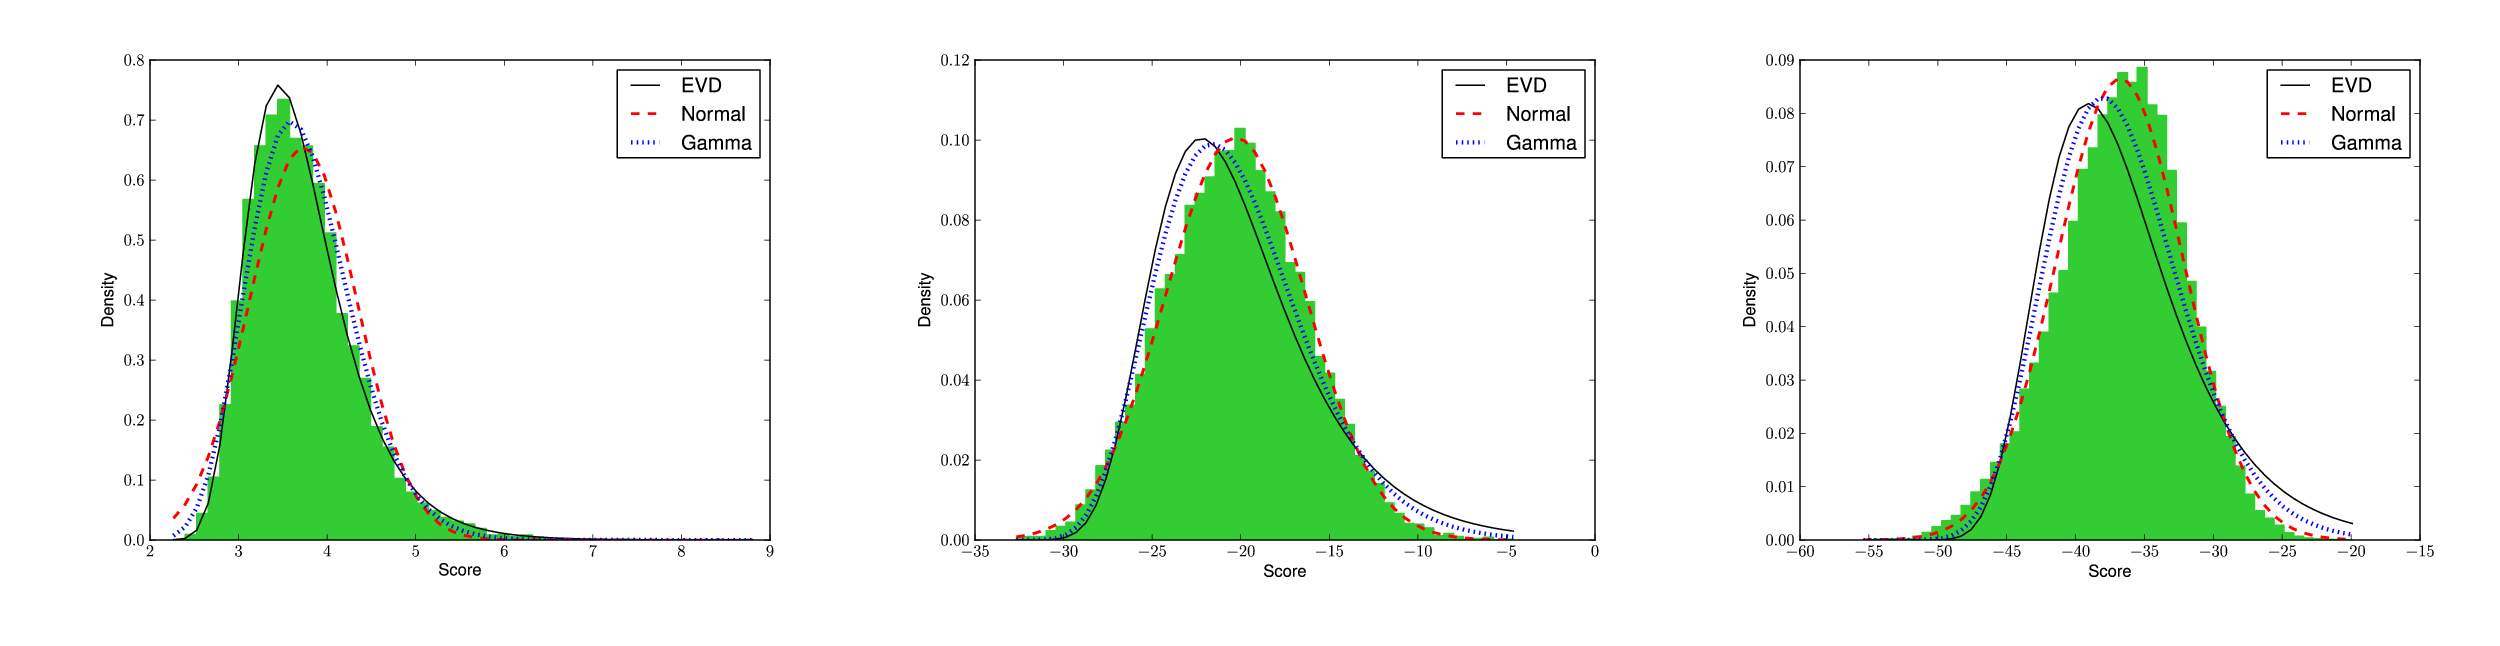
Earlier studies have suggested that protein global alignment similarity scores using PAM120, PAM250, BLOSUM50, and BLOSUM62 matrices appear to be fit best by the gamma distribution (GD) [31], and that semiglobal RNA sequence alignment similarity scores (with no contribution from structure) appear to be best fit by GD [14]. However, in our preliminary studies (not shown), it appears that the type of distribution (ND, EVD, GD) that best fits RNAmountAlign semiglobal alignment depends on the gap costs applied (indeed, for certain choices, EVD provides the best fit). Since there is no mathematical theory concerning alignment score distribution for global or semiglobal alignments, it must be up to the user to decide which distribution provides the most reasonable -values.
3.3 Multiple alignment
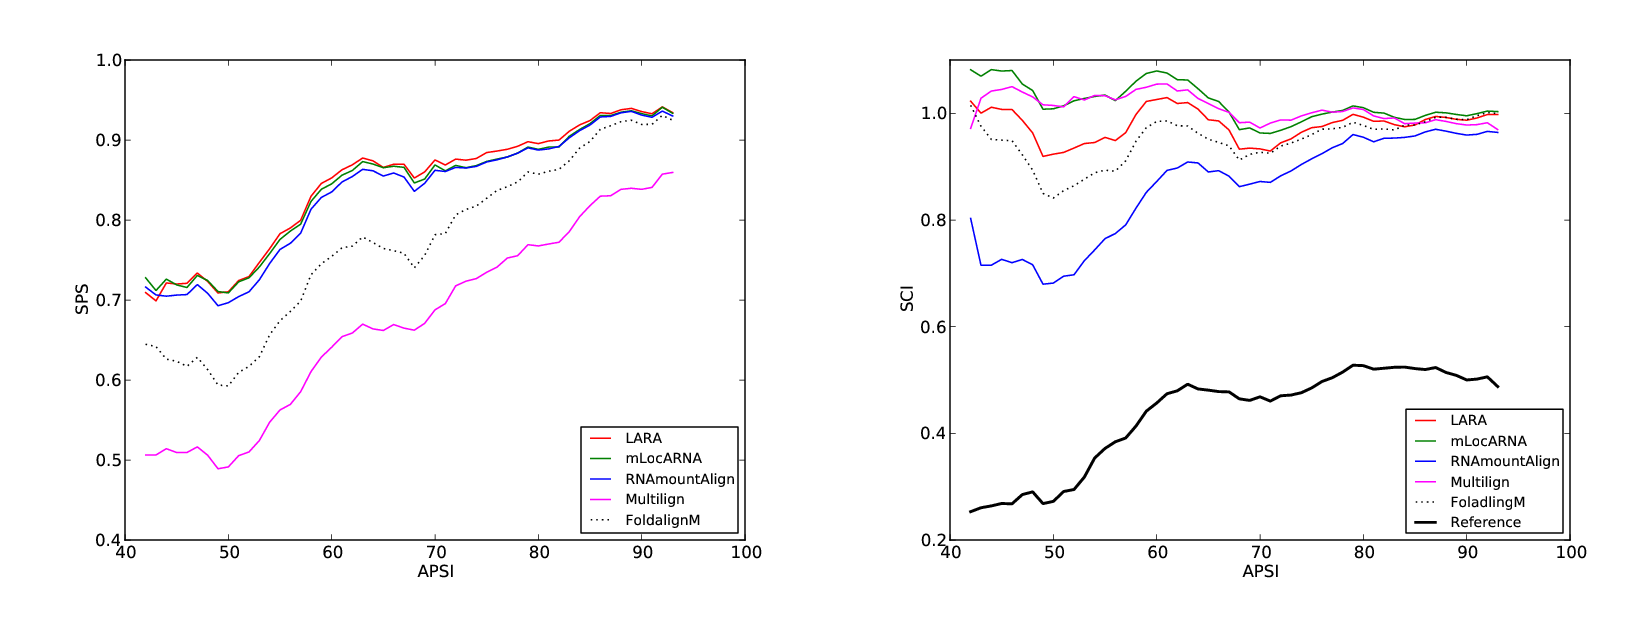
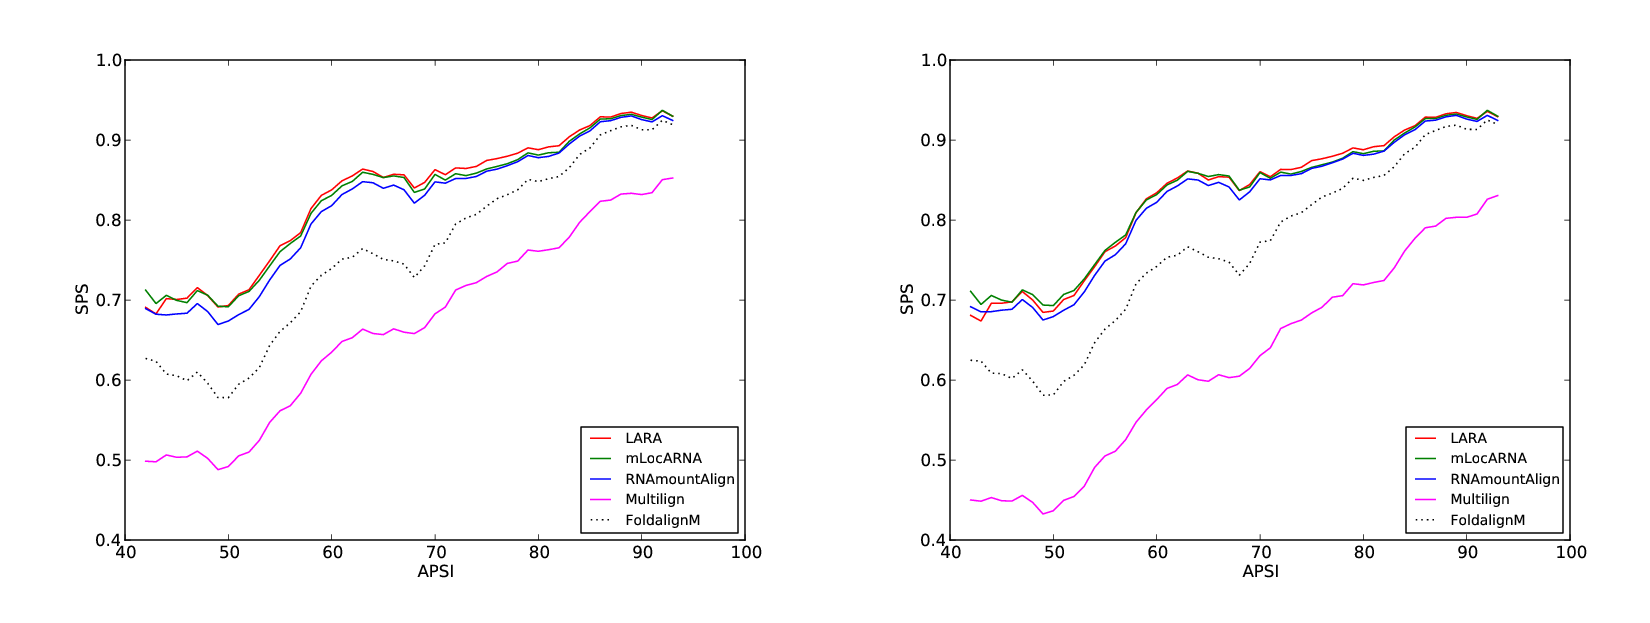
We benchmarked RNAmountAlign with the software LARA, mLocARNA, FOLDALIGNM and Multilign for multiple global K5 alignments in Bralibase 3. STRAL is not included since the source code could not be compiled. Fig 7 indicates average SPS and SCI as a function of average pairwise sequence identity (APSI). We used the -sci flag of RNAalifold to compute SCI from the output of each software without reference to the reference alignment. Fig 7 indicates that SCI values for outputs from various alignment algorithms is higher than the SCI value from reference alignments, suggesting that the consensus structure obtained from sequence/structure alignment algorithms has a larger number of base pairs than the the consensus structure obtained from reference alignments (this phenomenon was also in [35]). Fig 7 indicates that RNAmountAlign produces SPS scores comparable to mLocARNA and LARA and higher than Multilign and FOLDALIGNM while the SCI score obtained from RNAmountAlign are slightly lower than other software. Averaging over all sequences, the SPS scores for RNAmountAlign, LARA, mLocARNA, FOLDALIGNM and Multilign were respectively: , , , , and . The left panel of Fig 8 indicates the run time of all software on a logarithmic scale, while the right panel shows the actual run time in seconds for RNAmountAlign as well as that of the next two fastest algorithms, mLocARNA and LARA. This figure clearly shows that RNAmountAlign has much faster run time than all other software in our benchmarking tests, thus confirming the earlier result from pairwise benchmarking.
4 Conclusion
RNAmountAlign is a new C++ software package for RNA local, global, and semiglobal sequence/structure alignment, which provides accuracy comparable with that of a number of widely used programs, but provides much faster run time. RNAmountAlign additionally computes E-values for local alignments, using Karlin-Altschul statistics, as well as -values for normal, extreme value and gamma distributions by parameter fitting.
5 Acknowledgements
Research supported by National Science Foundation grant DBI-1262439. Any opinions, findings, and conclusions or recommendations expressed in this material are those of the authors and do not necessarily reflect the views of the National Science Foundation.
References
- 1. M. Barsacchi, A. Baù, and A. Bechini. Extensive assessment of metrics on RNA secondary structures and relative ensembles. In Proceedings of the 31st Annual ACM Symposium on Applied Computing, SAC ’16, pages 44–47, New York, NY, USA, 2016. ACM.
- 2. M. Bauer, G. W. Klau, and K. Reinert. Accurate multiple sequence-structure alignment of RNA sequences using combinatorial optimization. BMC. Bioinformatics, 8:271, 2007.
- 3. S. H. Bernhart, I. L. Hofacker, S. Will, A. R. Gruber, and P. F. Stadler. RNAalifold: improved consensus structure prediction for RNA alignments. BMC. Bioinformatics, 9:474, 2008.
- 4. P. Clote, F. Ferre, E. Kranakis, and D. Krizanc. Structural RNA has lower folding energy than random RNA of the same dinucleotide frequency. RNA., 11(5):578–591, May 2005.
- 5. D. Dalli, A. Wilm, I. Mainz, and G. Steger. STRAL: progressive alignment of non-coding RNA using base pairing probability vectors in quadratic time. Bioinformatics, 22(13):1593–1599, July 2006.
- 6. Y. Ding and C.E. Lawrence. A statistical sampling algorithm for RNA secondary structure prediction. Nucleic Acids Res., 31(24):7280–7301, 2003.
- 7. F. Ferre, Y. Ponty, W. A. Lorenz, and P. Clote. DIAL: a web server for the pairwise alignment of two RNA three-dimensional structures using nucleotide, dihedral angle and base-pairing similarities. Nucleic. Acids. Res., 35(Web):W659–W668, July 2007.
- 8. E. K. Freyhult, J. P. Bollback, and P. P. Gardner. Exploring genomic dark matter: a critical assessment of the performance of homology search methods on noncoding RNA. Genome Res., 17(1):117–125, January 2007.
- 9. P. P. Gardner, A. Wilm, and S. Washietl. A benchmark of multiple sequence alignment programs upon structural RNAs. Nucleic. Acids. Res., 33(8):2433–2439, 2005.
- 10. O. Gotoh. An improved algorithm for matching biological sequences. J. Mol. Biol., 162(3):705–708, December 1982.
- 11. D. Gusfield. Algorithms on Strings, Trees and Sequences: Computer Science and Computational Biology. Cambridge University, 1997.
- 12. J. Havgaard, S. Kaur, and J. Gorodkin. Comparative ncRNA gene and structure prediction using Foldalign and FoldalignM. Curr Protoc Bioinformatics, 0(O):O, September 2012.
- 13. J.H. Havgaard, R. Lyngsø, G. Stormo, and J. Gorodkin. Pairwise local structural alignment of RNA sequences with sequence similarity less than 40%. Bioinformatics, 21(9), 2005.
- 14. J. Hertel, D. De Jong, M. Marz, D. Rose, H. Tafer, A. Tanzer, B. Schierwater, and P. F. Stadler. Non-coding RNA annotation of the genome of Trichoplax adhaerens. Nucleic. Acids. Res., 37(5):1602–1615, April 2009.
- 15. I. L. Hofacker, S. H. Bernhart, and P. F. Stadler. Alignment of RNA base pairing probability matrices. Bioinformatics, 20(14):2222–2227, September 2004.
- 16. P. Hogeweg and B. Hesper. Energy directed folding of RNA sequences. Nucleic. Acids. Res., 12(1):67–74, January 1984.
- 17. M. A. Huynen, A. Perelson, W. A. Vieira, and P. F. Stadler. Base pairing probabilities in a complete HIV-1 RNA. J. Comput. Biol., 3(2):253–274, 1996.
- 18. Martijn Huynen, Robin Gutell, and Danielle Konings. Assessing the reliability of rna folding using statistical mechanics11edited by d. e. draper. Journal of Molecular Biology, 267(5):1104 – 1112, 1997.
- 19. S. Karlin and S. F. Altschul. Methods for assessing the statistical significance of molecular sequence features by using general scoring schemes. Proc. Natl. Acad. Sci. U.S.A., 87(6):2264–2268, March 1990.
- 20. S. Karlin, A. Dembo, and T. Kawabata. Statistical composition of high-scoring segments from molecular sequences. Annals of Statistics, 18(2):571–581, 1990.
- 21. R.J. Klein and S.R. Eddy. Finding homologs of single structured RNA sequences. BMC Bioinformatics, 4:44, 2003.
- 22. V.I. Levenshtein. Binary codes capable of correcting deletions, insertions and reversals. Soviet Physics Doklady, 10:707, 1966.
- 23. R. Lorenz, S. H. Bernhart, C. Höner zu Siederdissen, H. Tafer, C. Flamm, P. F. Stadler, and I. L. Hofacker. Viennarna Package 2.0. Algorithms. Mol. Biol., 6:26, 2011.
- 24. Todd M. Lowe and Patricia P. Chan. trnascan-se on-line: integrating search and context for analysis of transfer rna genes. Nucleic Acids Research, 44(W1):W54–W57, 2016.
- 25. D. H. Mathews and D. H. Turner. Dynalign: an algorithm for finding the secondary structure common to two RNA sequences. J. Mol. Biol., 317(2):191–203, March 2002.
- 26. V. Moulton, M. Zuker, M. Steel, R. Pointon, and D. Penny. Metrics on RNA secondary structures. Journal of Computational Biology, 7:277–292, 2000.
- 27. E. P. Nawrocki, S. W. Burge, A. Bateman, J. Daub, R. Y. Eberhardt, S. R. Eddy, E. W. Floden, P. P. Gardner, T. A. Jones, J. Tate, and R. D. Finn. Rfam 12.0: updates to the RNA families database. Nucleic. Acids. Res., 43(Database):D130–D137, January 2015.
- 28. Eric P. Nawrocki and Sean R. Eddy. Infernal 1.1: 100-fold faster rna homology searches. Bioinformatics, 29(22):2933–2935, 2013.
- 29. S. B. Needleman and C. D. Wunsch. A general method applicable to the search for similarities in the amino acid sequence of two proteins. J. Mol. Biol., 48(3):443–453, March 1970.
- 30. C. Notredame, D. G. Higgins, and J. Heringa. T-Coffee: A novel method for fast and accurate multiple sequence alignment. J. Mol. Biol., 302(1):205–217, September 2000.
- 31. H. Pang, J. Tang, S. S. Chen, and S. Tao. Statistical distributions of optimal global alignment scores of random protein sequences. BMC. Bioinformatics, 6:257, October 2005.
- 32. P.H. Sellers. On the theory and computation of evolutionary distances. SIAM J Appl. Math., 26:787–793, 1974.
- 33. B. A. Shapiro. An algorithm for comparing multiple RNA secondary structures. Comput. Appl. Biosci., 4(3):387–393, August 1988.
- 34. C. Smith, S. Heyne, A. S. Richter, S. Will, and R. Backofen. Freiburg RNA Tools: a web server integrating INTARNA, EXPARNA and LOCARNA. Nucleic. Acids. Res., 38(Web):W373–W377, July 2010.
- 35. M. A. Smith, S. E. Seemann, X. C. Quek, and J. S. Mattick. Dotaligner: identification and clustering of RNA structure motifs. Genome Biol., 18(1):244, December 2017.
- 36. T.F. Smith and M.S. Waterman. Comparison of biosequences. Advances in Applied Mathematics, 2:482–489, 1981.
- 37. T.F. Smith and M.S. Waterman. Identification of common molecular subsequences. J Mol Biol., 147(1):195–197, 1981.
- 38. D. Sundfeld, J. H. Havgaard, A. C. De Melo, and J. Gorodkin. Foldalign 2.5: multithreaded implementation for pairwise structural RNA alignment. Bioinformatics, 32(8):1238–1240, April 2016.
- 39. Y. Tabei and K. Asai. A local multiple alignment method for detection of non-coding RNA sequences. Bioinformatics, 25(12):1498–1505, June 2009.
- 40. J. D. Thompson, D. G. Higgins, and T. J. Gibson. CLUSTAL W: improving the sensitivity of progressive multiple sequence alignment through sequence weighting, position-specific gap penalties and weight matrix choice. Nucleic. Acids. Res., 22(22):4673–4680, November 1994.
- 41. J. D. Thompson, F. Plewniak, and O. Poch. A comprehensive comparison of multiple sequence alignment programs. Nucleic. Acids. Res., 27(13):2682–2690, July 1999.
- 42. E. Torarinsson, J. H. Havgaard, and J. Gorodkin. Multiple structural alignment and clustering of RNA sequences. Bioinformatics, 23(8):926–932, April 2007.
- 43. D. H. Turner and D. H. Mathews. NNDB: the nearest neighbor parameter database for predicting stability of nucleic acid secondary structure. Nucleic. Acids. Res., 38(Database):D280–D282, January 2010.
- 44. B. Voss, C. Meyer, and R. Giegerich. Evaluating the predictability of conformational switching in RNA. Bioinformatics, 20(10):1573–1582, 2004.
- 45. S. Will, K. Reiche, I. L. Hofacker, P. F. Stadler, and R. Backofen. Inferring noncoding RNA families and classes by means of genome-scale structure-based clustering. PLoS. Comput. Biol., 3(4):e65, April 2007.
- 46. Z. Xu and D. H. Mathews. Multilign: an algorithm to predict secondary structures conserved in multiple RNA sequences. Bioinformatics, 27(5):626–632, March 2011.
- 47. Z. Z. Xu and D. H. Mathews. Prediction of Secondary Structures Conserved in Multiple RNA Sequences. Methods Mol. Biol., 1490:35–50, 2016.
Appendix A Supplementary Information
A.1 Software usage
RNAmountAlign performs local, semiglobal, and global sequence/structure alignments. By default the global alignment is computed unless flags -local or -semi are used to perform local and semiglobal alignments, respectively. In the simplest case, the program could be run with
The parameters that were used to produce the results in the main text are used as the default by the software: structural similarity weight , gap initiation , and gap extension . The weight factor defines the importance of structural similarity versus sequence similarity. When only sequence similarity is considered, while only uses the incremental ensemble mountain heights for the alignment. As an example, let’s consider the following two toy sequences each forming a stem loop secondary structure
Running the software considering only sequence similarity with gap initiation and extension penalties of -2 and -1, respectively, by the command
produces the following alignment
where four C nucleotides are aligned together, regardless of the fact that in the secondary structure for the first sequence, they are found in an apical loop region, while in the secondary structure for the second sequence, they are part of a stem. However, using -gamma 1 returns
where the opening, closing and unpaired bases are aligned to each other. Finally, using -gamma 0.5 gives
where both sequence and structural similarity are equally weighted.
The default nucleotide similarity matrix is RIBOSUM85-60.
Other RIBOSUM matrices are included in the software and can be selected
with -m flag based on the user’s knowledge of
divergence of the input sequences.
RNAmountAlign computes the consensus secondary structure by calling alifold() function from libRNA.a in the Vienna RNA Package when flag -alifold is used. For example the following command outputs the consensus structure in addition to the alignment for the same sequences indicated in Fig 1 of the main text. See Fig S1.
Computation of alignment statistics depends on the alignment type. As discussed in the main text, local alignment scores follow extreme value distribution(EVD) while global and semiglobal scores tend to follow normal distribution(ND). Flag -stat can be set to compute both -values and -values, where the transformation between -values and -values is made by . For global and semiglobal alignments, the first (query) sequence is aligned to a number of random RNAs, defined by -num flag, with the same nucleotide composition as the second sequence (target), then the random alignment scores are fitted to normal distribution and a -value is returned.
As part of the output, -value from ND normal fitting of 100 random alignment scores is reported:
For local alignments either Karlin-Altschul statistics (default) or EVD fitting can be computed. Let’s consider an example of a local alignment between two purine riboswitches with Rfam seed alignment length of 102 and sequence identity . Random flanking regions with the same nucleotide composition are added to the seed alignment as discussed in the main text to obtain two sequences of length and . The local alignment between these two sequences has length with extremely low -value, with the property that all pairs in the local alignment are found in the reference seed alignment (). -value from Karlin-Altschul statistics can be obtained very fast from the following command:
Computation of -value from EVD fitting is more accurate but slower:
RNAmountAlign computes Karlin-Altschul -values from maximum likelihood method described in the main text, and then multiplies it by the regression coefficient of , indicated in the right panel of Fig 6, to obtain an estimated -value. Therefore, there might be discrepancy between the EVD fitting and Karlin-Altschul -values. For the most accurate statistics EVD fitting is recommended.
Our software could also be used for searching a query sequence defined by -qf <fastaFile> in a target sequence defined by -tf <fastaFile>. The search computes semiglobal alignments of the query to sliding windows of the target, and returns the aligned segments of the target sorted by -value. The query is aligned to windows of a fixed size defined by -window, sliding by steps defined by -step flag. To compute the statistics, random alignment scores are computed and fitted to ND. However, the software does not compute random alignments for each window separately as it would be very slow. Instead, following [21], the range of the GC-content of the target sequence over all the sliding windows is first obtained and binned using bin size defined by -gc. For each GC-content bin, fitting paremeters are precomputed by generating a number of random sequences whose GC-content is equal to the bin midpoint, aligning the query to random sequences, and fitting random alignment scores to normal distribution. For each sliding window the corresponding precomputed parameters are used for the computation of -value. As an example, a random tRNA from Rfam 12.0 whose minimum free energy structure has the minimum base pair distance to the Rfam consensus structure was selected and used as the query to search E. coli K12 MG1655 genome using window size and step size by the following command.
The output contains:
| GC_Content | Location_Param | Scale_Param |
| 0.283 | -12.18 | 1.96 |
| 0.383 | -13.41 | 2.03 |
| 0.483 | -15.01 | 2.05 |
| 0.583 | -16.84 | 2.05 |
| 0.683 | -18.98 | 2.16 |
| 0.735 | -20.08 | 2.06 |
As indicated, six GC bins are generate in range ; for each bin 1000 random sequences whose GC-content are equal to the average GC-content of the bins are generated, aligned to the query and their fitted location (mean) and scale (standard deviation) parameters are precomputed to be used for computation of -values. From the top 20 hits of our software, the first 18 are reported to be tRNAs by tRNAscan-SE [24].
To see all the full parameter list for the software please use
| Type | NumAln | SeqId | MA(sen) | LOC(sen) | LARA(sen) | FA(sen) | DA(sen) | STRAL(sen) |
|---|---|---|---|---|---|---|---|---|
| 5.8 S rRNA | 76 | 0.90±0.09 | 0.95±0.07 | 0.87±0.14 | 0.89±0.11 | 0.65±0.22 | 0.66±0.22 | 0.71±0.15 |
| 5S rRNA | 1162 | 0.60±0.14 | 0.83±0.17 | 0.87±0.13 | 0.84±0.16 | 0.85±0.14 | 0.69±0.17 | 1.00±0.02 |
| Cobalamin | 188 | 0.43±0.10 | 0.55±0.16 | 0.30±0.13 | 0.48±0.20 | 0.43±0.24 | 0.37±0.19 | 1.00±0.02 |
| Entero 5 CRE | 48 | 0.88±0.06 | 0.98±0.05 | 0.99±0.04 | 0.99±0.05 | 0.99±0.02 | 0.87±0.12 | 0.88±0.16 |
| Entero CRE | 65 | 0.80±0.07 | 1.00±0.00 | 0.99±0.03 | 0.97±0.06 | 0.99±0.03 | 0.77±0.16 | 0.90±0.16 |
| Entero OriR | 49 | 0.84±0.06 | 0.94±0.07 | 0.91±0.09 | 0.94±0.08 | 0.94±0.07 | 0.84±0.15 | 0.93±0.06 |
| gcvT | 167 | 0.44±0.13 | 0.59±0.19 | 0.60±0.24 | 0.57±0.25 | 0.40±0.33 | 0.44±0.19 | 0.77±0.17 |
| Hammerhead 1 | 53 | 0.71±0.17 | 0.89±0.13 | 0.90±0.12 | 0.87±0.16 | 0.83±0.25 | 0.53±0.27 | 0.92±0.03 |
| Hammerhead 3 | 126 | 0.66±0.21 | 0.86±0.21 | 0.88±0.21 | 0.88±0.21 | 0.79±0.31 | 0.71±0.31 | 1.00±0.01 |
| HCV SLIV | 98 | 0.85±0.05 | 0.99±0.03 | 0.98±0.04 | 0.98±0.03 | 0.99±0.03 | 0.81±0.34 | 0.94±0.08 |
| HCV SLVII | 51 | 0.83±0.09 | 0.97±0.06 | 0.96±0.06 | 0.93±0.10 | 0.95±0.07 | 0.72±0.22 | 0.95±0.07 |
| HepC CRE | 45 | 0.86±0.06 | 1.00±0.00 | 1.00±0.00 | 1.00±0.00 | 1.00±0.00 | 0.77±0.29 | 0.82±0.20 |
| Histone3 | 84 | 0.78±0.09 | 1.00±0.00 | 1.00±0.00 | 1.00±0.00 | 1.00±0.00 | 1.00±0.00 | 0.95±0.07 |
| HIV FE | 733 | 0.87±0.04 | 1.00±0.02 | 1.00±0.02 | 0.98±0.05 | 0.99±0.05 | 0.65±0.29 | 0.99±0.03 |
| HIV GSL3 | 786 | 0.86±0.04 | 0.99±0.02 | 0.99±0.02 | 0.98±0.05 | 0.99±0.03 | 0.81±0.19 | 0.88±0.11 |
| HIV PBS | 188 | 0.92±0.02 | 1.00±0.01 | 1.00±0.01 | 1.00±0.02 | 0.99±0.03 | 0.92±0.10 | 0.61±0.29 |
| Intron gpII | 181 | 0.46±0.13 | 0.64±0.17 | 0.63±0.17 | 0.62±0.18 | 0.50±0.28 | 0.49±0.18 | 0.61±0.25 |
| IRES HCV | 764 | 0.65±0.11 | 0.87±0.16 | 0.32±0.14 | 0.85±0.17 | 0.67±0.38 | 0.85±0.08 | 0.97±0.06 |
| IRES Picorna | 181 | 0.84±0.07 | 0.97±0.03 | 0.45±0.03 | 0.96±0.04 | 0.95±0.04 | 0.85±0.10 | 0.74±0.18 |
| K chan RES | 124 | 0.74±0.10 | 0.99±0.02 | 0.98±0.05 | 0.90±0.19 | 0.95±0.08 | 0.59±0.26 | 0.96±0.04 |
| Lysine | 80 | 0.50±0.13 | 0.72±0.13 | 0.44±0.13 | 0.71±0.18 | 0.65±0.16 | 0.50±0.16 | 0.54±0.17 |
| Retroviral psi | 89 | 0.88±0.03 | 0.93±0.03 | 0.93±0.03 | 0.93±0.03 | 0.92±0.04 | 0.74±0.12 | 0.99±0.03 |
| S box | 91 | 0.60±0.10 | 0.75±0.13 | 0.75±0.17 | 0.79±0.14 | 0.67±0.24 | 0.54±0.16 | 1.00±0.00 |
| SECIS | 114 | 0.44±0.16 | 0.58±0.21 | 0.62±0.21 | 0.57±0.25 | 0.54±0.25 | 0.39±0.24 | 0.61±0.20 |
| sno 14q I II | 44 | 0.75±0.10 | 0.92±0.10 | 0.89±0.16 | 0.85±0.20 | 0.89±0.19 | 0.59±0.27 | 0.99±0.02 |
| SRP bact | 114 | 0.48±0.16 | 0.65±0.21 | 0.65±0.21 | 0.63±0.25 | 0.64±0.21 | 0.52±0.22 | 0.61±0.20 |
| SRP euk arch | 122 | 0.51±0.20 | 0.62±0.29 | 0.24±0.12 | 0.64±0.29 | 0.64±0.26 | 0.51±0.26 | 0.65±0.20 |
| T-box | 18 | 0.68±0.15 | 0.77±0.17 | 0.36±0.13 | 0.68±0.25 | 0.70±0.17 | 0.59±0.21 | 1.00±0.00 |
| TAR | 286 | 0.87±0.04 | 0.99±0.03 | 0.99±0.02 | 0.99±0.03 | 0.98±0.04 | 0.84±0.19 | 0.91±0.13 |
| THI | 321 | 0.45±0.10 | 0.67±0.16 | 0.65±0.21 | 0.68±0.18 | 0.50±0.29 | 0.48±0.18 | 0.65±0.15 |
| tRNA | 2039 | 0.43±0.12 | 0.75±0.21 | 0.84±0.16 | 0.81±0.19 | 0.76±0.27 | 0.66±0.23 | 0.77±0.12 |
| U1 | 82 | 0.63±0.17 | 0.78±0.17 | 0.61±0.11 | 0.78±0.19 | 0.80±0.14 | 0.67±0.20 | 0.96±0.10 |
| U2 | 112 | 0.64±0.16 | 0.75±0.17 | 0.51±0.11 | 0.76±0.19 | 0.73±0.22 | 0.60±0.19 | 0.55±0.20 |
| U6 | 30 | 0.83±0.06 | 0.93±0.05 | 0.89±0.09 | 0.90±0.08 | 0.88±0.10 | 0.72±0.14 | 0.74±0.15 |
| UnaL2 | 138 | 0.77±0.08 | 0.93±0.08 | 0.92±0.09 | 0.88±0.15 | 0.91±0.09 | 0.65±0.29 | 0.87±0.08 |
| yybP-ykoY | 127 | 0.39±0.14 | 0.57±0.21 | 0.51±0.23 | 0.56±0.26 | 0.39±0.33 | 0.46±0.22 | 0.73±0.22 |
| Pooled Average | 249.33 | 0.63 | 0.83 | 0.78 | 0.84 | 0.80 | 0.68 | 0.82 |
| Type | NumAln | SeqId | MA(ppv) | LOC(ppv) | LARA(ppv) | FA(ppv) | DA(ppv) | STRAL(ppv) |
|---|---|---|---|---|---|---|---|---|
| 5.8 S rRNA | 76 | 0.72±0.13 | 0.90±0.09 | 0.82±0.07 | 0.87±0.15 | 0.89±0.11 | 0.66±0.22 | 0.88±0.12 |
| 5S rRNA | 1162 | 0.60±0.14 | 0.84±0.16 | 0.88±0.12 | 0.85±0.16 | 0.86±0.14 | 0.68±0.17 | 0.82±0.20 |
| Cobalamin | 188 | 0.43±0.10 | 0.56±0.16 | 0.54±0.23 | 0.49±0.20 | 0.43±0.24 | 0.36±0.19 | 0.54±0.17 |
| Entero 5 CRE | 48 | 0.88±0.06 | 0.98±0.04 | 0.99±0.04 | 0.99±0.05 | 0.99±0.02 | 0.86±0.13 | 0.97±0.06 |
| Entero CRE | 65 | 0.80±0.07 | 1.00±0.00 | 0.99±0.03 | 0.96±0.08 | 0.99±0.04 | 0.74±0.18 | 0.99±0.03 |
| Entero OriR | 49 | 0.84±0.06 | 0.95±0.07 | 0.94±0.08 | 0.94±0.08 | 0.94±0.07 | 0.84±0.15 | 0.96±0.08 |
| gcvT | 167 | 0.44±0.13 | 0.62±0.18 | 0.63±0.23 | 0.58±0.25 | 0.41±0.34 | 0.44±0.19 | 0.62±0.20 |
| Hammerhead 1 | 53 | 0.71±0.17 | 0.90±0.13 | 0.90±0.11 | 0.87±0.16 | 0.83±0.25 | 0.51±0.27 | 0.88±0.16 |
| Hammerhead 3 | 126 | 0.66±0.21 | 0.87±0.20 | 0.88±0.21 | 0.89±0.20 | 0.80±0.30 | 0.71±0.31 | 0.91±0.15 |
| HCV SLIV | 98 | 0.85±0.05 | 0.99±0.03 | 0.98±0.04 | 0.98±0.03 | 0.99±0.03 | 0.80±0.34 | 0.99±0.03 |
| HCV SLVII | 51 | 0.83±0.09 | 0.97±0.06 | 0.96±0.06 | 0.93±0.10 | 0.95±0.07 | 0.69±0.22 | 0.95±0.07 |
| HepC CRE | 45 | 0.86±0.06 | 1.00±0.00 | 1.00±0.00 | 1.00±0.00 | 1.00±0.00 | 0.76±0.29 | 1.00±0.00 |
| Histone3 | 84 | 0.78±0.09 | 1.00±0.00 | 1.00±0.00 | 1.00±0.00 | 1.00±0.00 | 1.00±0.00 | 1.00±0.00 |
| HIV FE | 733 | 0.87±0.04 | 1.00±0.02 | 1.00±0.02 | 0.98±0.05 | 0.98±0.05 | 0.63±0.30 | 1.00±0.02 |
| HIV GSL3 | 786 | 0.86±0.04 | 0.99±0.02 | 0.99±0.02 | 0.98±0.06 | 0.99±0.02 | 0.80±0.20 | 0.99±0.02 |
| HIV PBS | 188 | 0.92±0.02 | 1.00±0.01 | 1.00±0.01 | 1.00±0.02 | 0.99±0.03 | 0.90±0.11 | 1.00±0.01 |
| Intron gpII | 181 | 0.46±0.13 | 0.65±0.16 | 0.66±0.17 | 0.63±0.17 | 0.50±0.28 | 0.49±0.18 | 0.65±0.15 |
| IRES HCV | 764 | 0.65±0.11 | 0.89±0.16 | 0.77±0.31 | 0.86±0.17 | 0.69±0.38 | 0.85±0.08 | 0.89±0.08 |
| IRES Picorna | 181 | 0.84±0.07 | 0.97±0.03 | 0.95±0.06 | 0.96±0.04 | 0.95±0.04 | 0.84±0.11 | 0.96±0.04 |
| K chan RES | 124 | 0.74±0.10 | 0.99±0.02 | 0.98±0.05 | 0.89±0.19 | 0.95±0.08 | 0.57±0.26 | 0.95±0.12 |
| Lysine | 80 | 0.50±0.13 | 0.73±0.13 | 0.70±0.19 | 0.72±0.18 | 0.66±0.16 | 0.49±0.16 | 0.72±0.15 |
| Retroviral psi | 89 | 0.88±0.03 | 0.93±0.03 | 0.94±0.03 | 0.94±0.03 | 0.93±0.04 | 0.73±0.13 | 0.93±0.04 |
| S box | 91 | 0.60±0.10 | 0.75±0.12 | 0.77±0.16 | 0.79±0.14 | 0.67±0.24 | 0.53±0.16 | 0.77±0.12 |
| SECIS | 114 | 0.44±0.16 | 0.59±0.21 | 0.63±0.21 | 0.58±0.25 | 0.54±0.25 | 0.38±0.24 | 0.62±0.20 |
| sno 14q I II | 44 | 0.75±0.10 | 0.93±0.10 | 0.89±0.16 | 0.85±0.20 | 0.89±0.19 | 0.57±0.27 | 0.91±0.13 |
| SRP bact | 114 | 0.48±0.16 | 0.66±0.21 | 0.66±0.20 | 0.64±0.24 | 0.65±0.21 | 0.51±0.21 | 0.62±0.25 |
| SRP euk arch | 122 | 0.51±0.20 | 0.63±0.29 | 0.63±0.29 | 0.65±0.28 | 0.65±0.25 | 0.50±0.25 | 0.62±0.28 |
| T-box | 18 | 0.68±0.15 | 0.78±0.17 | 0.75±0.25 | 0.67±0.24 | 0.70±0.17 | 0.59±0.20 | 0.74±0.15 |
| TAR | 286 | 0.87±0.04 | 0.99±0.03 | 0.99±0.02 | 0.99±0.03 | 0.98±0.04 | 0.83±0.20 | 0.99±0.04 |
| THI | 321 | 0.45±0.10 | 0.69±0.15 | 0.68±0.19 | 0.69±0.17 | 0.51±0.29 | 0.48±0.18 | 0.66±0.20 |
| tRNA | 2039 | 0.43±0.12 | 0.75±0.21 | 0.85±0.16 | 0.82±0.19 | 0.76±0.27 | 0.65±0.23 | 0.72±0.22 |
| U1 | 82 | 0.63±0.17 | 0.80±0.17 | 0.83±0.14 | 0.79±0.18 | 0.81±0.14 | 0.67±0.20 | 0.77±0.17 |
| U2 | 112 | 0.64±0.16 | 0.76±0.17 | 0.83±0.17 | 0.77±0.19 | 0.73±0.22 | 0.59±0.19 | 0.75±0.18 |
| U6 | 30 | 0.83±0.06 | 0.93±0.05 | 0.89±0.09 | 0.90±0.08 | 0.88±0.10 | 0.71±0.14 | 0.93±0.06 |
| UnaL2 | 138 | 0.77±0.08 | 0.93±0.08 | 0.92±0.09 | 0.89±0.15 | 0.91±0.10 | 0.64±0.29 | 0.94±0.08 |
| yybP-ykoY | 127 | 0.39±0.14 | 0.58±0.20 | 0.59±0.24 | 0.58±0.25 | 0.40±0.33 | 0.46±0.21 | 0.56±0.20 |
| Pooled Average | 249.33 | 0.63 | 0.84 | 0.86 | 0.85 | 0.8 | 0.67 | 0.83 |
| 0.00 | 0.00 | 0.00 | 1.00 | 0.000000 | 0.000000 | 1.000000 | 0.000000 | 0.000000 | 0.000000 |
| 0.00 | 0.00 | 0.05 | 0.95 | 0.000533 | 0.000533 | 0.998933 | 0.000292 | 0.000292 | 0.000583 |
| 0.00 | 0.00 | 0.10 | 0.90 | 0.001396 | 0.001396 | 0.997209 | 0.000818 | 0.000818 | 0.001636 |
| 0.00 | 0.00 | 0.15 | 0.85 | 0.002704 | 0.002704 | 0.994592 | 0.001548 | 0.001548 | 0.003096 |
| 0.00 | 0.00 | 0.20 | 0.80 | 0.004785 | 0.004785 | 0.990431 | 0.002863 | 0.002863 | 0.005725 |
| 0.00 | 0.00 | 0.25 | 0.75 | 0.008039 | 0.008039 | 0.983922 | 0.004992 | 0.004992 | 0.009983 |
| 0.00 | 0.00 | 0.30 | 0.70 | 0.013641 | 0.013641 | 0.972717 | 0.008488 | 0.008488 | 0.016976 |
| 0.15 | 0.20 | 0.15 | 0.50 | 0.198666 | 0.198666 | 0.602668 | 0.031304 | 0.031304 | 0.062607 |
| 0.15 | 0.20 | 0.20 | 0.45 | 0.244486 | 0.244486 | 0.511027 | 0.028368 | 0.028368 | 0.056737 |
| 0.15 | 0.20 | 0.25 | 0.40 | 0.280658 | 0.280658 | 0.438684 | 0.023478 | 0.023478 | 0.046957 |
| 0.15 | 0.20 | 0.30 | 0.35 | 0.306193 | 0.306193 | 0.387613 | 0.018226 | 0.018226 | 0.036452 |
| 0.15 | 0.20 | 0.35 | 0.30 | 0.319277 | 0.319277 | 0.361446 | 0.014271 | 0.014271 | 0.028541 |
| 0.15 | 0.20 | 0.40 | 0.25 | 0.320472 | 0.320472 | 0.359056 | 0.014868 | 0.014868 | 0.029735 |
| 0.15 | 0.20 | 0.45 | 0.20 | 0.310048 | 0.310048 | 0.379905 | 0.018890 | 0.018890 | 0.037781 |
| 0.15 | 0.20 | 0.50 | 0.15 | 0.289160 | 0.289160 | 0.421679 | 0.023603 | 0.023603 | 0.047205 |
| 0.15 | 0.20 | 0.55 | 0.10 | 0.259201 | 0.259201 | 0.481598 | 0.027322 | 0.027322 | 0.054644 |
| 0.15 | 0.20 | 0.60 | 0.05 | 0.223416 | 0.223416 | 0.553168 | 0.027906 | 0.027906 | 0.055813 |
| 0.15 | 0.20 | 0.65 | 0.00 | 0.183844 | 0.183844 | 0.632311 | 0.026849 | 0.026849 | 0.053698 |
| 0.15 | 0.25 | 0.00 | 0.60 | 0.009383 | 0.009383 | 0.981234 | 0.008960 | 0.008960 | 0.017920 |