RESONANT TEMPERATURE FLUCTUATIONS IN NEBULAE IONIZED BY SHORT-PERIOD BINARY STARS
Abstract
A prevailing open problem in planetary nebulae research, and photoionized gaseous nebulae research at large, is the systematic discrepancies in electron temperatures and ionic abundances as derived from recombination and collisionally excited lines. Peimbert (1967) proposed the presence of ’temperature fluctuations’ in these nebulae, but the apparent amplitude of such fluctuations, as deduced from spectral diagnostics and/or abundance discrepancy factors, remain unexplained by standard photoionization modeling. While this and other alternative models to explain the temperature and abundance discrepancies remain inconclusive, recent observations seem to point at a connection between nebular abundance discrepancy factors and a binary nature of photoionizing stars. In this paper we show that large amplitude temperature fluctuations are expected to form in planetary nebulae photoionized by short-period binary stars. Resonant temperature fluctuations are first formed along the orbital disk around the binary stars, as the periodically varying ionizing radiation field induces periodic oscillations in the heating-minus-cooling function. Then, the temperatures fluctuations propagate vertically to the disk as thermal waves that later steepen into radiative shocks. The binary period of the ionizing stars is determinant in the formation and propagation of temperature fluctuations, as well as in associated density fluctuations. Fluctuations propagate efficiently only in systems with binary periods significantly shorter than the gas thermalization time, of the order of 10 days.
Further, we propose temperature diagnostic line ratios that combine [O III] collisionally excited lines and O II recombination lines to determine the equilibrium temperature and the magnitude of resonant temperature fluctuations in nebulae.
1 INTRODUCTION
Arguably, the most intriguing question left unanswered in photoionization modeling in astronomy pertains the origin of systematic discrepancies in ionic abundances derived from recombination and collisionally excited lines in a large fraction of known H II regions and planetary nebulae (PNe). Such differences in derived abundances are generally quantified in terms of abundance discrepancy factors (ADF) that can reach up to two orders of magnitude for C, N, O, and Ne in some extreme PNe (e.g. McNabb et al. 2016; Corradi et al. 2015; Wesson et al. 2003). These ADF seem to be the result of temperatures associated with recombination spectra being considerably lower than those derived from forbidden collisionaly excited lines (Torres-Peimbert et al. 1980). Peimbert (1967) proposed the existence of “temperature fluctuations” common to H II regions and PNe, but the amplitude of such fluctuations needed to reconcile the abundance determination are too large, in general, to be reproduced by standard photoionization modeling (Kingdon and Ferland 1995). The existence of temperature variations of some sort has been supported by modern spectra from high sensitivity, high spatial resolution instruments. Liu et al. (2000, 2001) showed that the temperatures of PNe determined by ratios of collisionally excited lines (e.g. [O III], [N II], [S III]) are typically larger than the temperatures derived in hydrogen by fitting the Balmer discontinuity to the Balmer recombination lines (Te(Bac)). Moreover, the ADF from collisional and recombination lines from optical and UV spectra of PNe and H II regions are correlated with the difference between Te([O III]) and Te(Bac) (García-Rojas and Esteban 2007; Liu et al. 2004). Further, point-to-point electron temperature variations have been obtained for several high surface brightness PNe and H II regions (Rubin et al. 2002, 2003; Krabbe and Copetti 2002, 2005; O’Dell et al. 2003, 2013; Garnett and Dinerstein 2001; Wesson & Liu 2004), though the spatial scale of the variations is expected to be too small to be resolved in detail. Not surprisingly, temperature variations averaged over the smallest spatial scales that can be resolved observationally at present are too small to account for ADF (see the case of NGC 6543 by Wesson & Liu 2004).
At present, the idea that is receiving the most attention in explaining ADF is the hypothesis of chemically inhomogeneities. According to this hypothesis there would be in the nebula pockets of cold very metal-rich plasma mixed with the gas or an extended high metallicity gas embedded in a less dense ambient gas with lower metallicity (Tsamis et al. 2003). The former idea was first suggested by Torres-Peimbert et al. (1990) and has been studied most extensively by Liu et al. (2006). Though, this idea lacks workable models that explain the origin of such chemical inhomogeneities. Henney & Stasińska (2010) tried to explain the presence of metal-rich droplets in PNe by destruction of solid bodies; however, they concluded that the amount of solid bodies needed to reproduce the observations was anomaly large.
In recent years, it has been found that a large fraction of all intermediate-mass stars, PNe progenitors are known to be in binary systems (Moe and De Marco 2006; Miszalski et al. 2009). Moreover, there is now mounting observational evidence that binary stars play a significant role in the PN ejection process. In particular, it seems like all PNe with extreme abundance discrepancy factors host short-period binary stars (Corradi et al. 2015; Wesson et al. 2017). Observational searches for close binaries demonstrate that these are virtually all found in bipolar PNe (Mastrodemos and Morris 1999; Miszalski et al. 2009). Though, because searches for binary stars are mostly limited to near edge-on systems with significant photometric variability it remains unproven whether all non-spherical PNe, which in fact are the large majority of PNe, are ejected from a star in a binary system. Surveys have found that between 10% and 20% of all PNe central stars are close binary systems, with periods typically shorter than 3 days (Jones et al. 2016).
Here we show that the periodically varying photoionizing radiation field of a short-period binary star will lead to resonant temperature fluctuations (RTF) in the orbital disk and these can propagate through the rest of the cloud as thermal waves that lead to radiative shocks. The mechanisms for this process are described in the next section. Further, Section 3 presents spectral diagnostics to determine the equilibrium and resonant temperature fluctuation amplitude from observed spectra.
2 Resonant Temperature Fluctuations (RTF)
In this section we present a theoretical model to explain RTF in PNe photoionized by binary stellar systems. To this end, we first look at the formation of resonant fluctuations along the orbital disk of the binary. Later, we study how these fluctuations may propagate perpendicularly to the disk to the rest of the nebula.
In order to have a semi-realistic model we look at the geometry of known close-binaries. UU Sagittae is the central eclipsing binary system of the planetary nebula Abell 63 (Bond et al. 1978). The total mass of the system is between 1 and 3 and the orbital separation is in the range of 2.5 - 3.6 . The effective temperatures of the stars are 35000 K for the primary and 4600 K for the secondary. This means that only the primary star is able to radiate UV ionizing photons and this flux is mostly shut off during the eclipse by the secondary star. The orbital period for this system is 0.465 days, with a total eclipse duration of about one tenth of the period. This also indicates that the thickness of the orbital disk is of about 15o.
2.1 Fluctuations in the orbital plane
Let us assume a stationary, inviscid and nonconducting medium in plane parallel symmetry. The equations of conservation of momentum and energy are
| (1) |
and
| (2) |
Here, is the velocity, is the total atomic number density, is the average mass per particle, is the pressure, is the internal energy per particle, is the heating-minus-cooling rate. For a perfect gas dominated by thermal pressure we have
| (3) |
and
| (4) |
where is the temperature and includes all forms of pressure other than thermal pressure. The factor of 2 in both relationships comes from the fact that in a plasma where hydrogen is mostly ionized the number density of particles in the plasma is about twice the density of atoms.
Let us introduce a small temperature perturbation and assume that the density is constant through the cloud and in time, so that
| (5) |
where is the steady state equilibrium temperature and is the time dependent perturbation. From equations (1) through (5) we have the temperature fluctuations equation
| (6) |
where, is the speed of sound.
In steady state conditions is identically zero for and Hence, this term will damp any temperature fluctuations in the nebula. On the other hand, if the nebular ionizing source varies with time so will the heating and cooling rates. Along the orbital disk of the binary system the ionizing flux will vary as the hotter star is periodically eclipsed by the cooler one.
For any ionizing binary system the heating-minus-cooling function for gas in the orbital disk will vary periodically and can always be represented by a combination of oscillation modes of the form
| (7) |

Figure 1 shows the results of a simulation for a binary star with occultation period of 3 days. For this simulation we pick a period of 3 days as representative of short-period binaries. As we will show here, shorter periods as in UU Sagittae, would lead to larger temperatures fluctuations. The top panel of Figure 1 depicts the normalized light curve of the ionizing source. The lower panels show the heating-minus-cooling function, , and its derivative versus time for four different depths within the cloud. For this model we assume an spectral energy distribution given by a black body at 50,000 K and an ionization parameter at the spectral maximum . The circumstellar nebula has a constant density cm-3 and a chemical mixture containing H, He, C, N, O, S, and Fe with solar abundances. We assume that the ionized nebula is radiation bound, which for the present ionization parameter would have an extension of cm up to the ionization front. For this nebula, is the dominant stage of oxygen in the range from cm to cm. Clearly, the qualitative results are the same for nebulae with different ionization parameters, densities, and compositions. The simulation was done with the time-dependent version of the photoionization modeling code XSTAR (Ahmed 2017; García et al. 2013; Kallman and Bautista 1999).
While the details (shape, occultation time, etc.) of the light curve of the ionizing source in this model (top panel of Figure 1) may differ from real sources, the qualitative behavior of the heating-minus-cooling function is always the same. Moreover, whatever the real light curve of the binary system is it can always be represented by a sum of modes of oscillation (Fourier components) and the heating-minus-cooling function will respond also in the form of a superposition of plane waves, as stated by Equation (7). Thus, our formalist is generally applicable.
The time-dependent simulations show phase shifts in the heating-cooling wave for different radii in the nebula. This shift is determined by the velocity of the radiation/heating fronts across the nebula, which is of the order (see García et al 2013). Thus, radiation/heating fronts are highly supersonic and that justifies our initial assumption that the gas density remains essentially constant despite the thermal waves.
An interesting observation from Fig. 1 is that variations in change with depth inside the nebula. While short duration eclipse events lead to pulse-like variations in near the illuminated side of the nebula, these become wider and decrease in amplitude with increasing depth. Moreover, deep enough in the nebula (beyond cm in the simulation of the amplitude of the simulation of Fig. 1) the variations blend with each other resulting in a sinusoidal function around the steady-state case.

Figure 2 plots the function vs. radius in the nebula. This is from the same simulation as in Figure 1. It can be seen that cooling tends to dominate over heating at large radii. This behavior results from the fact that in photoionized plasmas the electron temperature rises toward the ionization front, as the ionizing radiation field becomes harder. Now, a time variable ionizing radiation leads to an ionization parameter that fluctuates between maximum and minimum values. This in turn, tends to yield a double-peaked temperature profile in the nebula Thus, the overall thermal structure of the nebula will differ from that of the steady-state cloud (see Figure 2 lower panels). Notice that, while the new temperatures in this simulation are only a little lower than steady-state temperatures, this simulation does not take into account RTF.
Each mode of temperature oscillation in the nebula will satisfy the equation (6), thus let us consider one of these modes with
| (8) |
For this mode, Equation (6) has solution
| (9) |
Thus, thermal perturbations with are resonantly amplified.
The general solutions to Eqn. (6) is
| (10) |
This summation is dominated by the resonant models with . These are RTF driven by the variability of the ionizing source propagating through the nebula.
2.2 Propagation perpendicular to the disk
We have shown that RTF are expected to exist across the orbital disk of the binary system. The disk is expected to be only a few degrees wide. In this section we study how temperature fluctuation propagate vertically through the rest of the nebula. We argue that vertical propagation happens in two stages. First, thermal waves are powered by the RTF along the disk. Then, these waves lead to shocks that convert mechanical energy into thermal energy and travel through the nebula.
In the direction perpendicular to the orbital disk the linearized perturbation equations are
| (11) | |||
| (12) | |||
| (13) |
with the boundary condition
| (14) |
Figure 3 shows the heating-minus-cooling function as a function of temperature away from the equilibrium temperature. It can be seen that is roughly linear with the temperature perturbation . From this, we derive the approximate relation
| (15) |
with s-1 and is the temperature equilibration time ( days). This equation indicates that temperature fluctuations of the order of 1000 K will be effectively damped for oscillation periods longer than 8.9 days, and no resonant fluctuations should be expected. By contrast, short-period binaries have ionizing flux variations along the orbital disk that are too fast for effective radiative dissipation, thus these fluctuations may grow and propagate.

For temperature, density, and gas velocity perturbations of the form
| (16) | |||
| (17) | |||
| (18) |
the conservation equations lead to the dispersion relation
| (19) |
In absence of the heating-minus-cooling, , function (i.e. ) the dispersion relation is simply . Let us consider the case , i.e. fluctuations with periods significantly shorter than the equilibration time. In this case the wavenumber is
| (20) |
The temperature perturbation is now
| (21) |
with the attenuation length
| (22) |
Thus, the attenuation length is longer than the oscillation wavelength by a factor . In the case of a short period binary star with an occultation period of 3 days the attenuation length is nine times longer than the oscillation’s wavelength. In UU Sagittae the attenuation length is about 60 times longer than the perturbation’s wavelength.
A key assumption in the treatment above is that the sound speed is constant throughout the gas and equal to that of the unperturbed medium. In reality, as temperature oscillations form the hotter gas travels faster than the cooler gas ahead and overtakes it. Thus, it is inevitable that temperature oscillations of finite amplitude will steepen into shocks, which convert bulk kinetic energy into thermal energy. These are expected to be relatively weak shocks, with Mach numbers not greater than . They are also radiative shocks, with cooling times longer than the binary occultation period but shorter than the dissipation time scale for compression regions. Thus, denser gas ahead of the shock front cools down to a new equilibrium temperature such that . This new equilibrium temperature may be somewhat lower than that of the initial state.
Two important conclusions of this section are:
(1) The binary period is a key parameter in the propagation of temperature fluctuations perpendicular to the orbital disk. In this regard, the binary period needs to be significantly shorter than the gas thermalization time. Thus, only short period binary stars are expected to exhibit the temperature fluctuations described here.
(2) Temperature fluctuations that propagate through the nebula are likely to be accompanied by density fluctuations. At the shock fronts both temperature and density are expected to rise, while ahead of the shock fronts the denser gas may cool radiatively. Thus, we expect a complex structure of temperature and density fluctuations, possibly out of phase with each other. This point is demonstrated by spectroscopic observations, as discussed in the next section.
3 Spectral analysis
3.1 Diagnostics of equilibrium temperatures and RTF
We now turn our attention to the spectra of PNe. In particular, we look at temperature sensitive line ratios of collisionally excited [O III] and recombination O II lines. We consider three different line ratio temperature diagnostics:
: O II /O II . This ratio of two recombination lines was pointed out by Storey et al. (2017) for it is mainly temperature sensitive while mostly unaffected by density.
: O II /[O III] . This ratio of a recombination line and a collisional line is temperature sensitive, but mostly independent of density.
: [O III] /([O III] ). This is a classic temperature diagnostic ratio involving only collisionally excited lines.
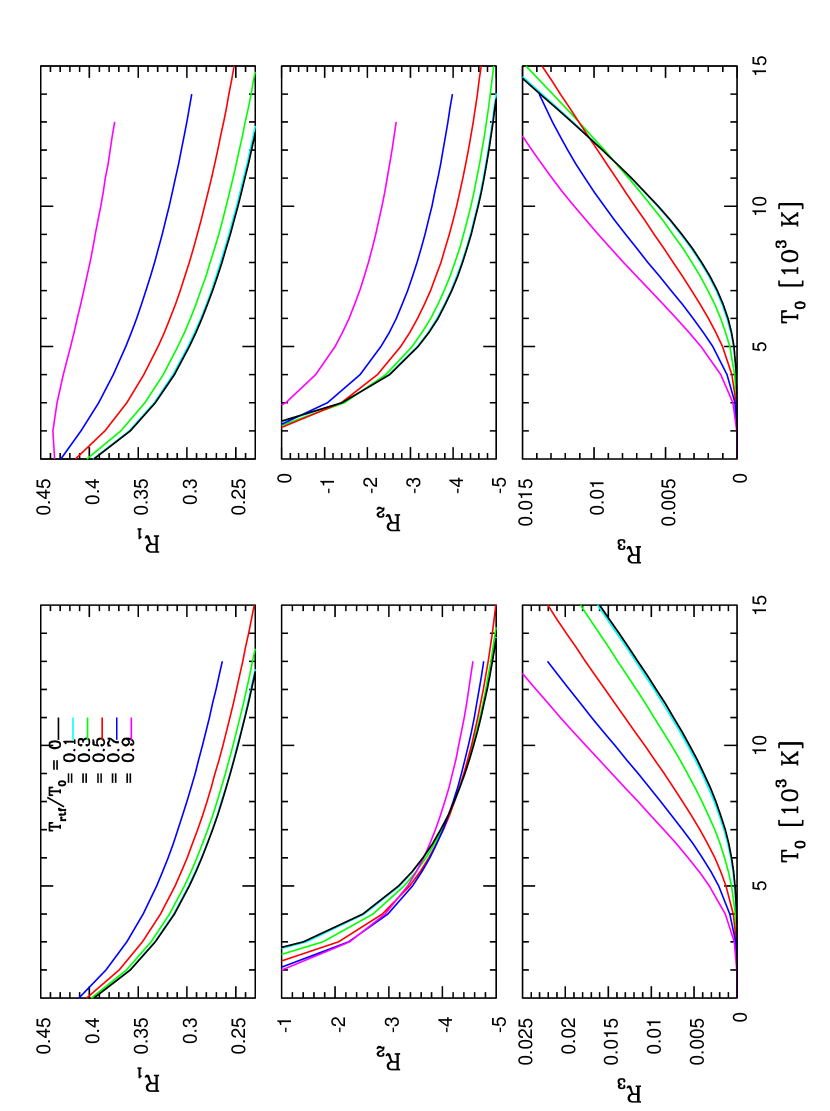
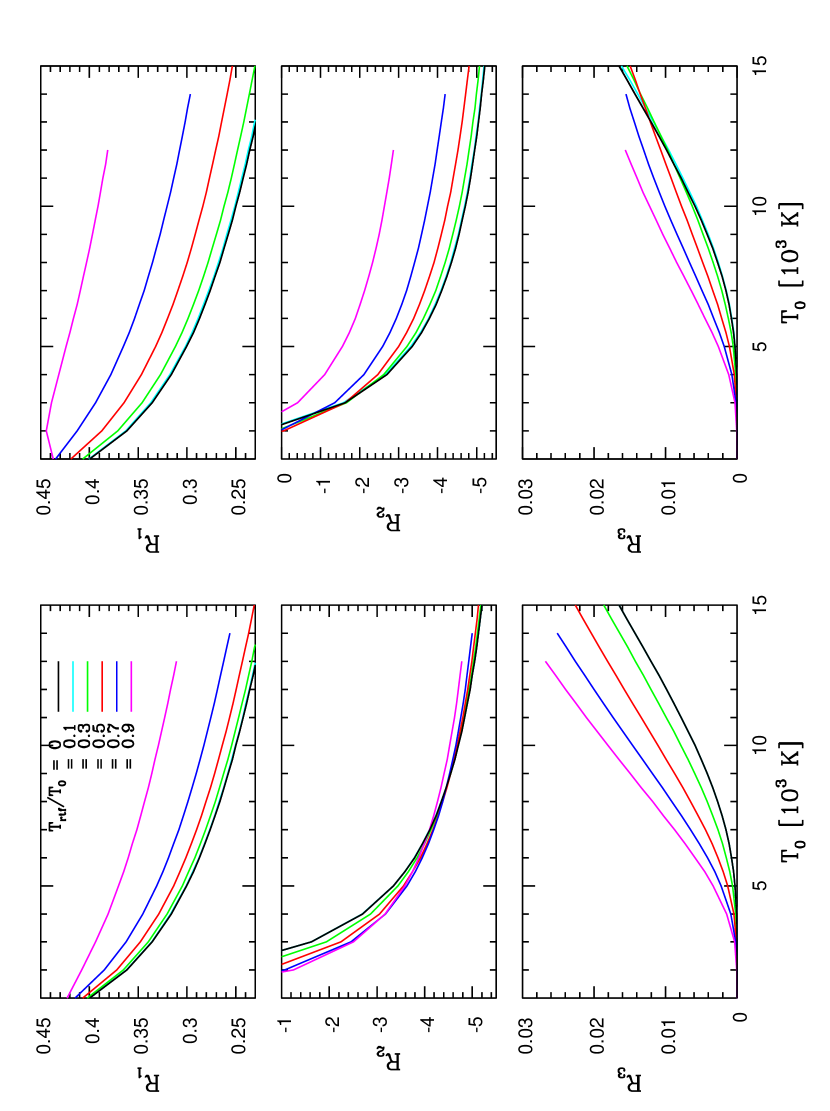
Figures 4 and 5 plot the line ratios vs. equilibrium temperature for various values of . In computing these line ratios, the emissivity of each line is averaged over a temperature fluctuation of the form
| (23) |
The ratios on the left-hand panels of the figures correspond to the case of temperature independent density. The plots in the right-hand panels correspond to the case
| (24) |
This depicts a case where temperature and density fluctuations evolve to a gas pressure equilibrium state. This seems to be the preferred state of the nebulae with extreme ADF analyzed below.
The line ratios in Figures 4 and 5 correspond to cm-3 and cm-3, respectively. In computing the line ratios, we use Case B line recombination emissivities from Storey et al. (2017) and electron impact collision strengths and A-values from Mendoza and Bautista (2014). In regards to observed spectra, we study the objects listed by Jones et al. (2016) and Wesson et al. (2018, private communication), which include the known PNe with the highest ADF and PNe with known close binary central stars. It is clear that the present analysis could explain essentially all nebulae with large or small ADF. Thus, we concentrate here on the objects with most extreme ADF, which have been difficult to explain by any previous model.
The ratio, which involves two recombination lines, is significantly enhanced by RTF. Thus, temperatures would be severely underestimated by this diagnostic line ratio if the effects of RTF were ignored. In this sense, PNe with very large ADF typically exhibit ratios around 0.35 or greater (see Table 1), which in absence of RTF would suggest unphysically low temperatures. By contrast, ratios, that involve collisionally excited lines, tend to severely overestimate the temperature when RTF are unaccounted for. PNe with very large ADFs typically show ratios of , which would indicate temperatures near 9000 K in absence of RTF, but the true equilibrium temperatures can be as low as 6000 K for .
The ratio, combining collisional and recombination lines, is the most sensitive to density fluctuations. When allowing for density variations to accompany RTF, this ratio varies by two orders of magnitude for different ratios. This is not the case in the constant density case. Most PNe studied here show mutually consistent , , and line ratios if RTF are taken into in the constant pressure scenario (Equation 24).
In Figure 6 we plot the and ratios versus the line ratio. These are calculated for several values from 0 to 0.9 and electron densities of 1000 cm-3 and 5000 cm-3. The left panels of this figure show the case of constant density and the right panels depict the temperature dependent density (i.e. constant gas pressure) case. In these figures we plot the measured line ratios for the objects listed in Table 1. We assume uncertainties of 10% for all line ratios.
In the vs. graphs two objects are found outside the range of the plots. These are A 58 and Fg 1 whose measured ratios are too large, possibly due to contamination by unresolved line blends. In addition, there are two objects within the range of the plots that do not conform to any predicted ratios. These are Hen 2–283, whose ratio is about three sigma above any theoretical curve, and HH 202 whose measured ratio is too low by about a factor of two. Of course, HH 202 in the Orion nebula, is not a PN
and how the present mechanism for RTF apply to H II regions is unclear (see discussion in Section 4). Nonetheless, HH 202 is the object in Table 1 with the smallest ADF, thus the fact that its measured ratio is smaller than for other objects is consistent with our predictions. However, we argue that the measure flux for the O II 4089.29 line by Mesa-Delgado et al. (2009) is underestimated. In terms of the ratio (involving collisionally excited lines), nearly all objects exhibit measured ratios below 0.011, which is indicative of equilibrium temperatures lower than 13,000 K. The only exception to this is A 30 with =0.018, which suggests that either the equilibrium temperature is unusually large ( 15,000 K) or the measured ratio is overestimated.
The vs. plots show that the objects with extreme ADF listed in Table 1 are generally consistent with between 0.7 and 0.9 and temperature dependent densities (constant gas pressure). By contrast, models that adopt constant electron densities generally underestimate the predicted ratios. Thus, it is suggested that temperature fluctuations are accompanied by density fluctuations in at least all nebulae with extreme large ADF, if not in most objects.
When looking at the vs. plots all objects in Table 1, without exception, are in the plot. These plots too show that most objects are consistent with temperature dependent density, rather than constant density. According to these ratios, all objects of Table 1 would have ranging from 0.3 to 0.9. Here, the objects with the smallest would be A 58, HH 202, and Hen 2–283. HH 202 and Hen 2–283 are the tabulated objects with the smallest reported ADF. On the other hand, A 58 has a large ADF, but the measured fluxes for the recombination lines appear rather uncertain.
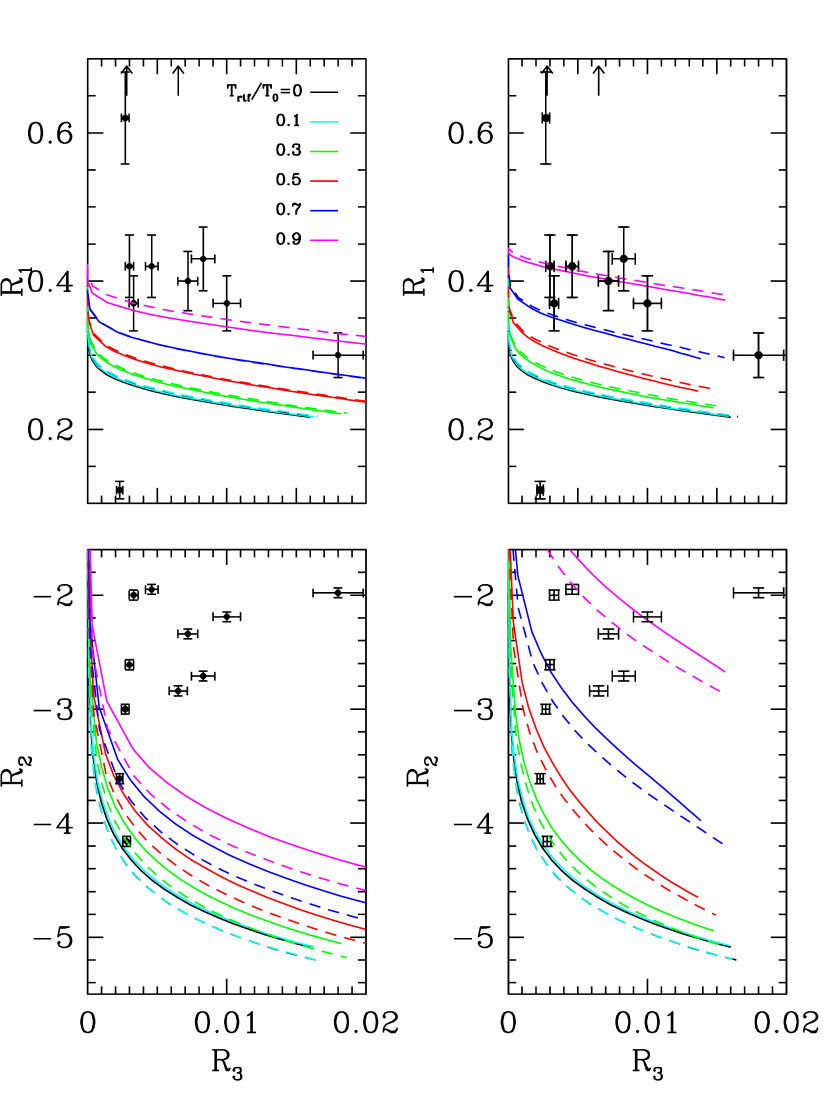
Table 1 presents the line ratios and our diagnosed values for equilibrium and RTF temperatures for objects listed in Jones et al. (2016) and Wesson et al. (2018, private communication). We note that some uncertainty exists in the line intensities measured in intermediate spectral resolution, due to unresolved line blends. For example, the ratio in Fg 1 is unexpectedly large, so we feel it may be affected by blends.
| Object | Period (d) | ADF | References | |||||
|---|---|---|---|---|---|---|---|---|
| A46 | 0.47 | 0.37 | -2.19 | 0.010 | 7500 | 0.9 | 120 | Corrady et al. (2015) |
| Hf 2–2 | 0.40 | 0.37 | -2.00 | 3.3e-3 | 6500 | 0.8 | 70 | Liu et al. (2006); Schaub et al. (2012) |
| Hf 2–2 | 0.40 | 0.42 | -1.95 | 4.6e-3 | 6500 | 0.9 | Wesson et al. (2018) | |
| Ou 5 | 0.36 | 0.42 | -2.61 | 3.0e-3 | 5500 | 0.91 | 18 | Jones et al. (2016) |
| A30 | N/A | 0.30 | -1.98 | 0.018 | 10,000 | 0.951 | 100 | Wesson et al. (2003) |
| A58 | N/A | 1.072 | -4.16 | 2.8e-3 | 6500 | 0.6 | 89 | Wesson et al. (2008) |
| HH 202 | N/A | 0.118 | -3.61 | 2.3e-3 | 7000 | 0.4 | 2.2 | Mesa-Delgado et al. (2009) |
| Fg 1 | N/A | 1.362 | -2.84 | 6.5e-3 | 6500 | 0.91 | 80 | Wesson et al. (2018) |
| Hen 2–283 | N/A | 0.62 | -3.00 | 2.7e-3 | 6500 | 0.6 | 5 | Wesson et al. (2018) |
| MPA 1759 | N/A | 0.40 | -2.34 | 7.2e-3 | 8500 | 0.8 | 70 | Wesson et al. (2018) |
| NGC 6337 | N/A | 0.43 | -2.71 | 8.3e-3 | 9000 | 0.8 | 40 | Wesson et al. (2018) |
Note. — N/A = Not a confirmed binary.
Note. — 1 More consistent with temperature independent density.
Note. — 2 This ratio seems unusually large. It may require additional measurements
3.2 Computing ionic abundances
Nebulae with RTF cannot be characterized by a single electron temperature value, as this may lead to erroneous ionic abundances from collisional and recombination lines. Instead, one needs to determine equilibrium temperature , magnitude of RTF (), and the nature of the density structure (constant or temperature-dependent). When taking these factors into account the resulting abundances from collisional and recombination lines will be into agreement with each other, thus resolving the long lasting ADF problem.
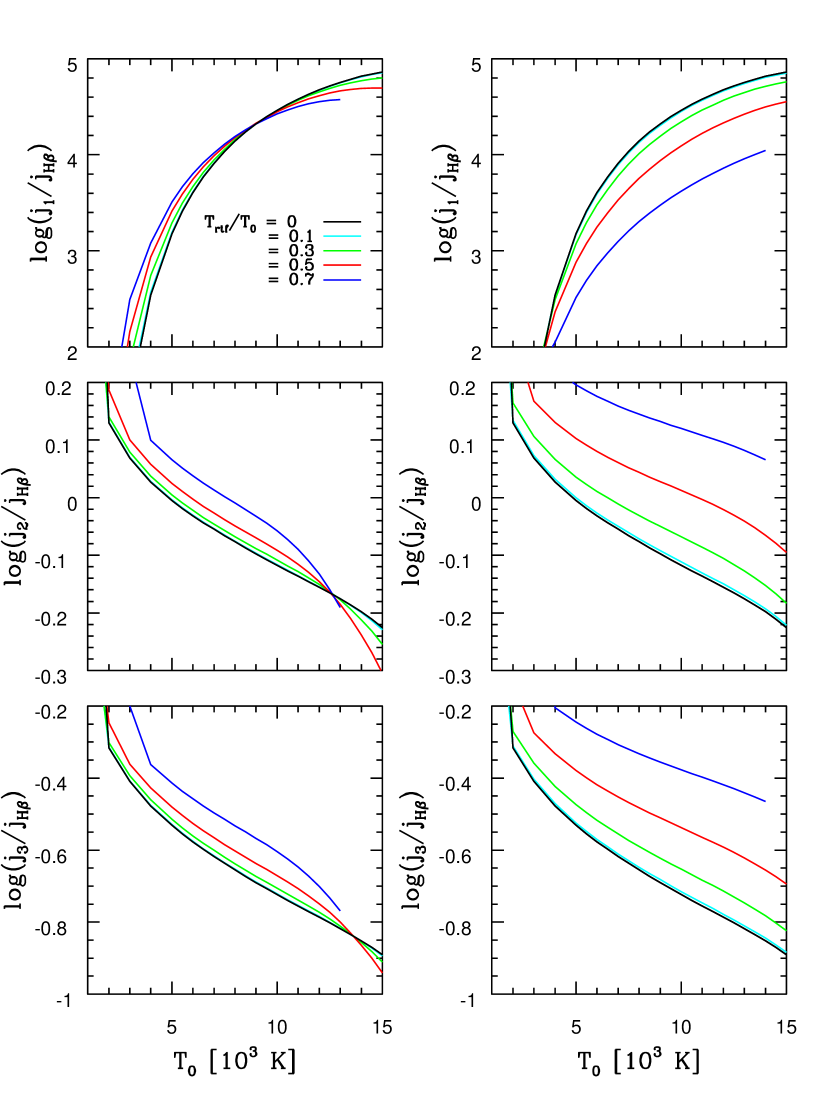
Figure 7 shows the emissivities of [O III] , O II , and O II relative to H. The emissivities are shown for constant density and temperature-dependent density.
Figure 7 shows that the emissivity of recombination lines relative to H is much less sensitive to the equilibrium temperature than collisional lines. While the former varies by about a factor of two between 5000 and 12,000 K, collisional lines change by at least one order of magnitude in the same range of equilibrium temperatures. When the plasma density is constant the equilibrium temperature is the most important parameter by far, as the relative emissivities of collisional and recombination lines are nearly insensitive to (). By contrast, under temperature-dependent densities, which seem to prevail in objects with large ADF, the relative line emissivities are significantly affected by (). The effects amount to about up to a factor of two between ()=0 and ()=0.7 for recombination lines and about a factor of five for the collisional lines.
Despite the relatively small effects of () on the line emissivities with respect to H, the effect of this parameter on abundance determinations must not be underestimated. Neither recombination nor collisional lines can give reliable abundances in absence of and . Though, if these temperature conditions are known both recombination and collisional lines will, in principle, give the same correct ionic abundance. The one remaining source of uncertainty may come from the density structure (constant density vs. constant pressure conditions). In cases where the density structure remained unknown recombination lines should be used in abundance determination.
As an example of how O++ abundances are affected by our analysis we look at the abundances of Hf 2–2. Liu et al. (2006) found that collisionally excited [O III] lines are consistent with a temperature of roughly 9000 K and from this the O++/H+ fraction is about . By contrast, they find recombination lines consistent with a temperature of 900 K and a O++/H+ fraction of . When taking RTF into account, a quick analysis of the spectrum gives and temperature-dependent density, and from this O++/H.
After determining abundances of the ions present in the spectra one needs to account for ions with no observable signatures. Thus, one needs to estimate ionization corrections either by photoionization modeling or empirical spectroscopic methods. Either way, this can be accomplice with reasonable accuracy if the equilibrium temperature is known and the abundance of the ions with observable spectral lines is well constrained. The present approach provides, for the first time, a way to do such determinations.
4 Discussion and Conclusions
We show that resonant temperature fluctuations, with amplitudes up to 90% of the equilibrium temperature, are expected to form in PNe photoionized by short-period-binary stars. Such systems yield a periodically varying ionizing radiation field along the orbital disk, which induces periodic oscillations in the heating-minus-cooling function. As a result, temperature perturbations in the disk with frequencies similar to those of the ionizing source will undergo resonant amplification. Further, the temperature fluctuations in the disk cause thermal waves and shocks that propagate to the rest of the nebulae.
Further, our study shows that the amplitude of the RTF depends critically on the occultation period of the binary star. Only short-period binaries, with period of few days, can sustain significant RTF.
How the present mechanism for RTF applies to H II regions remains to be studied. On the one hand, H II regions are ionized by one of more young massive stars, which are believed to have a large binarity fraction. Many of these binary systems could be close binaries, see for instance S 106 (Comerón et al 2018). On the other hand, if the secondary star is much smaller than the primary it would lead to a very small and thin ecliptic disk, possibly unable to originate sustainable RTF.
We present diagnostic line ratios that combine [O III] collisional lines and O II recombination lines. These ratios can be used to estimate the equilibrium temperature and RTF in the O2+ region. Similar diagnostics can be created using different ions that also produce observable collisional and recombination lines in the nebular spectrum. This will be the subject of future publications.
When applying these diagnostics to PNe with extremely large ADF and known binary central stars we find that they are characterized by equilibrium temperatures, , between 5500 K and 10,000 K and between 0.6 and 0.9. Most of these objects also show density fluctuations out of phase with the RTF.
By determining and one can then estimate the abundance fractions of different ions relative to hydrogen. These estimate should reflect the true chemical composition of the nebula by removing the long standing discrepancies between collisional and recombination lines.
References
- Abt (1983) Abt, H.A. 1983, Ann. Rev. Astron. Astrophys. 21, 343
- Ahmed (2017) ElHoussieny, E.E. 2017, Ph.D. Dissertation, Western Michigan University
- Bautista (2004) Bautista, M.A., Fivet, V., Quinet, P. Dunn, J., Gull, T.R, et al. 2013, ApJ 770, 15
- BondEt al. (1978) Bind, H.E., Liller, W., Mannery, E.J., 1978, ApJ 223, 252
- Comerón et al. (2018) Comerón, F. Schneider, N., Djupvik, A.A., Schnugg, C., 2018, A&A 615, A2
- Corradiet al. (2015) Corradi, R.L.M., García-Rojas, J., Jones, D., Rodríguez-Gil, P. 2015, ApJ 803, 99 ElHoussieny, E.E. 2017, Ph.D. Dissertation, Western Michigan University
- Ferlandet al. (2016) Ferland, G.J., Henney, W.J., O’Dell, C.R., Peimbert, M. 2016, Revista Mexicana de Astron. y Astrofis. 52, 261
- Garcíaet al. (2013) García, J., Elhoussieny, E.E., Bautista, M.A., Kallman, T.R. 2013, ApJ 775, 8
- García-Rojas & Esteban (2007) García-Rojas, J., Esteban, C. 2007, ApJ 670, 457
- Garnett & Dinerstein (2001) Garnett, D.R., Dinerstein, H.L. 2001, ApJ 558, 145
- Henney & Stasinska (2010) Henney, W.J., Stasińska, G. 2010, ApJ 711, 881
- Joneset al. (2016) Jones. D., Wesson, R., García-Rojas, J., Corradi, L.M., Boffin, H.M.J. 2016, MNRAS 455, 3263
- Kallman and Bautista (2001) Kallman, T. and Bautista, M. 2001, ApJS 133, 221
- Kingdon and Ferland (1995) Kingdon, J.B. & Ferland, G.J. 1995, ApJ 450 691
- Krabe and Copetti (2002) Krabbe, A.C. & Copetti, M.V.F., 2002, A&A 387, 295
- Krabe and Copetti (2005) Krabbe, A.C. & Copetti, M.V.F., 2005, A&A 443, 981
- Liuet al. (2000) Liu, X.-W., Storey, P.J., Barlow, M.J., Danzinger, I.J., Cohen, M., Bryce, M. 2000, MNRAS 312, 585
- Liuet al. (2004) Liu, Y, Liu, X.-W., Barlow, M.J., Luo, S.-G. 2004, MNRAS 353, 1251L
- Liuet al. (2001) Liu, X.-W., Lou, S.-G., Barlow, M.J., Danzinger, I.J, Storey, P.J. 2001, MNRAS 327, 141
- Liuet al. (2000) Liu, X.-W., Storey, P.J., Barlow, M.J., Danzinger, I.J., Cohen, M., Bryce, M. 2000, MNRAS 312, 585
- Mastrodemos & Morris (1999) Mastrodemos, N. and Morris, M. 1999, ApJ 523, 357
- McNabbet al. (2016) McNabb, I.A., Fang, X., Liu, X.-W. 2016, MNRAS 461, 2818
- Mendoza & Bautista (2014) Mendoza, C. and Bautista, M.A. 2014, ApJ 785, 91
- Miszalskiet al. (2009) Miszalski, B, Acker, A., Parker, Q.A., Moffat, A.F.J. 2009, A&A 505, 249
- Moe & Marco (2009) Moe, M. & De Marco, O. 2006, ApJ 650, 916
- O’Dellet al. (2013) O’Dell, C.R., Ferland, G.J., Henney, W.J., Peimbert, M. 2013, Astron. J 145, 93
- O’Dellet al. (2003) O’Dell, C.R., Peimbert, M., Peimbert, A. 2003, AJ 125, 2590
- Peimbert (1967) Peimbert, M. 1967, ApJ 150, 825
- RubinEt al. (2002) Rubin, R.H., Bhatt, N.J., Dufiur, R.J., Buckalew, B.A., Barlow, M.J., et al. 2002, MNRAS 334, 777
- RubinEt al. (2003) Rubin, R.H., Martin, P.G., Dufour, R.J., Ferland, G.J., Blagrave, K.P.M., et al. 2003, MNRAS 340, 362
- Storeyet al. (2017) Storey, P.J., Sochi, T., Bastin, R., 2017, MNRAS 470, 379
- Torres-Peimbertet al. (1980) Torres-Peimbert, S., Peimbert, M., Daltabuit, E. 1980, ApJ 238, 133
- Torres-Peimbertet al. (1990) Torres-Peimbert, S., Peimbert, M., Pena, M. 1990, A&A 233, 540
- Tsamiset al. (2003) Tsamis, Y.G. Barlow, M.J., Liu, X.-W., Danzinger, I.J., Storey, P.J. 2003, MNRAS 345, 186
- Tsamiset al. (2003) Tsamis, Y.G. & Pequignot, D. 2005, MNRAS 364, 687
- Wessonet al. (2017) Wesson, R.; Jones, D.; García-Rojas, J.; Corradi, R. L. M.; Boffin, H. M. J. 2017, in ’Planetary Nebulae: Multi-Wavelength Probes of Stellar and Galactic Evolution’, IAU Symposium 323, 70
- Wesson & Liu (2004) Wesson, R., Liu, X.-W. 2004, MNRAS 351, 1026
- Wessonet al. (2003) Wesson, R., Liu, X.-W., Barlow, M.J. 2003, MNRAS 340, 253