Photometric and spectroscopic observations of the neglected near-contact binary Cl* Melotte 111 AV 1224111Based upon observations acquired at: Observatorio Astronómico Nacional in the Sierra San Pedro Mártir (OAN-SPM), Baja California, México and Xing Long Station in China.
Abstract
This paper presents a photometric and spectroscopic study of the short-period binary star Cl* Melotte 111 AV 1224. Measurements in the , , and passbands obtained during three observing runs between 2014 and 2017 and medium-resolution spectra secured in 2014, are analyzed together with public data from the SuperWASP and LAMOST projects. Our light curves show marked asymmetry with a variable O’Connell effect. The SuperWASP photometry is used to derive a mean binary period of 0.345225 days. The analysis of the diagram reveals that the orbital period is decreasing at a rate of days yr-1, which may be caused by mass transfer from the more-massive component to the less-massive one. The system is found to be a single-lined spectroscopic binary with a systemic velocity, Km s-1, and a semi-amplitude, K1 = 21 5 Km s-1. The spectral classification and the effective temperature of the primary component are estimated to be K0V 1 and K, respectively. The photometric and spectroscopic solutions reveal that Cl* Melotte 111 AV 1224 is a low-mass ratio (), low-inclination () near-contact system. The masses, radii and luminosity for the primary and secondary are estimated to be , , and , , , respectively. The marginal contact, together with the period decrease, suggests that this binary system may be at a key evolutionary stage, as predicted by the theory of thermal relaxation oscillations.
1 Introduction
Near-contact binaries (NCBs) are a important source in understanding the formation and evolution of the binary systems, as they are assumed to be lying in a key evolutionary stage. They have been defined by Shaw (1990) as a subclass of close binaries in which both components fill, or nearly fill, their critical Roche lobe and are near enough to each other as to have strong proximity effects like those of W UMa type systems without being in contact.
NCBs have periods of less than a day, display strong tidal interaction, and show EB-type variations. Such systems may be the evolutionary precursors to the A-type W UMa systems, and are probably in the early stages of mass transfer. Indeed, some NCBs exhibit asymmetric light curves and orbital period decrease caused probably by mass transfer or/and by angular momentum loss via magnetic braking. As the period decreases, the separation between both components will be reduced, and the system will evolve into an A-type overcontact binary. Therefore, it is suggested that the NCBs could be the missing link between detached binaries and W UMa systems. There is a considerable number of newly discovered near-contact systems brighter than 12 mag since the early work by Shaw (1990), which are divided into two subclasses: V1010 Ophiuchi systems and FO Virginis binaries. The study of fainter NCBs ( mag) is challenging, but also important, because they may provide new insights into underlying mechanisms of the mass transfer in close binaries.
| Photometric Observations | Spectroscopic Observations | |||||||
| UT Date | Start Time | End Time | Filter | OAN-SPM | XL | Start Time | Number of spectra | Exp. Time |
| (HJD 2454900+) | (HJD 2454900+) | (hr) | (hr) | (HJD 2454900+) | (sec) | |||
| 2014 April 05 | 1853.00 | 1853.34 | - | 8.1 | - | - | - | |
| 2014 April 06 | 1854.00 | 1854.34 | - | 8.3 | - | - | - | |
| 2014 April 08 | 1855.63 | 1856.01 | 9.2 | - | 1855.70 | 6 | 1800 | |
| 2014 April 09 | 1856.63 | 1857.25 | 7.6 | 7.6 | 1856.70 | 8 | 1800 | |
| 2014 April 10 | 1857.90 | 1857.99 | 2.3 | - | 1857.90 | 4 | 1800 | |
| 2016 April 15 | 2593.75 | 2594.00 | 7.9 | - | - | - | - | |
| 2016 April 17 | 2595.64 | 2595.86 | 5.3 | - | - | - | - | |
| 2016 April 18 | 2596.67 | 5597.00 | 7.6 | - | - | - | - | |
| 2016 April 20 | 2598.68 | 2598.98 | 7.3 | - | - | - | - | |
| 2017 March 28 | 2940.64 | 2940.93 | 6.9 | - | - | - | - | |
| 2017 April 13 | 2956.64 | 2967.00 | 8.7 | - | - | - | - | |
In this paper, we present a detailed analysis of Cl* Melotte 111 AV 1224222Star designation in the Simbad astronomical database. AV 1224 refers to the star running number in the astrometric catalog by Abad & Vicente (1999). (GSC 01989-00964, 2MASS J12214222+2500569, and AV1224 hereater ) –a NCB candidate target ( mag) identified as a short-period eclipsing binary by Fox-Machado et al. (2015). The light curves in the band show Lyrae type variations and a remarkable O’Connell effect. Because the preliminary photometric solutions reported by Fox-Machado et al. (2015) were unable to discriminate between overcontact and semi-detached configurations, we have conducted follow-up spectroscopic and photometric optical observations of AV1224 to shed more light on its nature. We incorporated publicly available SuperWASP and LAMOST data into our study. The absolute physical parameters of the components are derived, and the evolutionary status of this rare binary system is discussed.
2 Observations
Table 1 provides relevant information about our photometric and spectroscopic observations. CCD photometric data were collected at the Observatorio Astronómico Nacional at San Pedro Mártir (OAN-SPM hereafter), in Baja California, Mexico. In 2014, additional photometry was obtained at Xinglong Station of the National Astronomical Observatories of China (XL hereafter). At OAN-SPM observatory, we used the same procedures as described in Fox-Machado et al. (2015). Briefly, the CCD images were acquired with the 0.84 m f/15 Ritchey-Chrétien telescope. The telescope hosted the ‘Mexman’ filter wheel and a Marconi (E2V) CCD camera, which has a 2048 2048 pixels array, with a pixel size of 13.5 13.5 m2. The gain and readout noise of this CCD camera are 1.8 e-/ADU and 4.7 e-, respectively. The field of view in this configuration is about 8′ 8′ arcmin2 with the scale of 0′′.22/pixel with binning factor . At XL, we used the 0.85-m telescope with a PI TE CCD camera mounted on the primary focus of the telescope. The effective field of view is arcmin2. In all seasons, the observations were made in the , , and -bands with exposure times normally set at 80 s, 40 s, and 30 s, respectively, depending on the weather conditions. Sky flats, dark and bias exposures were also taken regularly.
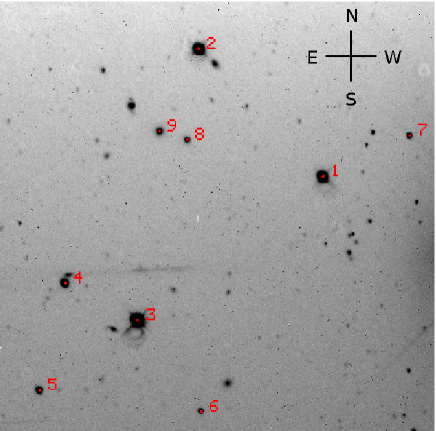
The images were reduced in the standard way, using the IRAF333Image Reduction and Analysis Facility package. The reduction process included overscan correction, bias subtraction, and flat field correction. The cleaning of cosmic rays was made with the external task lacos (van Dokkum, 2001). The instrumental magnitudes of the stars were computed using the aperture photometry method implemented in the IRAF/DAOPHOT package. Figure 1 shows a typical image taken with the 0.84 m telescope of the OAN-SPM observatory. For stars labeled with digits 1 through 9 the Table 2 provides the star names, positions, and our own standard photometry measurements. To determine the relative magnitudes (and colors) of the stars, the field was measured during a photometric night along with some Landolt standards at different airmasses. Transformation equations were calculated and the resulting magnitudes are shown in Table 2. Differential photometry was made with respect to Cl* Melotte 111 AV 1236 which is comparable in brightness and color to the target star. Cl* Melotte 111 AV 1248 was used as check star. They are labeled with numbers 2 and 3 in Figure 1 respectively. No evidence of periodic variation among the comparison and check stars was found. The light curves were inspected, and those high-dispersed data points due to clouds and bad weather conditions were removed. A total of 18 spectra of AV1224 were acquired over three nights in 2014 on the 2.12 m telescope at OAN-SPM observatory. The spectra were obtained with the Boller & Chivens spectrograph installed in the Cassegrain focus of the telescope. A 1200 grooves mm-1 grating and a 13.5 m 20482048 pixel E2V Marconi CCD camera to cover a wavelength range from 4400 Å to 6700 Å, were used in the observations. The typical spectral resolution of the recorded spectra is 1.8 Å. The data reduction was made with the standard long-slit routines of the IRAF package after applying bias subtraction. The cleaning of cosmic rays was made with the external task lacos (van Dokkum, 2001). The wavelength calibration was made using a CuHeNeAr arc lamp before and after every object spectra. The spectra were flux calibrated using spectrophotometric standard stars observed in the same night.
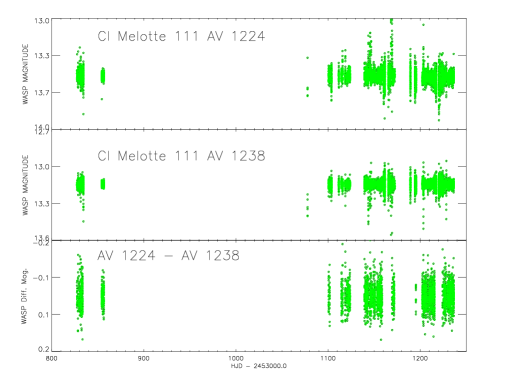
The SuperWASP light curves of AV1224 and Cl* Melottte 111 AV 1238 stars are displayed in the upper and middle panels of Figure 2, respectively. They comprise 6300 measurements taken between 2004 May and 2008 May. The stars are rather faint and, due to the small aperture telescopes employed by the SuperWASP project, they exhibit relatively large scatter444SuperWASP photometry achieves a precision of better than 1% for objects with magnitudes . For this reason, the star was neglected for further study. Although our data have better precision, the SuperWASP timeseries covering a much longer time span are well suited for period determination purposes. To reduce light-curve scatter, we excluded the data points with errors greater than 0.08 mag as given by SuperWASP project. Then, we computed the difference in magnitudes between AV1224 with respect to Cl* Melotte 111 AV 1236. The resulting differential light curves, which contain 2950 measurements (see lower panel of Fig. 2), are used to estimate the period of the binary star.
| Star ID | RA | DEC | |||||
|---|---|---|---|---|---|---|---|
| J2000.0 | J2000.0 | (mag) | (mag) | (mag) | (mag) | (mag) | |
| 1-AV1224 | 185.425923 | 25.015790 | |||||
| 2-Cl* Melotte 111 AV 1236 | 185.467183 | 25.054349 | |||||
| 3-Cl* Melotte 111 AV 1248 | 185.487535 | 24.972642 | |||||
| 4-2MASSJ122202832459016 | 185.511714 | 24.983695 | |||||
| 5-2MASSJ122204842457053 | 185.520269 | 24.951456 | |||||
| 6-2MASSJ122151922456417 | 185.466526 | 24.945096 | |||||
| 7-2MASSJ122135242501411 | 185.396903 | 25.028115 | |||||
| 8-2MASSJ122153072501365 | 185.471147 | 25.026827 | … | ||||
| 9-2MASSJ122155252501460 | 185.480268 | 25.029474 |
3 Data analysis
3.1 Spectroscopic Analysis
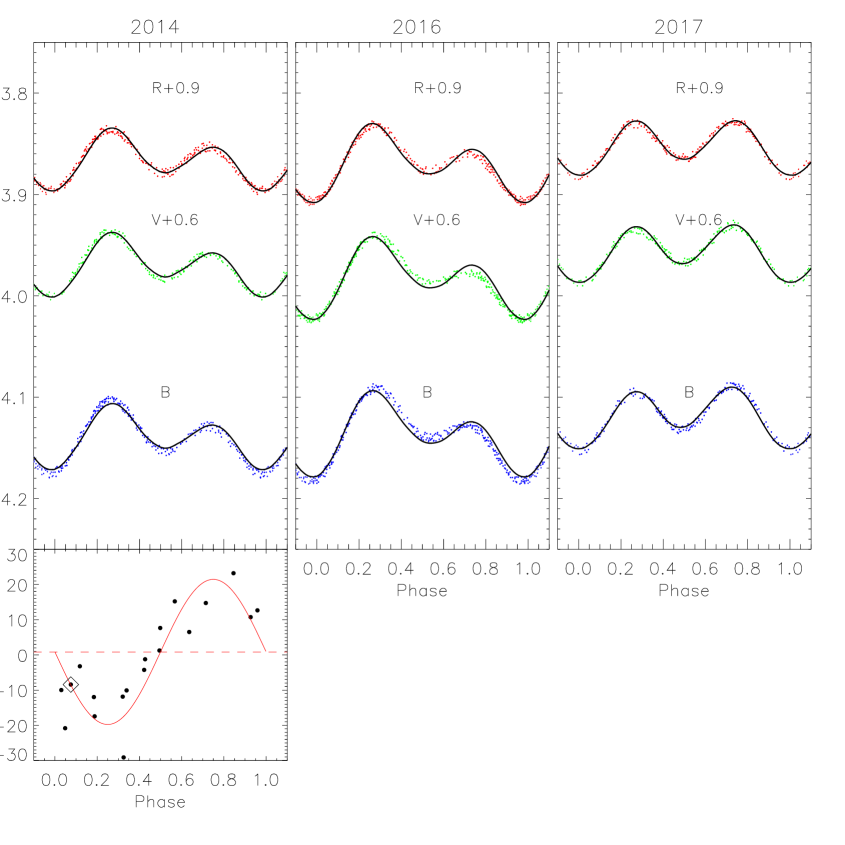
The radial velocities were measured with the IRAF task fxcor, by cross-correlating the spectra against the spectra of radial-velocity standard stars HD 38230 (Udry, Mayor, & Queloz, 1999) and HD 132734 (Stefanik, Latham, & Torres, 1999). The whole spectral ranges were used in the cross-correlation process. The weighted mean values of radial velocities, with the uncertainties obtained with fxcor, are given in Table 3. No signs of the secondary spectrum have been detected. The radial velocity curve, which is related to the more-massive component, folded with the photometric period is shown in Figure 8 (the bottom panel of the first column). The radial-velocity light curve shows that the massive component is moving toward us and the less-massive one, not seen, is moving away from us after the primary eclipse at phase 0.0. Therefore, the more-massive star is eclipsed at primary minimum and it is the hotter component. We used the RVFIT555http://www.cefca.es/people/riglesias/rvfit.html IDL code (Iglesias-Marzoa et al., 2015) to fit a Keplerian orbit to the data. The best fit is shown by continuous lines in the bottom panel of first column of Fig. 8. We obtained = 1 3 Km s-1 and K1 = 21 5 Km s-1. The LAMOST database lists for AV1224 a radial velocity of 8.42 Km s-2 taken at HJD 2455966.31812. This single radial-velocity value, which is shown with a rhombus in Figure 8, is in good agreement with our measurements.
We have derived a spectral classification by comparing a phase 0.5 program spectrum with those spectra of MILES library (Sánchez-Blázquez et al., 2006), suitably smoothed to our resolution, following the procedure explained by Baran et al. (2011). We assigned a K0V 1 spectral type. On the other hand, the 2MASS photometry of AV1224 gives , and (Skrutskie, et al., 2006). Using the simplified equations of Koen et al. (2007), the 2MASS indices and can be transformed into , in the SAAO system. According to the calibrations of spectral types on SAAO near-infrared indices by Bessell & Brett (1988), these infrared photometric indices imply spectral types G6V-K0V.
A grid of synthetic spectra was computed with the iSpec666https://www.blancocuaresma.com/s/iSpec code (Blanco-Cuarezma, et al., 2014) and then cross-correlated to a phase 0.5 target spectrum. The best matching template had a temperature of 5200 150 K and cm s-2. These values are in agreement with the parameters of AV1224 listed by the LAMOST team. The LAMOST spectra are automatically analyzed by instrument-specific software to determine fundamental parameters of the star. For AV1224, the pipeline suggests K, cm s-2 .
3.2 Period Analysis and Determination of Ephemeris
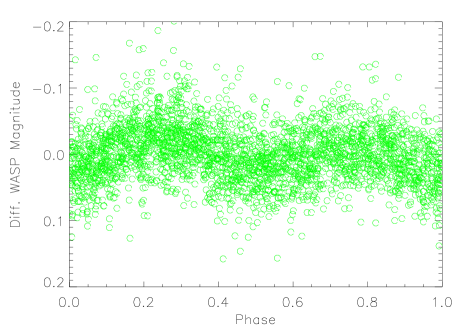
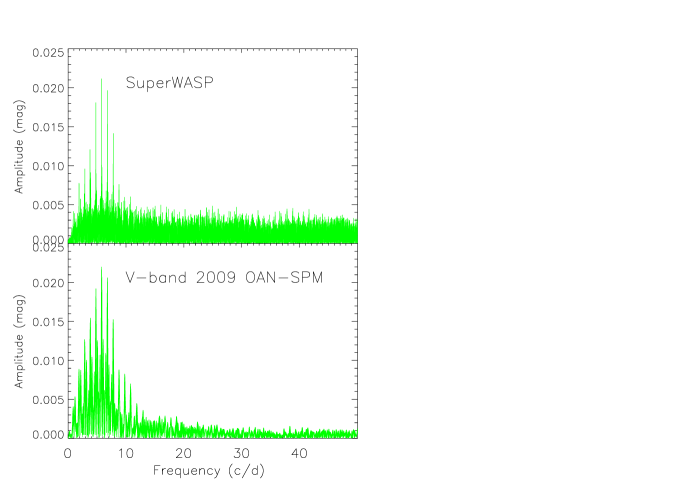
The Period04 package (Lenz & Breger, 2005) was employed to compute the period of the binary system based on the SuperWASP differential timeseries obtained according to the steps described in the previous section. The eclipsing binary light curves can be represented by two sine waves with frequencies c/d and c/d. Multiplying the period by 2 gives the appropriate orbital period of the binary system as . The periodogram of the SuperWASP timeseries is shown in the upper panel of Figure 4. As a comparison, the periodogram of the 2009 -band observations reported by Fox-Machado et al. (2015) is depicted in the lower panel. The SuperWASP data folded at period are displayed in Figure 3.
Seven eclipses of AV1224, including four primary eclipses and three secondary ones, were recorded during our observations. The epochs of these light minima were determined via the method described by Kwee & van Woerden (1956) and the mean values of , and filters are listed in Table 4. Using these data and the times of minima reported by Fox-Machado et al. (2015), we derived the following revised linear and quadratic ephemeris for the binary system by applying the least-squares method:
| (1) |
| (2) |
Equation (2) implies that the orbital period of the AV1224 decreases secularly at a rate of days yr-1. However, due to the small number of minimum times, a cyclic period variation cannot be ruled out. The diagram is plotted in Figure 6. The SuperWASP data were not used in the O-C analysis because, due to their much large scatter, the times of minimum could not be determined.
| HJD | Phase | RV |
|---|---|---|
| (Km s-1) | ||
| 2456755.73313 | 0.31 | -11.9 24.7 |
| 2456755.76568 | 0.42 | -4.3 21.3 |
| 2456755.78889 | 0.49 | 1.3 16.6 |
| 2456755.83411 | 0.63 | 6.5 13.1 |
| 2456755.90133 | 0.84 | 23.2 9.6 |
| 2456755.92735 | 0.92 | 10.7 10.3 |
| 2456756.70119 | 0.34 | -10.1 27.3 |
| 2456756.72935 | 0.43 | -1.2 17.4 |
| 2456756.75229 | 0.50 | 7.7 12.8 |
| 2456756.77439 | 0.56 | 15.2 14.3 |
| 2456756.82153 | 0.71 | 14.7 11.4 |
| 2456756.89992 | 0.96 | 12.7 13.9 |
| 2456756.9228 | 0.03 | -10.0 14.3 |
| 2456756.97229 | 0.19 | -12.0 12.2 |
| 2456757.89086 | 0.06 | -20.8 16.7 |
| 2456757.91319 | 0.13 | -3.2 18.7 |
| 2456757.93563 | 0.20 | -17.5 17.2 |
| 2456757.97966 | 0.33 | -29.12 10.6 |
| HJD | Minimum Type | Filter |
|---|---|---|
| I | ||
| II | ||
| I | ||
| II | ||
| I | ||
| II | ||
| I |
| HJD | HJD | HJD | |||
| (mag) | (mag) | (mag) | |||
| 2456752.99733 | 14.1574 | 2456752.99904 | 13.3747 | 2456753.00007 | 12.9802 |
| 2456753.00163 | 14.1558 | 2456753.00765 | 13.3777 | 2456753.00437 | 12.9736 |
| 2456753.01212 | 14.1565 | 2456753.01384 | 13.3754 | 2456753.00868 | 12.9804 |
| 2456753.01785 | 14.1570 | 2456753.02009 | 13.3822 | 2456753.01486 | 12.9673 |
| 2456753.02355 | 14.1517 | 2456753.02579 | 13.3754 | 2456753.02147 | 12.9676 |
| 2456753.02925 | 14.1484 | 2456753.03149 | 13.3718 | 2456753.02716 | 12.9647 |
| Note:Table 5 is published in its entirely in the electronic edition of the PASP. | |||||
| A portion is shown here for guidance regarding its form and content. | |||||

| 2014 | 2014 | 2014 | 2016 | 2016 | 2016 | 2017 | 2017 | 2017 | |
|---|---|---|---|---|---|---|---|---|---|
| Min I (mag) | 14.175 | 13.400 | 12.996 | 14.182 | 13.424 | 13.007 | 14.153 | 13.389 | 12.982 |
| Min II (mag) | 14.153 | 13.383 | 12.978 | 14.139 | 13.387 | 12.975 | 14.132 | 13.368 | 12.965 |
| Max I (mag) | 14.103 | 13.338 | 12.936 | 14.092 | 13.341 | 12.932 | 14.096 | 13.335 | 12.930 |
| Max II (mag) | 14.128 | 13.359 | 12.954 | 14.128 | 13.377 | 12.961 | 14.089 | 13.331 | 12.928 |
| Min I - Min II (mag) | 0.022 | 0.017 | 0.018 | 0.043 | 0.037 | 0.032 | 0.021 | 0.021 | 0.017 |
| Max II - Max I (mag) | 0.025 | 0.021 | 0.018 | 0.036 | 0.036 | 0.029 | 0.007 | 0.004 | 0.002 |
| Min I - Max I (mag) | 0.072 | 0.062 | 0.060 | 0.090 | 0.080 | 0.075 | 0.057 | 0.054 | 0.052 |
| Min II - Max II (mag) | 0.025 | 0.024 | 0.024 | 0.011 | 0.010 | 0.014 | 0.046 | 0.037 | 0.037 |
3.3 The Asymmetry and Variations of the Light Curves
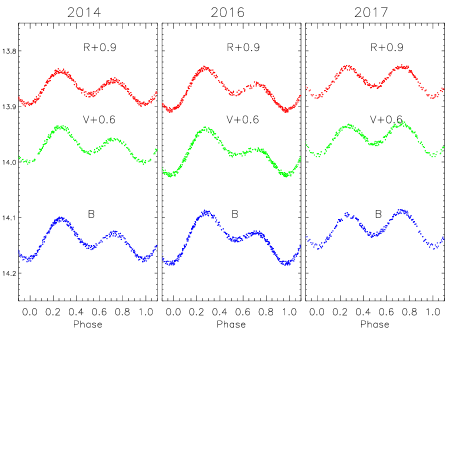
The phased , , and light curves folded using Equation (1) for AV1224 are shown in Figure 5. The light curves are plotted in terms of their relative magnitudes based on the reference star Cl* Melotte 111 AV 1236. A total of 2674 individual observations in three bands (i.e., 897 in , 895 in , and 882 in ) are tabulated in Table 5 in the form of HJD time versus magnitude.
It can be seen that the maxima, the minima, and the general shape of the light curves changed over seasons. In particular, dramatic changes occur around Max II (at 0.75 phase). In Table 6 we list, for each color band, the magnitudes of the maxima and minima; the depths of the primary and the secondary eclipses (Min I - Max I and Min II - Max II); the magnitude difference between depths of primary and secondary minima (Min I - Min II); and the magnitude of the difference between the amplitude of the secondary and the primary maxima (Max II - Max I). From Table 6 and from Figure 5, it follows that in 2014 the light curves showed a positive O’Connell effect with the Max I brighter than the Max II by 0.025, 0.021, 0.018 mag in the , and bands respectively. Two years later in 2016, the O’Connell effect was still positive but as the Max I in 2016 becomes brighter than Max I in 2014 and Max II in 2016 becomes fainter than the Max II in 2014, the amplitude of the Max II - Max I in 2016 grew higher by 0.036, 0.036 and 0.029 in the , , and bands respectively. In 2017, the situation switched, and the light curves showed a negative O’Connell effect. Asymmetries in the light curves seem to be a common feature in contact or near-contact binaries [e.g. RZ Com (Qian & He, 2005), V523 Cas (Zhang & Zhang, 2004), TY Boo (Chirstopoulou, et al., 2012), V1104 (Liu et al., 2005), HH UMa (Wang, et al., 2015)]. The light-curve asymmetries are usually related to changes in the surface distribution of star spots, the flip-flop mechanisms and the mass transfer between the components.
3.4 Binary modeling
The modeling procedure was, in some aspects, similar to the procedures described in Fox-Machado et al. (2015). We used the stable build of the PHOEBE (PHysics of Eclipsing Binaries) modeling software (Prša & Zwitter, 2005, version 0.31a), which is a graphical front-end interface to the Wilson-Devinney code (Wilson & Devinney, 1971). Before running PHOEBE, the light curves were premodeled with Binary Maker 3.0777www.binarymaker.com (Bradstreet & Steelman, 2002), and the obtained fits in all filter bands were input into a , , and simultaneous modeling using PHOEBE.
The marked asymmetry and obvious variations of the light curves discussed in the previous section strongly suggest the presence of surface spots, some degree of contact, and mass transfer between components. Moreover, the differences in minima are moderate suggesting either semi-detached or shallow contact configurations with the primary component filling its Roche lobe. Therefore, both ”overcontact” and ”semi-detached” modes were considered.
We assumed a few fixed parameters during the fitting process: the period of the system was fixed to days. The temperature of the primary star, defined as the hotter star producing the deeper eclipse at phase zero, was set to K based on spectroscopic observations discussed in Sect. 3.1. The bolometric albedos (Ruciński, 1969) and the gravity-darkening coefficients (Lucy, 1967) appropriate for convective envelopes, were utilized. The logarithmic limb-darkening law is used with coefficients adopted from tables by van Hamme (1993) for a solar composition star.
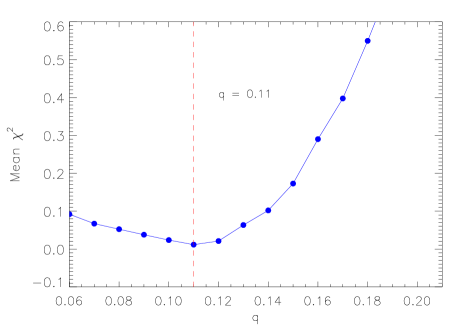
We started by modeling the light curves obtained in 2014. As it is impossible to measure component’s masses in a non-eclipsing, single-lined spectroscopic binary like AV1224, a -search method was applied to determine an initial mass ratio following Ren et al. (2017). Trial solutions of unspotted models with different -values ranging from 0.05 to 0.25 were obtained. The adjustable parameters were: the orbital inclination, , the temperature of star 2, ; the monochromatic luminosities of stars, , and ; and the dimensionless potential of each star, and ( for overcontact configuration). For each mass ratio we ran PHOEBE differential corrections in mode “Overcontact binary of the W UMa type ” and then switched the calculations into mode “Semi-detached binary, primary star fills Roche lobe”. A set of convergent numerical solutions corresponding to each assumed mass ratio was computed after many iterations of the adjustable parameters. The relation between the mean and the assumed is described with solid circles in Figure 7. It can be seen that the resulting mean value of the convergent solutions reached its minimum for . We then set this initial value of and treated it as a free parameter along with the other adjustable parameters.
The spot parameters were roughly determined with PHOEBE by adjusting the synthetic light curves to fit approximately the observational data. Once we had a set of approximate solutions, we ran the PHOEBE differential corrections algorithm to perform the minimization for the input values applying the corrections to the parameter table. This was repeated several times until the lowest was obtained. As a result, we found a best-fit binary model yielding a set of geometrical system parameters that simultaneously fit the light curves in the three passbands. In the same way, we synthesized the light curves obtained in 2016 and 2017.
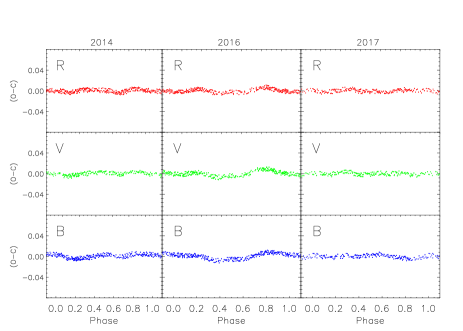
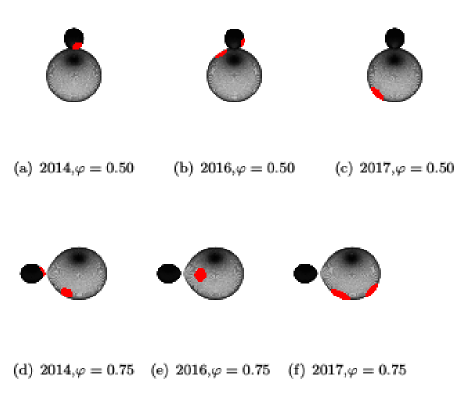
From our analysis in overcontact mode, we concluded that all models either converged to semi-detached region or they were unrealistic from the evolutionary points of view, with a too small and a component temperature difference of 400 K, somewhat large for an overcontact binary. Moreover the overcontact solutions always yielded a small negative fill-out factor value. Therefore, the overcontact solutions were ruled out. The parameters of the best solutions, which correspond to a semi-detached configuration, are listed in Table 7. The errors for each parameter where determined with the phoebe-scripter, following Bonanos (2009). The theoretical light curves (solid lines) of each year along with observations (symbols) are displayed in Figure 8. The corresponding residuals are plotted in Figure 9. The geometrical structures at phases 0.50 and 0.75 corresponding to the light curves solutions are plotted in Figure 10.
As shown in Section 3.1, the radial-velocity data model yields a systemic velocity = 1 3 Km s-1 and a semi-amplitude of K1 = 21 5 Km s-1. Combining the photometric solutions with the spectroscopic results, the absolute parameters of mass, radius, and luminosity for each component of the system were derived and are listed in Table 8. Based on Kepler’s third law, , and the relative radius formula , and luminosity , the errors of these parameters are calculated by the error propagation method.
| Parameters | 2014 | 2016 | 2017 |
|---|---|---|---|
| Mass ratio | |||
| (K) | 5200a | 5200a | 5200a |
| (K) | |||
| (deg) | |||
| Spot1 parameters (primary star) | |||
| Colatitude (deg) | |||
| Longitude (deg) | |||
| Radius (deg) | |||
| Spot2 parameters (primary star) | |||
| Colatitude (deg) | |||
| Longitude (deg) | |||
| Radius (deg) | |||
| Spot parameters (secondary star) | |||
| Colatitude (deg) | |||
| Longitude (deg) | |||
| Radius (deg) | |||
| 0.23 | 0.28 | 0.22 |
4 Discussions and Conclusions
We have presented follow-up photometric and spectroscopic observations of the short-period binary AV1224. The photometric solutions were derived for three sets of multi-color light curves: , and obtained in 2014, 2016, and 2017 years. The results indicate that AV1224 is a near-contact binary with both the primary and the secondary almost filling their Roche lobes, and therefore is a marginal contact NCB system.
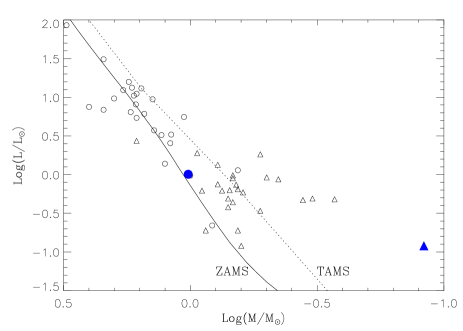
The spectroscopic solutions suggest that AV1224 is a single-lined spectroscopic binary, in which the primary component, partially eclipsed at phase 0.0, is hotter than less-massive companion by 500 K. A single radial-velocity measurement reported by the LAMOST team is in good agreement with our measurements. The photometric light curves show remarkable asymmetries and variations from one year to another, suggesting that the system is strongly active. The three sets of photometric solutions consider spots to account for the variations observed in the light curves. Combining photometric and spectroscopic solutions, we have derived the parameters listed in Table 8. The positions of both components are shown with filled symbols in the mass-luminosity diagram of Figure 11, where open circles and triangles represent, respectively, the primaries and the secondaries of NCBs from Yakut & Eggleton (2015). The solid and dotted lines refer, respectively, to the zero-age main sequence (ZAMS) and the terminal-age main sequence (TAMS), which were constructed by the binary stars evolution (BSE) code (Hurley, 2002). It is found that the primary component of AV1224 is near the ZAMS line, in agreement with our spectral classification. Meanwhile, the less-massive component lies above the TAMS line.
A possible secular decrease in its orbital period has been found from a few times of minima over eight years time interval. From the quadratic term of the Equation (2), it follows that the orbital period may be decreasing with a rate of days yr-1 or 0.3 s yr-1. Such a rapid period decrease has been noticed before in others NCBs (e.g., Lohr et al., 2012, or Table 5 of paper by Zhu et al., 2009). With the orbital period decrease, the primary component transfer mass to the secondary one, the mass ratio increases and eventually the NCB systems evolve into the contact phase. Period decrease might be caused by mass or angular momentum loss (AML) due to magnetic stellar wind (magnetic breaking) and/or mass transfer from the more to the less-massive component.
According to the formula given by Bradstreet & Guinan (1994):
| (3) |
Using , , and from Table 8, and gyration constant , the theoretical AML is estimated to be days yr-1. This suggests that magnetic breaking is not the main cause of period decrease.
The mass transfer from to or the mass loss from the system can be evaluated using the equations given by Hilditch (2001):
| (4) |
| (5) |
for conservative and non-conservative mass loss, respectively. and are the orbital period and its change rate, is the distance from the binary centre of mass to the Lagrange point, . Calculating the necessary values of to explain the observed , we obtain for AV1224 yr-1 and yr-1 for conservative and non-conservative mass transfer, respectively. The timescale of the conservative mass transfer can be estimated to be approximately yr. On the other hand, the thermal timescale of the massive component can be estimated as yr (Hilditch, 2001), which is longer than the conservative mass-transfer duration. This suggests that the primary component cannot stay in thermal equilibrium and the mass transfer in AV1224 is unstable. Possible mechanisms for unstable mass transfer leading to rapid period decrease in contact or NCB systems are discussed in Rasio (1995) and Jiang et al. (2012).
| Parameter | Primary | Secondary |
|---|---|---|
| Mass ) | ||
| Radius ) | ||
| Luminosity ) |
An independent estimation of the distance to AV1224 can be obtained from the empirical relation by Gettel et al. (2006):
| (6) |
assuming , the distance is estimated to be 387 pc which is in agreement with the distance estimated from Strömgren photometry by Fox-Machado et al. (2015), and is consistent with the fact that AV1224 is not a cluster member of Melotte 111 ( 87 pc). As it is known, Melotte 111 open cluster presents an apparent deficit of low mass stars, in particular K-dwarfs (e.g. García-López et al., 2000; Randich et al., 1996; Terrien, et al., 2014).
Our analysis indicates that AV1224 could be in a very important evolution phase of the thermal relaxation oscillation theory (TRO theory; e.g. Lucy, 1967; Flannery, 1976; Robertson & Eggleton, 1977; Lucy & Wilson, 1979). According to TRO, contact systems must undergo oscillations around the state of marginal contact as a result of being unable to achieve thermal equilibrium. They oscillate periodically between a contact and a near-contact phase and alternately show EW and EB light curves. Thus, each oscillation comprises a contact phase followed by a semi-detached phase. When a system lies on a near-contact phase and keeps expanding, the contact configuration will break and the system will reach the semi-detached phase with a more-massive component filling its Roche lobe.
We note that our high-precision photometric observations were limited to a few nights every year. While the complete photometric light curve are presented, long-time continuous observations with additional precision timings of minimum light are still necessary to offer more information on this system.
This work has received financial support from the Universidad Nacional Autónoma de México (UNAM) under grant PAPIIT IN100918. J.N.F. acknowledges the support from the National Natural Science Foundation of China (NSFC) through the grant 11673003 and the National Basic Research Program of China (973 Program 2014CB845700 and 2013CB834900). Based upon observations carried out at the Observatorio Astronómico Nacional on the Sierra San Pedro Mártir (OAN-SPM), Baja California, México, and Xinglong Station of the National Astronomical Observatories of Chinese Academy of Science. Special thanks are given to the technical staff and night assistants of the San Pedro Mártir Observatory and Xinglong Station. L.F.M. would like to thank Profs. X.B. Zhang and J.N. Fu for their hospitality during his visit to the National Astronomical Observatory of China (NAOC) and Beijing Normal University (BNU). T.Q.C. and C.Q.L. would like to thank Drs. L. Fox-Machado and R. Michel for their support during a work visit in Mexico at Insituto de Astronomía, Campus Ensenada. This research has made use of the SIMBAD database operated at CDS, Strasbourg (France).
Facilities: OAN-SPM 0.84 m (MEXMAN), 2.12 m (Boller & Chivens) XL 0.85 m
References
- Abad & Vicente (1999) Abad, C., & Vicente, B. 1999, A&AS, 136, 307
- Baran et al. (2011) Baran, A.S., Fox-Machado, L., Lykke, J., Nielsen, M., & Telting, J.H. 2011, Acta Astron., 61, 325
- Barden (1985) Barden, S.C. 1985, ApJ, 295, 162
- Bessell & Brett (1988) Bessell, M. S. & Brett, J. M. 1988, PASP, 100 1134
- Blanco-Cuarezma, et al. (2014) Blanco-Cuarezma, S., Soubiran, C., Heiter, U, & Jofré , P. 2014 A&A, 560. A111
- Bradstreet & Guinan (1994) Bradstreet, D.H. & Guinan, E.F. 1994, in ASP Conf. Ser. 56, Interacting Binaries, ed. A.W. Shafter, (San Francisco, CA:ASP), 228
- Bradstreet & Steelman (2002) Bradstreet, D.H. & Steelman, D.P. 2002, BAAS, 34, 1224
- Bonanos (2009) Bonanos, A.Z. 2009, ApJ, 691, 407
- Chirstopoulou, et al. (2012) Christopoulou, P.-E., Papageorgiou, A., Vasileiadis, T., & Tsantilas, S. 2012, AJ, 144, 149
- Flannery (1976) Flannery, B.P. 1976, ApJ, 205, 217
- Fox-Machado et al. (2015) Fox-Machado, L., Michel, R., Alvarez, M., & Peña, J. H. 2015, New A, 34, 187
- García-López et al. (2000) García López, R. J., Randich, S., Zapatero Osorio, M. R.,& Pallavicini, R. 2000, A&A, 363, 958
- Gettel et al. (2006) Gettel, S.J., Geske, M.T., McKay, T.A. 2006, AJ, 131, 621
- Hilditch (2001) Hilditch, R.W. 2001, An Introduction to Close Binary Stars (Cambridge, UK: Combridge University Press)
- Hurley (2002) Hurley, J.R., Tout, C.A., & Pols, O.R. 2002, MNRAS, 329, 897
- Iglesias-Marzoa et al. (2015) Iglesias-Marzoa, R., López-Morales M. & Arévalo-Morales, M.J. 2015, PASP, 127, 567
- Jiang et al. (2012) Jiang, D., Han, Z., Ge, H., Yang, L., & Li., L. 2012, MNRAS, 421, 2769
- Kwee & van Woerden (1956) Kwee, K. K., and van Woerden, H. 1956, Bull. Astron. Inst. Netherlands, 12, 327
- Koen et al. (2007) Koen, C., Marang, F., Kilkenny, D., & Jacobs, C. 2007, MNRAS, 380, 1433
- Lenz & Breger (2005) Lenz, P.,& Breger, M. 2005, CoAst, 146, 53
- Liu et al. (2005) Liu, N.-P., Qian, S.-B., Soonthornthum, B., et al. 2015, AJ, 149, 148
- Lohr et al. (2012) Lohr, M.E., Norton, A.J., Kolb, U.C., et al. 2012, A&A, 542, A124
- Lucy (1976) Lucy, L.B. 1976, ApJ, 205, 208
- Lucy & Wilson (1979) Lucy, L.B., & Wilson, R.E. 1979, ApJ, 231, 502
- Lucy (1967) Lucy, L. B. 1967, Z. Astrophys., 65, 89
- Lucy & Wilson (1979) Lucy, L. B., & Wilson, R. E. 1979, ApJ, 231, 502
- O’Connel (1951) O’Connel, D.J.K. 1951, Publications of the Riverview College Observatory, 2, 85
- Pauzen & Vanmunster (2016) Paunzen, E., & Vanmunster, T. 2016, AN, 337, 239
- Prša & Zwitter (2005) Prša, A., & Zwitter, T. 2005, ApJ, 628, 426
- Ren et al. (2017) Ren, A.B., Fu, J.N., Zhang, X.B., et al. 2017, AJ, 153, 248
- Rasio (1995) Rasio, F.A. 1995, ApJ, 444, L41
- Robertson & Eggleton (1977) Robertson, J.A., & Eggleton, P.P. 1979, MNRAS, 179, 359
- Ruciński (1969) Ruciński, S.M. 1969, Acta Astron., 19, 245
- Randich et al. (1996) Randich, S., Schmitt, J. H. M. M., & Prosser, C. 1996, A&A, 313, 815
- Qian & He (2005) Qian, S.-B., He, J.J. 2005, PASJ, 57, 977
- Sánchez-Blázquez et al. (2006) Sánchez-Blázquez, P., Peletier, R. F., Jiménez-Vicente, J., et al. 2006, MNRAS, 371, 703
- Shaw (1990) Shaw, J.S. 1990, in: Proc. NATO Adv. Study Inst. on Active Close Binaries, ed. C. Ibanoglu (Dordrecht: Kluwer), 241
- Skrutskie, et al. (2006) Skrutskie, M. F., Cutri, R. M., Stiening, R, et al. 2006, AJ, 131, 1163
- Stefanik, Latham, & Torres (1999) Stefanik, R. P., Latham, D. W., & Torres, G. 1999, in ASP Conf. Ser. 185, Precise Stellar Radial Velocities, eds. J. B. Hearnshaw & C. D. Scarfe. (San Francisco, CA:ASP), 354
- Terrien, et al. (2014) Terrien, R. C., Mahadevan, S., Deshpande, R., et al. 2014, ApJ, 782, 61
- Udry, Mayor, & Queloz (1999) Udry, S., Mayor, M. & Queloz, D. 1999, in ASP Conf. Ser. 185, Precise Stellar Radial Velocities, eds. J. B. Hearnshaw & C. D. Scarfe (San Francisco, CA: ASP), 367
- van Dokkum (2001) van Dokkum, P.G. 2001, PASP, 113, 1420
- van Hamme (1993) van Hamme, W. 1993, AJ, 106, 2096
- Wang, et al. (2015) Wang, K., Zhang, X.B., Deng, L., et al. 2015, ApJ, 805, 22
- Wilson & Devinney (1971) Wilson, R.E. & Devinney, E.J. 1971, ApJ, 166, 605
- Yakut & Eggleton (2015) Yakut, K. & Eggleton, P.P. 2005, ApJ, 629, 1055
- Zhang & Zhang (2004) Zhang, X.B., Zhang, R.X. 2004, MNRAS, 347, 307
- Zhu et al. (2009) Zhu, L.Y., Qian, S.B., Zola, S., & Kreiner, J.M. 2009, AJ, 137, 3574