An early-type galaxy with an inner star-forming disk
Abstract
Early-type galaxies (ETGs) are composed of two distinct populations: high-mass and low-mass, which are likely to be built via gas-poor merging and gas-rich merging/accretion, respectively. However, it is difficult to directly associate low-mass ETGs with gas-rich processes, because currently they are gas poor with no signs of ongoing star formation. We report a discovery of an ETG (SDSS J142055.01+400715.7) with =1010 M⊙ that offers direct evidence for gas-rich merging as the origin of low-mass ETGs. The integrated properties of the galaxy are consistent with a typical low-mass ETG, but the outer and inner regions show distinct dispersion- and rotation-dominated kinematics, respectively. There are some tidal features surrounding the galaxy. These two facts suggest very recent galaxy merging. Furthermore, the inner disk harbors on-going star formation, indicating the merging to be gas rich. This type of galaxy is rare but it may be a demonstration of the role the transient phase of gas-rich merging plays in making a low-mass ETG.
keywords:
galaxies: elliptical and lenticular, cD - galaxies: star formation - galaxies: individual: SDSS J142055.01+400715.71 Introduction
The Hubble sequence of galaxies as first proposed by Hubble (1926, 1936) divides galaxies into two types: late-type and early-type galaxies (ETGs), characterised by whether or not they contain spiral features. ETGs are traditionally classified into ellipticals and S0s depending on the presence of a disk, but the photometric analysis of galaxies’ isophotes suggests that some ellipticals can still contain weak disk components (Bender et al., 1989), while inclination effects can lead to the mis-classification of some S0s as ellipticals (Jorgensen & Franx, 1994).
Among ETGs, high-mass ( 1011 M⊙, -21.5) and low-mass galaxies are found to be two distinct galaxy populations. Massive ETGs always have boxy and triaxial isophotal shapes while low-mass ones are disky (Kormendy, 1999; Kormendy et al., 2009) and axisymmetric (Cappellari et al., 2013a). In terms of the radial profile of the optical light, massive ETGs have relatively large Sérsic indices at the outer radius ( Krajnović et al., 2013a) but show a deficit at the inner radius, known as the core. On the other hand, low-mass ETGs show relatively small Sérsic indices at the outer radius ( Krajnović et al. (2013a)), and are core-less with either a power-law inner profile or even extra nuclear light (Kormendy, 1999). Observations further indicate that some central components have younger stellar populations than the rest of the galaxies (Lauer et al., 2005; McDermid et al., 2006).
With integral field unit (IFU) spectroscopic observations such as the SAURON survey (de Zeeuw et al., 2002) and ATLAS3D project (Cappellari et al., 2011a), it is possible to classify ETGs according to their 2D kinematic properties. For example, Krajnović et al. (2006, 2011) found that ETGs can be separated into “regular rotators” with a regular velocity field and “non-regular rotators” dominated by random motion, associated with high-mass and low-mass ETGs, respectively. Emsellem et al. (2007) used the apparent angular momentum parameter to separate ETGs and found that massive ETGs rotate slowly (slow rotators) and low-mass ellipticals rotate faster (fast rotators). Cappellari et al. (2011a, b) argued that fast rotators form a smooth parallel sequence to spiral galaxies on the luminosity/mass vs. size plane.
It is suspected that the cores of massive ETGs form through dissipationless dry mergers in which supermassive black holes sink into the galaxy center to eject stars and form a nuclear core (Kormendy et al., 2009; Cappellari, 2016; Krajnović et al., 2013b), while extra nuclear light in low-mass ETGs is produced by gas-rich merging or accretion, in which a nuclear starburst is triggered. However, all ETGs, remnants of both gas-poor and gas-rich merging, lack on-going star formation since even in the case of gas-rich merging the gas has been dispelled or consumed, ceasing star formation. This makes it difficult to directly associate a low-mass ETG with gas-rich processes. In the MaNGA project (Mapping Nearby Galaxies at Apache Point Observatory ), we identified an ETG SDSS J142055.01+400715.7 (RA=14h20m55.014s & DEC=+40d07m15.70s), which may be a living example that gas-rich merging is playing a major role in forming a low-mass ETG with extra nuclear light.
In section 2 we briefly introduce the MaNGA project, the characteristics of the galaxy we focus on and the methodology. In section 3 we list the physical properties of this galaxy. Followed the discussion in section 4, the summary and conclusion is in section 5.
2 Data and Methodology
MaNGA (Bundy et al., 2015; Law et al., 2015) is a part of Sloan Digital Sky Survey IV (SDSS-IV) (Blanton et al., 2017). This survey has started in July of 2014 on the 2.5m telescope at Apa he Point Observatory (APO) (Gunn et al., 2006). Its aim is to investigate the internal kinematic structure and composition of gas and stars in an unprecedented sample of 10,000 nearby galaxies in the redshift range 0.01z0.15 through IFU spectroscopic observations (Wake et al., 2017). The MaNGA instrument consists a set of 17 hexagonal fiber bundle integral field units that vary in diameter from 12 arcsec (19 fibers) to 32 arcsec (127 fibers), with 12 7-fiber “mini-bundles” for spectrophotometric calibration and 92 single fibers for sky subtraction (Drory et al., 2015; Yan et al., 2016a). All fibers are fed into the dual beam BOSS spectrographs, covering a wavelength range from 3600Å to 10300Å with spectral resolution R2000 (Smee et al., 2013). The raw data were reduced though data reduction pipeline described in Law et al. (2016).
The SDSS J142055.01+400715.7 is located at z=0.01754, being a member of the primary sample with the coverage out to 1.5 (Yan et al., 2016b). The FWHM of the reconstructed PSF of our data cube is 2.4 arcsec, corresponding to a physical scale of 0.86 kpc. We have performed the following measurements:
IRAF Ellipse fitting: We used the “Ellipse” procedure in IRAF111The IRAF homepage is here: http://iraf.noao.edu. to obtain the 1-D profiles of the galaxy in , and bands. The contamination of companion galaxies and foreground stars in the field were removed automatically. We then fitted the profiles with two Sérsic models (Sérsic, 1968). To take the point spread function (PSF) effect into account and get the intrinsic Sérsic indices, we simplified the PSF as a single Gaussian function and convolved it with two Sérsic models, then used this convolved model to fit these 1-D profiles.
diagram: Emsellem et al. (2007) proposed a simple parameter to trace the stellar angular momentum of a galaxy. For the IFU data, the is given by
| (1) |
where , and are the circular radius, stellar velocity and stellar velocity dispersion, respectively. The measurement is flux weighted and summed within the effective radius. A large corresponds to a fast rotator while a small indicates a slow rotator. By comparing the with the apparent ellipticity , Emsellem et al. (2011) proposed an empirical diagnostic to distinguish fast and slow rotators. We measured the of this galaxy based on the MaNGA data analysis pipeline (DAP; Westfall et al. in preparation) maps.
KINEMETRY: In order to quantify whether the galaxy can be classified as a regular rotator or a non-regular rotator, Krajnović et al. (2006) proposed KINEMETRY222The IDL KINEMETRY routine can be found on http://davor.krajnovic.org/idl. with truncated Fourier expansion to fit the velocity fields of a galaxy with the IFU data. Here we employed KINEMETRY to investigate the different kinematic properties varied with radius.
3 Result
3.1 The global galaxy properties
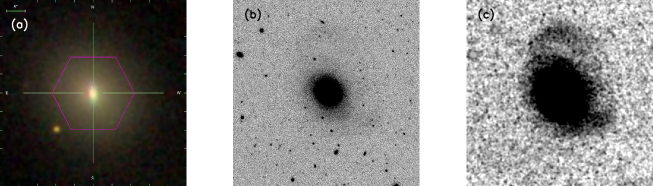
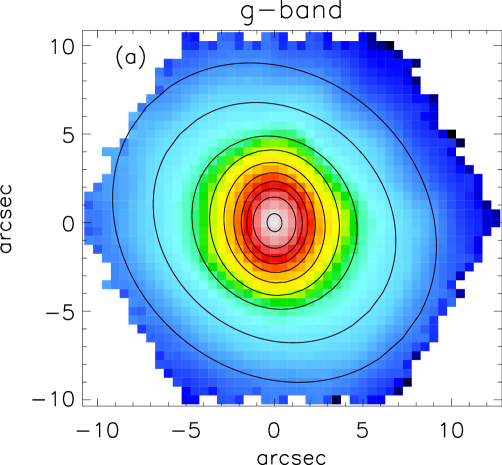
The galaxy has a total stellar mass of 1010 (Salim et al., 2007). Fig. 1 (a) presents the optical false-color image of the galaxy, which clearly indicates that it is an ETG with no sign of spiral arms. The central region of the galaxy is bluer than the outer part.
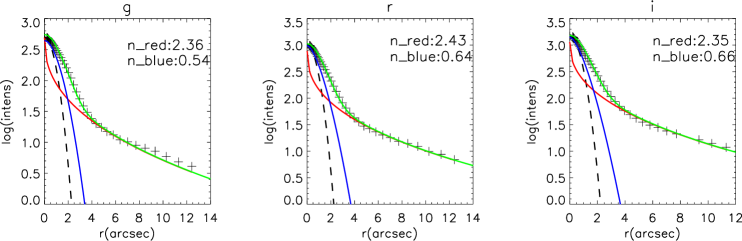
The false-color image also shows apparent extra nuclear light relative to the outer part of the galaxy. To confirm this quantitatively, we obtain the 1-D radial profiles and fit them with Sérsic profiles (Sérsic, 1968). As illustrated in Fig. 2, the outer part of the galaxy has a Sérsic index of around 2.3-2.5, which is consistent with an ETG morphology. The inner part shows apparent extra light above the inward extrapolation of the outer Sérsic profile. As mentioned previously the presence of such extra nuclear light is typical for low-mass ETGs (Kormendy, 1999; Kormendy et al., 2009; Krajnović et al., 2013b).
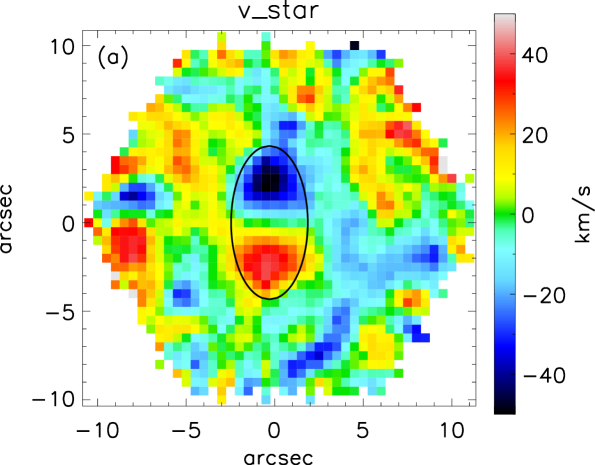
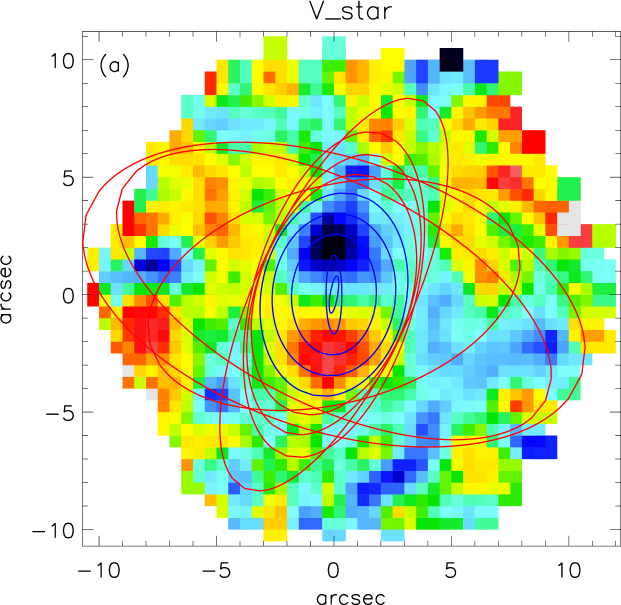
The IFU observations further allow us to investigate the integrated kinematic properties of the galaxy. Fig. 3(a) shows the stellar velocity map. To evaluate globally whether it is a slow or fast rotator, we measure within 1.0Re (Emsellem et al., 2007; Cappellari, 2016) and compare it with the apparent ellipticity . As shown in Fig. 3(b), the galaxy lies above the dividing line in spite of measurement uncertainties, indicating that it is a fast-rotator, again consistent with low-mass ETGs.
3.2 An inner rotating disk with ongoing star formation
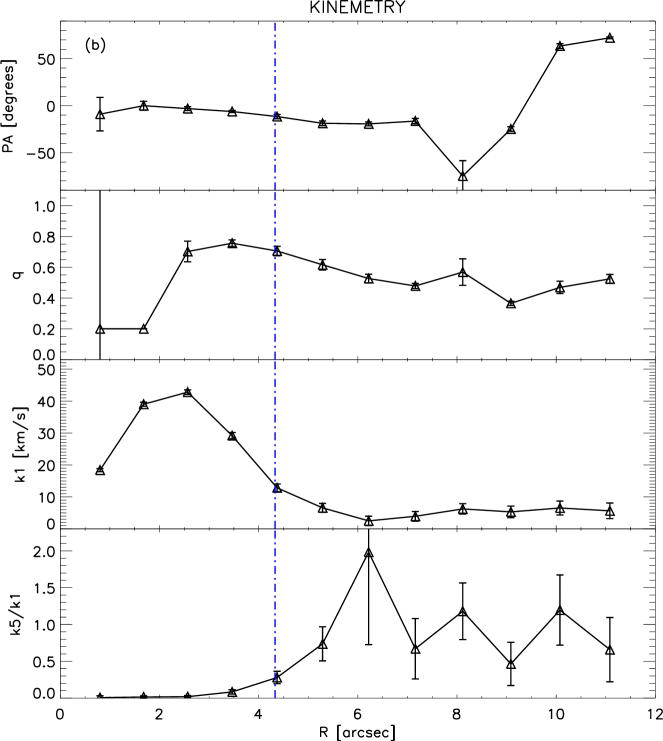
The inner and outer regions of the galaxy show distinct kinematic properties. As shown in Fig. 3 (a), the nuclear region containing the extra light is clearly a rotating disk while the outer part is dispersion dominated. This is further demonstrated in the vs. plane as shown in Fig. 3 (b): the inner component is above the dividing line between slow and fast rotators, while the outer component is below the line. The galaxy thus belongs to the type of ETGs with kinematically decoupled cores as found in previous surveys (Kormendy et al., 2009; Krajnović et al., 2011; Chen et al., 2012). As it is impossible to produce such cores through any internal process, the presence of the kinematically decoupled core is proof of galaxy merging. We further used the result of the KINEMETRY to quantify the kinematic properties of both parts. As shown in Fig. 4, in the inner region the positon angle (P.A.) of the best-fitted ellipse is almost constant, and the velocity of each ellipse dominates over the dispersion so that is small. Furthermore, from the rotation curve in the inner region, we confirm that this can’t be a bar since it doesn’t exhibit a rigid-body rotation (Kormendy, 1982). In contrast, ellipses orient randomly in the outer region and the velocity drops to almost zero with increasing rapidly, which indicate the dominance of dispersion. We also used the methodology in Tabor et al. (2017) to make a kinematic decomposition of the galaxy, and confirmed that the inner part is disk like while the outer part is bulge like.
Fig. 1 (b) is the band image from BASS (Beijing-Arizona Sky Survey) data release 2 (Zou et al., 2017, Sub.) which is 0.87 mag deeper than the SDSS. It covers arcsec2 FOV, about twenty times bigger than the coverage of the Fig. 1 (a). There are some faint tidal features around the host galaxy. After smoothing the image following the method in Miskolczi et al. (2011), the tidal features are more obvious, as exhibited in Fig. 1 (c). These tidal features further indicate the recent or ongoing merger events (Martínez-Delgado et al., 2010; Miskolczi et al., 2011).
As shown in Fig. 3 (a), we defined the inner region with a major axis of 4.33” (1.54 kpc) and an axis ratio of 0.5. Following the methodology described in Salim et al. (2007) and Chen et al. (2010), we derived the stellar M/L of inner region by comparing the five bands colors with the grid of CB08 (S. Charlot & G. Bruzual, 2008, in priv.) model galaxies colors. Then we obtained the stellar mass of the inner region is 109.5 M⊙, accounting for 30% of the total stellar mass of the galaxy. This large fraction suggests the merger event which formed the disk is likely to have been a major merger.
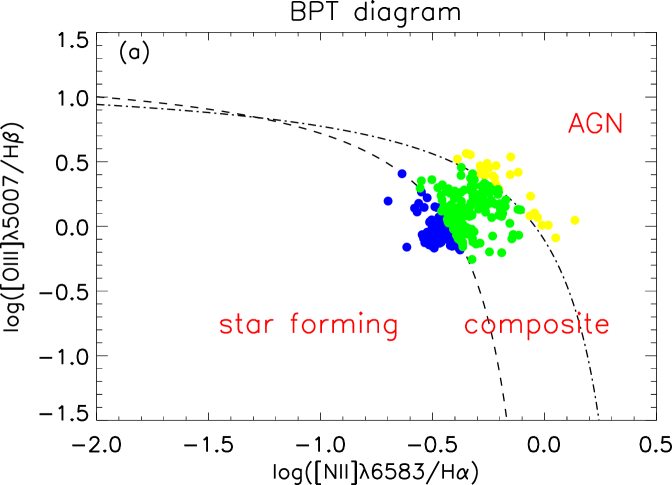
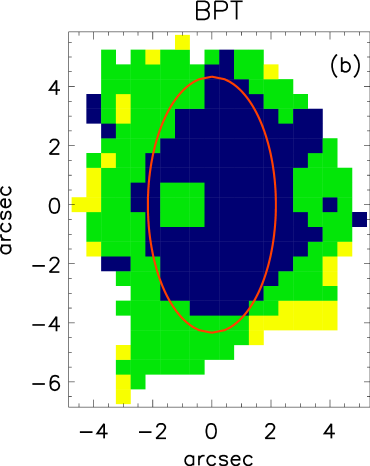
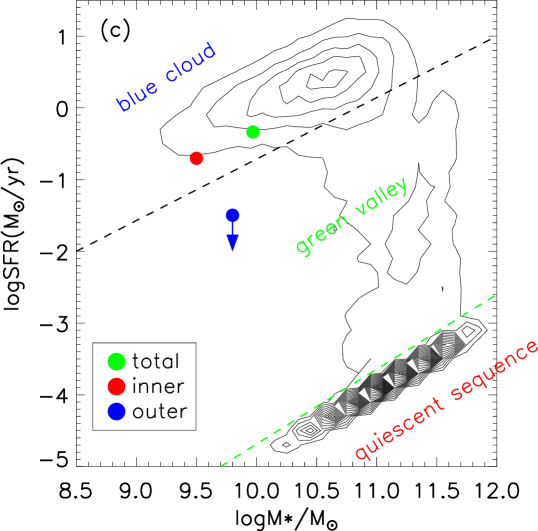
In contrast to the kinematically decoupled cores in other elliptical galaxies, the one in SDSS J142055.01+400715.7 harbors ongoing star formation, as indicated by the spatially resolved BPT diagram (Baldwin et al., 1981; Kewley et al., 2001; Kauffmann et al., 2003). As shown in Fig. 5, the rotation-dominated disk is filled with star forming regions, while the outer region has LIER-like (Belfiore et al., 2016) emission likely excited by old stellar populations. The star formation rate is calculated from the H- emission, accounting for dust extinction which we calculated using the Balmer decrement along with the Calzetti’s attenuation curve (Calzetti et al., 2000). As shown in Fig. 5 (c), the inner disk is located within the main sequence of star-forming galaxies, indicating that its level of star formation is more like that of a spiral galaxy than a starburst. This presence of ongoing star formation offers direct evidence that the merging responsible for this complex galaxy structure must be gas rich.
4 Discussion
While it has long been suspected that low mass ETGs form through gas-rich merging/accretion, it is been difficult to associate them directly with gas-rich processes because the vast majority of ETG remnants have long since ceased the phase of ongoing star formation indicative of these processes. We have found a galaxy that appears to be in the final phase of gas-rich merging, the result being a typical low-mass ETG. While globally it is a fast-rotating ETG with extra nuclear light, the distinct kinematic features of the inner and outer parts and the tidal features surrounding the host galaxy suggest galaxy merging as the origin of this galaxy, and the ongoing star formation in the nuclear region further indicates that the merging is gas rich. The cold gas mass can be roughly estimated with the star formation law that is the relationship between the star formation rates and gas masses (Kennicutt, 1998). We first estimate the oxygen abundance to be Solar so that the star formation law of spiral galaxies can be used (Shi et al., 2014). Based on the equation by Shi et al. (2018), the derived cold gas mass is about 108.13 M⊙. The gas to stellar mass ratio is thus small, only about 1%. This may be because the object is already at the final stage of merging so that the majority of the gas has been expelled or consumed.
The galaxy also offers direct evidence that the extra nuclear light is contributed by star formation activity in the nuclear regions (e.g. Kormendy, 1999). The spatial extent of the extra nuclear light as seen in the 1-D radial profile is more or less the same as that of star-formation regions, as seen in the spatially-resolved BPT diagram (Fig. 5). The extra nuclear light covers a region with radius around 0.7-1.0 kpc in the optical band (Fig. 2 and Fig. 6 (b)), which is much larger than observed in other ETGs (a few0.1 kpc) (Kormendy et al. 2009). This is likely caused by the young age of the stellar population in the extra light so that the mass-to-light ratio is smaller for the inner part.
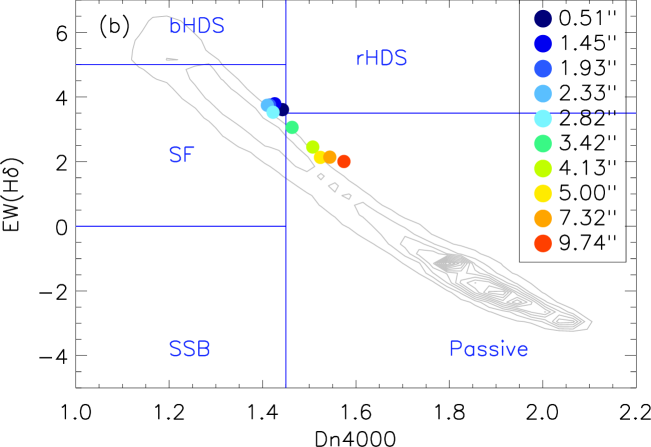
Several studies have found that some ETGs exhibit ongoing star formation. These ETGs often contain gas and stellar misalignment, indicating fresh gas accretion from outside (Ilyina et al., 2014; Sil’chenko et al., 2014). However, they are different from the galaxy in the current work. Those galaxies are already ETGs and acquire a minor amount of external gas to trigger moderate star formation, sometimes referred to as rejuvenation. On the other hand, our galaxy lies in the star forming main sequence, indicating gas-rich merging. In Fig. 6 we plot diagram (Balogh et al., 1999) for different radii. The best fitting rings are extracted from the “ellipse” task in IRAF. There is a monotonic decrease outward, indicating an outside-in quenching scenario. This could be evidence of the final phase of gas-rich merging as it produces a low-mass ETG.
5 Conclusion
We report a discovery of an early-type galaxy in MaNGA that offers direct
evidence for gas-rich merging as the origin of low-mass ETGs. The
integrated properties of the galaxy are consistent with a typical
low-mass ETG with =1010 M⊙, no spiral arms, fast
rotating kinematics and an outer Sérsic profile index of 2.1-2.4. However, the outer
and inner parts show distinct dispersion dominated
and rotation dominated kinematics, respectively. And the broad-band image shows some tidal features surrounding the galaxy. These all suggest recent galaxy
merging. Furthermore the inner disk harbors on-going star formation
as indicated by the BPT diagram, which suggests that the merging is gas
rich. The type of the galaxy is
rare but it may be a demonstration of the role that gas-rich merging plays in making a
low-mass ETG.
Acknowledgements
We thank the referee for a detailed report which helped significantly improve the presentation of our work. S.L. and Y.S. acknowledge support from the National Key R&D Program of China (No. 2018YFA0404502), the National Natural Science Foundation of China (NSFC grants 11733002 and 11773013), the Excellent Youth Foundation of the Jiangsu Scientific Committee (BK20150014), and National Key R&D Program of China (No. 2017YFA0402704). Y.C. acknowledges support from National Natural Science Foundation of China (NSFC grants 11573013). D.B. is supported by grant RScF 14-50-00043. Funding for the Sloan Digital Sky Survey IV has been provided by the Alfred P. Sloan Foundation, the U.S. Department of Energy Office of Science, and the Participating Institutions. SDSS- IV acknowledges support and resources from the Center for High-Performance Computing at the University of Utah. The SDSS web site is www.sdss.org. SDSS-IV is managed by the Astrophysical Research Consortium for the Participating Institutions of the SDSS Collaboration including the Brazilian Participation Group, the Carnegie Institution for Science, Carnegie Mellon University, the Chilean Participation Group, the French Participation Group, Harvard-Smithsonian Center for Astrophysics, Instituto de Astrofísica de Canarias, The Johns Hopkins University, Kavli Institute for the Physics and Mathematics of the Universe (IPMU) / University of Tokyo, Lawrence Berkeley National Laboratory, Leibniz Institut für Astrophysik Potsdam (AIP), Max-Planck-Institut für Astronomie (MPIA Heidelberg), Max-Planck-Institut für Astrophysik (MPA Garching), Max-Planck-Institut für Extraterrestrische Physik (MPE), National Astronomical Observatory of China, New Mexico State University, New York University, University of Notre Dame, Observatório Nacional / MCTI, The Ohio State University, Pennsylvania State University, Shanghai Astronomical Observatory, United Kingdom Participation Group, Universidad Nacional Autónoma de México, University of Arizona, University of Colorado Boulder, University of Oxford, University of Portsmouth, University of Utah, University of Virginia, University of Washington, University of Wisconsin, Vanderbilt University, and Yale University.
References
- Baldwin et al. (1981) Baldwin J. A. et al., 1981, PASP, 93, 5
- Balogh et al. (1999) Balogh M. L. et al., 1999, ApJ, 527, 54
- Belfiore et al. (2016) Belfiore F. et al., 2016, MNRAS, 461, 3111
- Bender et al. (1989) Bender R. et al., 1989, A&A, 217, 35
- Blanton et al. (2017) Blanton M. R. et al., 2017, AJ, 154, 28
- Bundy et al. (2015) Bundy K. et al., 2015, ApJ, 798, 7
- Calzetti et al. (2000) Calzetti D. et al., 2000, ApJ, 533, 682
- Cappellari et al. (2011a) Cappellari M. et al., 2011a, MNRAS, 413, 813
- Cappellari et al. (2011b) Cappellari M. et al., 2011b, MNRAS, 416, 1680
- Cappellari et al. (2013a) Cappellari M. et al., 2013a, MNRAS, 432, 1709
- Cappellari (2016) Cappellari M., 2016, ARA&A, 54, 597
- Chang et al. (2015) Chang Y.-Y. et al.,2015, ApJS, 219, 8
- S. Charlot & G. Bruzual (2008, in priv.) Charlot S. & Bruzual G., 2008, in private
- Chen et al. (2010) Chen Y. M. et al., 2010, AJ, 140, 445
- Chen et al. (2012) Chen Y. M. et al., 2012, MNRAS, 421, 314
- de Zeeuw et al. (2002) de Zeeuw P. T. et al., 2002, MNRAS, 329, 513
- Drory et al. (2015) Drory N., et al., 2015, AJ, 149, 77
- Emsellem et al. (2007) Emsellem E. et al., 2007, MNRAS, 379, 401
- Emsellem et al. (2011) Emsellem E. et al., 2011, MNRAS, 414, 888
- Hubble (1926) Hubble E. P., 1926, ApJ, 64, 321
- Hubble (1936) Hubble E. P., 1936, Yale University Press
- Gunn et al. (2006) Gunn J. E., 2006, AJ, 131, 2332
- Ilyina et al. (2014) Ilyina M. A. et al, 2014, MNRAS, 439, 334
- Jorgensen & Franx (1994) Jorgensen I., Franx M., 1994, ApJ, 433, 553
- Kauffmann et al. (2003) Kauffmann G. et al., 2003, MNRAS, 346, 1055
- Kennicutt (1998) Kennicutt Jr. R. C., 1998, ARA&A, 36, 189
- Kewley et al. (2001) Kewley L. J. et al., 2001, ApJ, 556, 121
- Kormendy (1982) Kormendy J. 1982, ApJ, 257, 75
- Kormendy (1999) Kormendy J. 1999, Galaxy Dynamics - A Rutgers Symposium
- Kormendy et al. (2009) Kormendy J. et al. 2009, ApJS, 182, 216
- Krajnović et al. (2006) Krajnović D. et al., 2006, MNRAS, 366, 787
- Krajnović et al. (2011) Krajnović D. et al., 2011, MNRAS, 414, 2923
- Krajnović et al. (2013a) Krajnović D. et al., 2013a, MNRAS, 432, 1768
- Krajnović et al. (2013b) Krajnović D. et al., 2013b, MNRAS, 433, 2812
- Lauer et al. (2005) Lauer T. R. et al., 2005, AJ, 129, 2138
- Law et al. (2015) Law D. R. et al., 2015, AJ, 150, 19
- Law et al. (2016) Law D. R. et al., 2016, AJ, 152, 83
- Martínez-Delgado et al. (2010) Martínez-Delgado D., et al., 2010, AJ, 140, 962
- McDermid et al. (2006) McDermid R. M. et al., 2006, MNRAS, 373, 906
- Miskolczi et al. (2011) Miskolczi A. et al., 2011, A&A, 536, A66
- Salim et al. (2007) Salim S. et al., 2007, ApJS, 173, 267
- Sérsic (1968) Sérsic J. L., 1968, Atlas de Galaxias Australes
- Shi et al. (2014) Shi Y., Armus L., Helou G., et al. 2014, Nature, 514, 335
- Shi et al. (2018) Shi Y. et al., 2018, ApJ, 853, 149
- Sil’chenko et al. (2014) Sil’chenko O. K. et al, 2014, ASPC, 486, 27
- Smee et al. (2013) Smee S. A. et al., 2013, AJ, 146, 32
- Tabor et al. (2017) Tabor M. et al., 2017, MNRAS, 466, 2024
- Wake et al. (2017) Wake D. A. et al., 2017, AJ, 154, 86
- Worthey et al. (1997) Worthey G. et al., 1997, ApJS, 111,377
- Yan et al. (2016a) Yan R. et al., 2016, AJ, 151, 8
- Yan et al. (2016b) Yan R. et al., 2016, AJ, 152, 197
- Zou et al. (2017) Zou H. et al., 2017, PASP, 129, 064101
- Zou et al. (Sub.) Zou H. et al., submitted, arXiv: 1712.09165