Empirical signatures of shape phase transitions in nuclei with odd nucleon numbers
Abstract
Nuclear level density at low excitation energies is proposed as an indicator of the first order phase transitions in nuclei. The new signature, a maximum value of the level density at the critical point, appears to be sensitive to the detailed way the phase transition takes place in different nuclear regions: it is consistent with phase coexistence in the region, and with a rapid crossing of the two phases, without their coexistence/mixing at the critical point in the region, respectively. Candidates for critical point nuclei are proposed for odd-mass and odd-odd nuclei, using correlations between relative excitation energies, and their ratios, for structures (bands) based on unique-parity orbitals.
pacs:
21.10.Re,21.10.Ma,64.70.TgI Introduction
Quantum phase transitions (QPT) in nuclei appear at zero temperature, and represent rapid changes in the equilibrium deformation of the ground state, induced by the variation of a nonthermal control parameter – the number of nucleons, due to the competition of phases with different shapes. Such changes in the shape of the ground state influence the evolution of various nuclear properties, and, in order to characterize this type of QPT (called also shape phase transition – SPT), it is important to identify observables that can play the role of order parameters, allowing to observe how these critical phenomena take place. Because the natural control parameter in nuclei, the nucleon number, has only integer values, its discontinuous variation smoothes out the discontinuities at the phase transition point (or critical point). Both experimental and theoretical studies propose various ways to assess the different signatures of the SPTs: the discontinuous behavior of nuclear properties that can be related to order parameters and the characterization of the type of transition (first or second order), the coexistence of the two phases, and the possible realization of critical points in real nuclei. There are several review papers which present the nuclear QPT domain from phenomenological point of view, as well as based on theoretical nuclear structure models G-Cejnar ; G-Casten1 ; G-Casten2 ; GT-Cejnar ; GT-Iachello such as the Interacting Boson Model IBM or the geometric (or collective) model BMM ; GG .
Most of the theoretical and experimental studies concentrated until now mainly on the even-even nuclei. The reason is that the evolution of many experimental observables of these nuclei can be followed over extended nuclear regions thus allowing to identify and characterize the discontinuities that are typical of SPT. Also, in the even-even nuclei, in order to describe the phase transitional nuclei, Iachello introduced, in addition to the three IBM benchmarks of collective behavior (spherical nuclei – or with U(5) dynamical symmetry, -soft nuclei – with O(6) dynamical symmetry, and nuclei with axially symmetric deformation – with SU(3) dynamical symmetry) IBM , the concept of critical point symmetries. He proposed two such models, called E(5) for the second order phase transition (between spherical, U(5) nuclei and -soft, O(6) nuclei) E5 , and X(5) for the first order phase transition (between spherical, U(5) nuclei and symmetrically deformed, SU(3) nuclei) X5 . In contrast, the odd-mass and odd-odd nuclei were much less studied until now, because of their more complicated structure. Experimentally, it is difficult to find, for such nuclei, observables that can be followed over extended nuclear regions; theoretically, the dynamical situation created by extra-particle(s) added to the even-even core, is more complex. Only during the last decade there has been a boost of studies (both theoretical and experimental) devoted to these nuclei Iac-E5/4 ; Alonso1 ; Alonso-E5/12 ; E5/12 ; Boyuk ; Jafar ; Iac-Lev ; Petrellis ; Nomura1 ; Nomura2 ; Quan ; Yu1 ; Yu2 ; Yu3 ; Yu4 ; Yu5 ; Buc1 ; Buc2 .
In this work we further extend our previous empirical approach to SPT in odd-mass nuclei Buc1 , by focusing on experimental quantities that can be used as order parameters for all types of nuclei, both even-even and with odd numbers of nucleons. The nuclear level density at low excitation energies is proposed as a novel indicator for first order SPT. Other aspects of a SPT, such as phase coexistence and critical point nuclei are considered as well.
II Empirical observables as effective order parameters
Because the equilibrium deformation of the ground state is not an observable, one recurses to the so-called effective order parameters, which are experimental observables sensitive to SPT occurrence. Reference Iac-Zam addressed this problem by determining the order parameter (deformation) both classically, with a Landau-type of potential, and by quantum calculation within the IBM. This study emphasized that (i) the finiteness of the nuclei leads to a certain smoothing of the expected discontinuities but that this is not a dominating effect, and (ii) the advantage in the nuclear case is that properties of both ground state and excited states can be measured. One can then use as effective order parameters observables related both to the ground state and to excited states, which may present distinct signatures for the characterization of the SPT. Generally, the critical behavior of excited states may differ from that of the ground state, and thus lead to a slightly different critical point in some cases.
In the following we briefly review the effective order parameters used until now to identify signatures of the SPTs.
II.1 Nuclear mass-related quantities
These may be considered the most basic ones because they are related to the ground state properties. Nuclear masses or binding energies comprise the sum of all binding effects in a nucleus (single-particle and residual interactions). However, their values (in MeV) are very large and thus obscure the effects (of a few MeV) produced by changing the nuclear deformation. It is therefore convenable to use nuclear mass-based quantities which are of a differential nature and consequently more sensitive to changes, such as different separation energies.
One of the most useful such quantities is the two-neutron separation energy , proposed long ago in a paper which studied the classical limit of IBM Dieperink , and intensively used since then to identify and characterize SPTs (see G-Cejnar ; G-Casten1 ; G-Casten2 , and, for a few recent references, Iac-Lev ; Petrellis ; Yu1 ; Yu2 ; Yu4 ; Buc1 ). For a chain of isotopes, shows an almost linear decrease with increasing , with discontinuities at the shell closures and at the critical points of first order SPTs. The change at the critical point shows up as a flattening or even an increase of the curve, which translates into a singularity/kink in the derivative of with respect to . For the second order SPTs shows a discontinuity only in its first derivative. This behavior was discussed in many papers (see quoted references). The basic character of as a direct signature of the SPT comes from its expression as , where is the binding energy (the energy of the ground state). It is therefore proportional to the first derivative of the nuclear binding energy with respect to the order parameter , and thus plays a role in the characterization of the QPT similar to that of the free energy and its derivatives with respect to the order parameter in the classical case G-Cejnar ; G-Casten1 ; Yu4 . The differential variation of (therefore the second derivative of ) peaks at the critical point of the to transition, the peak being a function in the infinite-size limit (infinite number of bosons), and showing a smoother behavior for realistic numbers of bosons G-Cejnar . Other quantities expressing various mass differences, such as -particle decay energies , double- decay energies , as well as other decay energies or -values, are also useful to characterize SPT in nuclei Yu1 . One should emphasize that such mass-related quantities as presented above are available for a large number of nuclei (as they are derived from mass tables masstable ) and can be used to identify and characterize SPT in any kind of nuclei (even-even or with odd and/or odd ).
II.2 Nuclear radii and related quantities
Nuclear charge radii are sensitive to shell/subshell closures, and also to changes in the ground state deformation (actually, they are directly related to the deformation parameter). Therefore, similar to the two-neutron separation energies, nuclear radii and their differential variation show discontinuities and kinks at shell closure and critical points, respectively Angeli ; Angeli-Marinova . Measured nuclear charge radii are available for many nuclei of all types radii . Quantities that were considered as signatures of the SPT are the average squared charge radii and their differential variations, like the isotope shifts (differences between two adjacent isotopes with mass and ), and the isomer shifts [differences for the states and , or for the and states, respectively, in the same (even-even) nucleus]. The later are sensitive to the type of the SPT (first or second order) Iac-Zam ; McCutchan .
II.3 Quantities based on excitation spectra of nuclei
(1) Excitation energies, , , and their ratio (for the even-even nuclei) were largely used for a long time. Similarly, certain relative excitation energies and their ratios were also used in odd-mass nuclei Nomura1 ; Buc1 ; Buc2 . To distinguish the first- and second-order SPT within the IBM, the ratio was proposed Bonatsos .
(2) Electromagnetic transition strengths. transitions within the ground state band, especially (which is related to the deformation parameter ), and the ratio ; or between different bands: , and BE2-interband ; Zhang-interband . Another good SPT indicator was found in the electric monopole, E(0) transition strength Wood ; PvB-E0 ; Wiederhold .
(3) Two-neutron transfer reaction intensities (from the ground state of the mass target to the and states of the final or nuclei) 2n-Fossion ; 2n-Yu .
(4) Global properties of the excited states in even-even nuclei 0+ .
From the list presented above, one can see that most of the experimental quantities used until now as signatures (or order parameters) of SPTs in nuclei refer to even-even nuclei. It is therefore of utmost importance to enlarge this list with other quantities that can be used for all types of nuclei.
III Nuclear level density: a novel indicator for first order shape phase transitions
Previous results, both theoretical calculations and experimental findings, indicated that at the critical point of the transition between spherical and axially deformed shapes the excited nuclear states have a peculiar behavior. Thus, IBM calculations predicted that the spectrum of the low-lying excited states was maximally compressed at this point Cejnar-PRE , this behavior persisting for higher spins as well. Experimental studies of the two-neutron transfer reaction , which is particularly suited to evidence states, showed that the nucleus 154Gd, known as a good example of X(5) critical point nucleus (for the transition from spherical to axially deformed nuclei) had indeed an enhanced number of low-lying (up to 2.5 MeV) states, compared to other nuclei in the same region 0+ ; 0+PRC . These results have led to the expectation that, near the critical point, there may be an enhancement of the density of levels at low excitation energies.
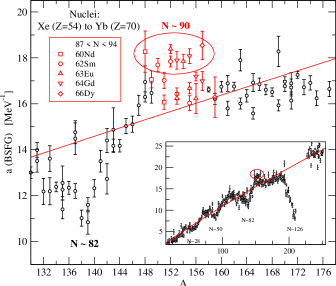
In order to investigate this possibility we examine now experimentally determined nuclear level densities. We refer to the results of Ref. vE-DB for the nuclear level densities at relatively low excitation energies. In that work, the total level density was determined for individual nuclei by fitting both the cumulative numbers of known low-lying levels and the density of neutron resonances, with the back-shifted Fermi gas model formula (BSFG) BSFG-CT ,
| (1) |
with the free parameters and the energy shift . The nuclei for which this procedure can be applied is limited to about 300, as they are of the stable-nucleus-plus-one-neutron type. The fitting procedure is described in vE-DB . The result of the individual fits to all these nuclei (between 18F and 251Cf) are shown in the inset of Fig. 1. The values of show an almost linear dependence on , on which oscillations due to shell effects are superimposed BSFG-CT ; vE-DB ; RIPL3 . Note that for nuclei with comparable mass values, the larger the parameter , the larger is the level density , therefore one can use as a measure of the level density.
By observing correlations between the parameters and and different experimental quantities, the following compact empirical formulas were proposed to describe these experimental values:
| (2) |
| (3) |
where , with the shell correction being the difference between the binding energy calculated with a Weizsäcker-type (liquid drop) formula Weiz and the experimental value, and is the so-called deuteron pairing defined as , -values as tabulated in masstable . Formulas (2) and (3) can be used to predict level densities of nuclei for which these are not known or cannot be measured, by using only quantities from the mass tables.
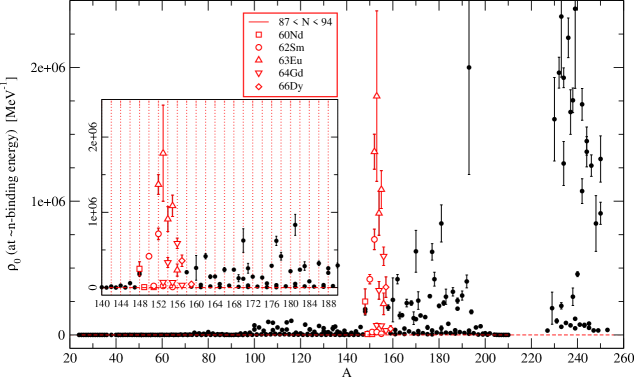
One remarks in the inset of Fig. 1 a set of nuclei with mass which significantly deviate from the average trajectory of the data. The big graph of Fig. 1 presents in detail the region with these nuclei. One observes that the isotopes of Nd to Dy with around 90 have larger level densities than other nuclei from this mass region, their values being about 18 MeV-1, compared to about 16.5 MeV-1 of the average behavior. These are exactly the nuclei near/at the critical point of the well known transition from spherical to axially deformed nuclei in this mass region. Therefore, another signature of the first order SPT from this region is an increase of the level density at the critical point. The examination of the experimental level densities at the neutron resonance energy brings further support to this conclusion. Figure 2 shows the experimental values of the density of the -wave neutron resonances , as determined from the average level spacings of these resonances RIPL3 . The same set of nuclei, around the critical point at , shows almost the largest values observed in the nuclei, some of them comparable to values observed only in some transactinide nuclei.
One should remark here that the set of about 300 nuclei represented in both Figs. 1 and 2, for which experimental and values are known, is rather restricted, as it comprises only nuclei that can be obtained from stable targets plus one neutron. The SPT region with the peak around the critical point shows up so well because it contains, fortunately, many such nuclei, thus allowing to see a meaningful correlation between the SPT and the level density both at low excitation energies and at the neutron resonance energy. However, many key nuclei from this region, close to the critical point, cannot appear in these plots (such as, e.g., 150Nd), and this is generally the case for other nuclear regions where first order SPTs occur.
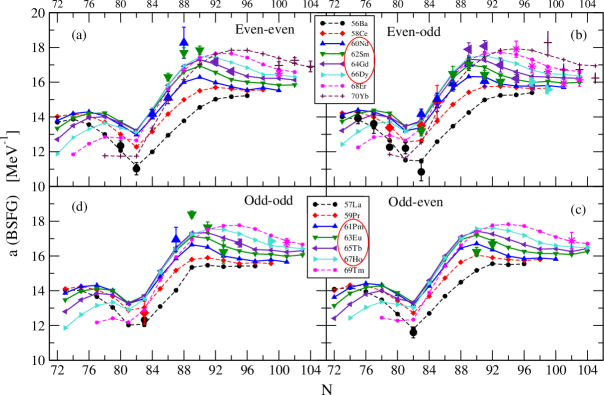
In order to see how this first order SPT occurs as a function of the neutron number (the control parameter) in the level densities of all nuclei from the mass 150 region we rely on formula (2) for the parameter , which describes reasonably well the set of the 300 experimentally investigated nuclei vE-DB . Figure 3 shows how evolves as a function of for all types of nuclei with between 56 (Ba) and 70 (Yb). The curves passing through small symbols are the values predicted by Eq. (2). One can see that they describe reasonably well the few existing experimental data from this region (the big symbols, representing the values obtained by individual fits to those nuclei vE-DB ), which suggest themselves the existence of maxima around . For all four types of nuclei (with both even and odd numbers of nucleons) the curves of the isotopic chains between (Nd) and (Ho) present a maximum for (maximum level density) around the critical value . For isotopes with larger this maximum gradually shifts to larger and diminishes, while for smaller it does not exist. It is thus seen that the main correction in Eq. (2) to the almost linear dependence on , which is due to the ”shell correction” , contains information not only on the shell closure but on the occurrence of the shape phase transition as well – which is not surprising, as it is determined by the nuclear masses.
As Figs. 1 to 3 show, the nuclear level density at low energies, represented by the main parameter of its BSFG model description is a good signature for the SPT at , the nuclei near the critical point having the largest level densities. This confirms the predictions of the IBM calculations for the maximization of states density at the U to SU transition point Cejnar-PRE , and corroborates the experimental findings for the numbers of states in nuclei from the same region 0+ ; 0+PRC . The meaning of this level density enhancement at relatively low energies may be related to the special potential well of the nuclei near the critical point G-Casten1 ; G-Casten2 . It is expected that in such nuclei the potential well is broadened (in the deformation space) due to the nearly degenerated spherical and deformed coexisting minima, with a small barrier between them. As states can exist in either minimum, such a potential well can accommodate more states, their large density and the small barrier favoring the state mixing. Therefore, the enhancement of the level density, clearly shown in the presented data for the mass region, is consistent with the phase coexistence, another phenomenon expected for a first order SPT.
IV Comparison between the and SPT regions
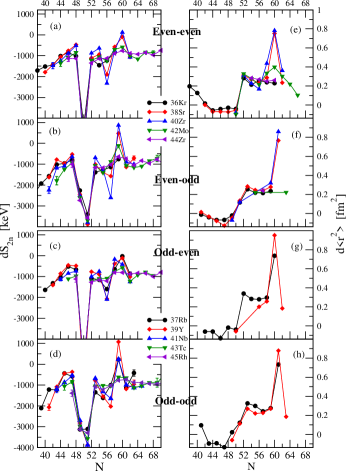
It is interesting to apply the present approach based on the level density to other well established nuclear regions showing a first order SPT. One of these, well known for its very rapid transition, is the (Sr - Zr) region, with the critical point at . Before looking at level densities, we first make a comparative analysis of the the and regions, using general order parameters that can be applied to all types of nuclei, that is, the quantities and discussed in Sec. I. Actually, we have used their differential variation (difference between two successive isotopes) which acts as a ”magnifying glass” in highlighting the discontinuities associated with the SPT.
Figure 4 displays the differential variation of the two-neutron separation energy, and of the mean square charge radius, respectively, for the nuclei in the region of the STP at , separated for the four types of nuclei according to their nucleon numbers. can be examined for both even-even nuclei and nuclei with odd numbers of nucleons, as shown in some recent papers Petrellis ; Yu1 ; Yu2 ; Yu4 ; Buc1 . Its behavior in this mass region was considered in detail in Refs. Petrellis ; Yu1 ; Yu2 ; Yu4 , by examining its deformation-dependent part, as well as the odd-even effects. It was found that the signal for the emerging SPT is enhanced by the extra-single particle(s) in comparison with that from the adjacent even-even nuclei, and that pairing plays the major role in driving the phase transition. The enhancement of the signal for the SPT can be also seen in graphs (a) to (d) of Fig. 4, the amplitude of the kink at being larger for the odd nuclei than for the even-even ones, with the largest effect in the odd-odd nuclei, in agreement with the findings of Ref. Yu1 . A recent study of Sm and Eu nuclei, with a core-quasiparticle coupling Hamiltonian based on the energy dependence functionals, explained the enhancement of the SPT in the odd-mass nuclei by a shape polarization effect of the unpaired proton, which, before the critical neutron number 90 couples to Sm cores, and starting from couples predominantly to Gd cores which have larger quadrupole deformation and smaller pairing Quan .
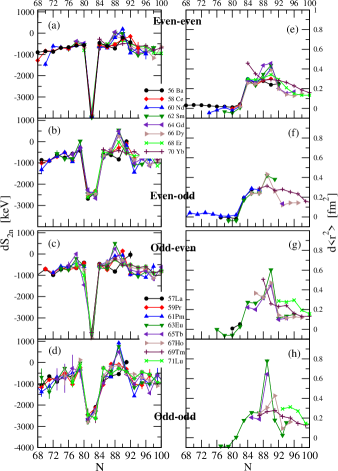
Graphs (e) to (h) in Fig. 4 show the differential variation of the mean square charge radius for the same nuclei from the left column of the figure, whenever these quantities are available radii . The aspect of these graphs in the region is similar to that of the corresponding graphs from the left side, also showing the enhancement of the signal in the nuclei with odd number of protons. Actually, a similarity between the graphs of various differential observables (these two and those of some other spectroscopic observables available only for even-even nuclei) as a function of , was remarked in Ref. Cakirli .
Figure 5 is the analog of Fig. 4, for the region with mass , with its fastest known shape phase transition at . It looks rather similar to Fig. 4, except for the smaller number of isotope chains which show the SPT in the graphs (a) - (d) of . There is a clear signature in even-even nuclei [graph (a)] only for Sr and Zr (also well known from other spectroscopic observables). In the even-odd nuclei [graph (b)] the signature for the first order SPT is enhanced for Sr and Zr and there is also a weaker signature for the Mo isotopes. In the nuclei with odd proton [graphs (c) and (d)] there is indication of SPT in Rb, Y, and Nb nuclei, with an enhancement of the signature in the odd-odd nuclei. Graphs (e) to (d) for the charge radii show a strong SPT signature, unfortunately the only chains with available data being Sr and Zr [graphs (e) and (f)], and Rb and Y [graphs (g) and (h)].
Figures 4 and 5 show a rather close similarity between the two regions, with clear signatures of first order SPT appearing at and , respectively. We examine now how the SPT in the Sr – Zr region appears in the evolution of the level density. Figure 6 is similar to Fig. 3, it displays the level density parameter for the isotopic chains from Kr to Rh. Unfortunately, there are no experimentally determined level densities for the rather neutron-rich nuclei around the critical point . There are only several nuclei with experimental points (big filled symbols), all below , the trend of their evolution with being reasonably well reproduced by Eq. (2). We rely therefore on formula (2) to examine how the level density evolves in this region. It is likely that this formula predicts with reasonable accuracy the level density parameter at least for the cases when experimental masses are used (in Fig. 6 the points calculated from extrapolated masses – from Ref. masstable , are distinguished by open small symbols and dashed curves). The shape phase transition (kinks in Fig. 5) is indicated by a discontinuity in the evolution of , shown by the change of slope at , after which the values remain almost constant (Fig. 6).
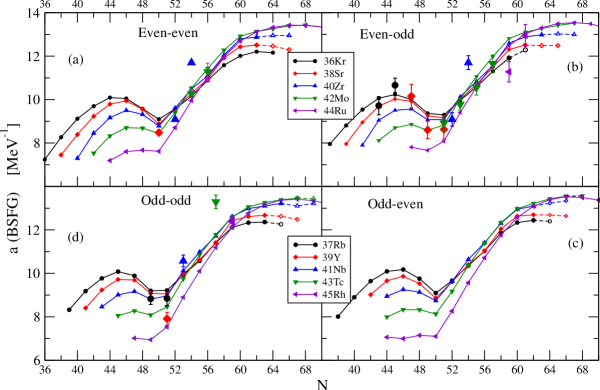
This behavior is different from that of the nuclei from the Sm region (Fig. 3). The lack of a maximum of the level density at the critical point in Fig. 6 may indicate that in the Sr – Zr region there is no phase coexistence at the critical point. This situation corroborates the results of recent large scale Monte Carlo shell model calculations which describe very well the characteristics of nuclei in this region, namely, 96Zr 96Zr and the SPT at 100Zr . In all nuclei from this region, from 96Zr to 110Zr, these calculations predict coexistence of various shapes: spherical, prolate, oblate, and triaxial, the mechanism describing quantitatively the low-energy structure of these nuclei being the type II shell evolution typeII ; 96Zr ; 100Zr . The SPT in the Sr – Zr region is a rather special one, the transition from nuclei with spherical ground state to nuclei with axially deformed ground state being a rather abrupt one, the two competing configurations crossing each other without significant interaction between them. The same situation appears in the similar transition from 96Sr and 98Sr, where Coulomb excitation studies showed that the prolate (g.s.) and spherical (excited) coexisting configurations of 98Sr have a very weak mixing 96-98Sr . In the Sm region this transition is comparatively more gradual, and takes place through a critical point where the two phases coexist and mix with each other. A discussion of the shape coexistence and phase coexistence phenomena can be found in G-Cejnar ; phase-shape . We conclude this section by stating that the analysis of these two nuclear regions shows that shape phase transition and phase mixing in nuclei can appear in different forms and with different characteristics, as also remarked in BE2-interband .
V Critical point nuclei
Besides the abrupt change in the order parameter (ground state equilibrium deformation) and the phase coexistence phenomenon, a third feature of the SPT in nuclei is the possible experimental occurrence of critical point nuclei. Because the number of nucleons is an integer, the nuclear properties change discretely, and in principle it may happen that real nuclei do not lie exactly at the critical point. The identification of nuclei with critical point features in the even-even case has mainly been based on comparison of spectroscopic observables with the parameter-free predictions of the critical point symmetries E(5) E5 and X(5) X5 . Thus, for the first order SPT a number of nuclei with X(5) properties were proposed in the rare earths region, in particular the nuclei 150Nd 150Nd , 152Sm 152Sm , 154Gd 154Gd ,156Dy 156Dy , as well as other possible candidates in heavier rare earths Clark ; 166Hf . IBM calculations also allowed localization of the critical phase transition points (see, e.g., Ref. Ramos-IBM ). For the odd-mass nuclei, there are also theoretical developments of critical point symmetries. Thus, Iachello introduced the critical point Bose-Fermi symmetry E(5/4) for the case of a particle coupled to an E(5) core Iac-E5/4 , subsequently extended into the E(5/12) model Alonso-E5/12 ; E5/12 by considering a multi- case: coupling of a particle in orbits. The X() model was proposed for cases in which a particle in a orbit is coupled to an X(5) core Yu3 . As empirical studies of different order parameters show (see also previous sections of this work), the first order SPTs in odd-mass nuclei are strongly correlated to those taking place in the adjacent even-even nuclei. The role of the unpaired particle on the SPT was also studied within the Interacting Boson-Fermion model (IBFM) IBFM calculations Alonso1 ; Boyuk ; Iac-Lev ; Petrellis , where the theoretical results are compared to experimental evidence on the occurrence of phase transitions in Pm, Eu, and Tb proton-odd nuclei. The IBFM study of a particle in the and 5/2 orbitals Alonso1 showed that the position of the critical point in the odd nucleus is shifted with respect to that in the even-even core, with a magnitude proportional to ( the number of active bosons). Newer developments refer to a microscopic framework based on the nuclear energy density functional theory. In Ref. Nomura1 , the energy density functionals method and a fermion-boson coupling scheme were used, and calculated spectroscopic observables indicate sharp irregularities at mass 151 for the Eu isotopes, and at mass 153 for the odd Sm isotopes. This type of study was recently refined, by using a core-quasiparticle-coupling Hamiltonian based on energy density functionals Quan .
Compared to the even-even case, approaches to describe the structure of odd-mass nuclei in a global way are only at their beginning. Besides studies highlighting the role of the unpaired particle on the SPT (usually manifested in an enhancement of the transition), there is also interest, at present, in empirically finding critical point nuclei with odd and/or odd . Thus, in Ref. Yu2 , it is proposed to identify critical point odd-mass nuclei by looking for the phase coexistence phenomenon, which should take place around the critical point of a first order SPT. In that work the experimentally observed low-lying structure in the odd Sm nuclei was examined. The several known low-lying bands known in these nuclei show that in 151Sm there are coexisting rotational and vibrational bands (phases), whereas the structure of 153Sm is dominated by rotational structures. Therefore, it was proposed that, because 151Sm shows more clearly shape coexistence features, it is closer to the critical point Yu2 .
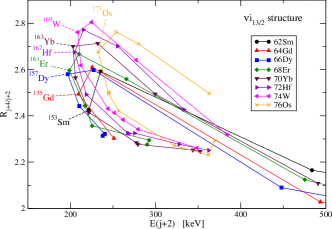
For the odd-mass nuclei, a method based on correlations between excitation energies has been rather useful to identify critical point nuclei. This kind of analysis was first proposed by Ref. AHV , and represents an empirical way to circumvent the integer nucleon number problem finiteN . It consists in using as a control parameter an empirical quantity, such as in even-even nuclei, which, for many nuclei in a region, presents a nearly continuous distribution. Other quantities [like , ], represented as a function of , follow simple, compact trajectories, for large regions of nuclei, with distinct anomalies, characteristic of a phase transition, at ) values similar to that of 152Sm (150 keV) where phase coexistence was suggested AHV . The same is true for other differential observables Wolf . A similar procedure was subsequently proposed for odd-mass nuclei Buc1 . In order to be able to cover large nuclear regions, the structures (bands) determined by unique parity orbitals (UPO) were considered because they practically do not mix with other orbitals and thus lead to nearly identical effects for any UPO. Excitation energies relative to that of the state of spin (the spin of the UPO) were defined within the favoured quasiband , with , and also the ratio , similar to , , and for the even-even nuclei. displays compact trajectories when represented as a function of (the effective control parameter), for the different investigated UPOs Buc1 . In particular, for the nuclei of mass 150, where there are rich data for the UPO, this correlation has a ”turning point” for nuclei near at a minimum energy keV, which is correlated with the critical point of their even-even cores, with keV Buc1 . In the odd-mass nuclei this kind of correlation allows a rather direct identification of possible critical point nuclei, based on their proximity to the critical (turning) point . Figure 7 shows the correlation between and of structures in the even-odd isotopes from Sm to Os. Although less compact than the correlation of versus (Fig. 6 of Buc1 ), it allows a better visualisation of each isotopic chain. In Fig. 7, for each isotopic chain, with increasing mass, (and Buc1 ) first increases as decreases, this trend reversing at the critical (turning) point at keV. One should remark that the maximum of compression of the favoured band at the critical point corroborates well the maximum level density at the same point discussed in Sec. II. Based on the individual isotopic curves in Fig. 7, one can propose critical point nuclei as those which are closest to the point where the curve reverses its trend (turns back in energy). In some cases, like 155Gd or 157Dy, the experimental point coincides rather well with the turning point of an empirical continuous curve drawn through the data points, therefore these nuclei are good candidates for critical points. In other cases, the situation may be different; for example, for the Sm isotopes, 153Sm has the lowest energy, but a continuous curve drawn through the data points may suggest that the turning point occurs somewhere in between 153Sm and 151Sm. Another feature of the critical point nuclei may be the approximate degeneracy in energy of the favoured and unfavoured UPO bands [, , …] Buc1 ; Buc2 .
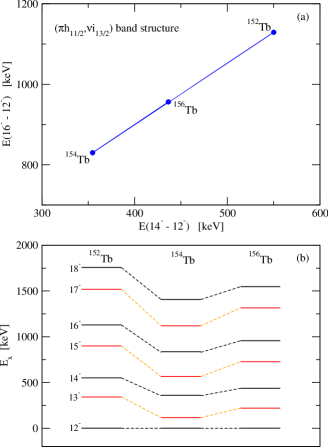
Figures 4 and 5 show a very clear SPT signature for the odd-odd nuclei (Pm, Eu, and Tb in the mass-150 region, and Rb and Y in the mass-100 region, respectively). The complicated structure of these nuclei makes it difficult to follow observables related to excitation energies. In the case of Tb () one could, nevertheless, identify and follow the evolution of the same structure, namely a band with the structure ENSDF , for three nuclei around where one can see the strong SPT signature in Fig. 4. Figure 8(a) shows a correlation between excitation energies within this band, relative to the state of spin 12 (which is the sum of the spins of the two orbitals), similar to the case of UPO states in the odd-mass nuclei. One can see that the evolution of the three nuclei shows a ”turning point” at 154Tb (), which may be proposed as a candidate for critical point nucleus. Figure 8(b) shows that this band is maximally compressed at , similar to the odd-mass nuclei, and in agreement with expectations based on the level density argument. One should also remark that the same argument, of largest level density at the critical point nuclei, seems to be confirmed also for the nucleus 150Pm (Fig. 4), for which a large density of low-lying excited levels was observed through the reaction, unlike for other nuclei in the same mass region (cf. Fig. 1 of 150Pm ). As Figs. 4 and 5 show, further experimental and theoretical studies of signatures of the first order SPT in odd-odd nuclei in the mass regions and , should concentrate on the best candidates for critical point nuclei 150Pm, 152Eu, 154Tb, and 96Rb, 98Y, 100Nb, respectively.
VI Conclusions
In this work it has been shown that the nuclear level density at low excitation energy constitutes a good indicator for the first order shape phase transitions in nuclei. The level density displays a maximum value at the critical point, and this was tested in detail for the known SPT at . This maximum value also discloses the phase coexistence phenomenon at the critical point. It is gratifying that this novel indicator can be studied for all kinds of nuclei, even-even, odd-mass, and odd-odd.
A comparison has been presented between two well known first order SPTs, those at and , by using effective order parameters that are applicable to all types of nuclei: the differential variation of the two-neutron separation energy , of the mean square radius , and the level density (as represented by the parameter of its BSFG description). While the first two such quantities are very similar in the two nuclear regions, just indicating a rapid change of properties, the one based on the level density appears as more shaded, as it indicates some differences related to the way the two SPTs take place: while the transition at is more gradual and indicates phase coexistence and mixing, the one at is consistent with a very rapid crossing of the two phases, without coexistence and mixing between them.
Finally, we discuss the problem of assessing critical point nuclei in the case of the odd-mass and odd-odd nuclei. For the odd-mass nuclei, the method is based on the correlations between excitation energies, and their ratios, of the unique parity orbital structures (bands) Buc1 ; Buc2 . It is shown, by examining the ratio versus (with – the unique parity orbital spin), that candidates for the critical point nuclei can be proposed by looking at their proximity to the critical energy ( keV in the case of nuclei with bands from the region), which appears as a turning point in these graphs. The pattern of these correlations can be used to tell whether the critical point is very close to a certain real nucleus, or it falls between two real nuclei. An example of such correlations is also given for a restricted number of odd-odd nuclei from the same region. Both the odd-mass and odd-odd nuclei display a maximum compression of the band structures near the critical point of a first order SPT, in agreement with the other criterion, of maximum level density. Some candidates of critical odd-odd nuclei are proposed on the basis of the employed empirical investigations.
Acknowledgements.
Partial funding by the Romanian project IFA - CERN-RO/ISOLDE is acknowledged.References
- (1) P. Cejnar, J. Jolie, snd R.F. Casten Revs. Mod. Phys. 82, 2155 (2010).
- (2) R.F. Casten and E.A. McCutchan, J. Phys. G 34, R2856 (2007).
- (3) R.F. Casten, Nature Physics 21, 811 (2006).
- (4) P. Cejnar and J. Jolie, Progr. Part. Nucl. Phys. 62, 210 (2009).
- (5) F. Iachello, Rivista del Nuovo Cimento, 34, 10070-7 (2011).
- (6) F. Iachello and A. Arima, The Interacting Boson Model (Cambridge University Press, Cambridge, 1987).
- (7) A. Bohr and B.R. Mottelson, Nuclear Structure, Vol. II (World Scientific, Singapore, 1998).
- (8) G. Gneuss, U. Mosel, and W. Greiner, Phys. Lett. B 30, 397 (1969).
- (9) F. Iachello, Phys. Rev. Lett. 85, 3580-3, (2000).
- (10) F. Iachello, Phys. Rev. Lett. 87, 052502, (2001).
- (11) F. Iachello, Phys. Rev. Lett. 95, 052503, (2005).
- (12) C.E. Alonso, J.M. Arias, and A. Vitturi, Phys. Rev. Lett. 98, 052501, (2007).
- (13) C.E. Alonso, J.M. Arias, and A. Vitturi, Phys. Rev. C 75, 064316 (2007).
- (14) C.E. Alonso, J.M. Arias, L. Fortunato, and A. Vitturi, Phys. Rev. C 79, 014306, (2009).
- (15) M. Böyükata, C.E. Alonso, J.M. Arias, L. Fortunato, and A. Vitturi, Phys. Rev. C 82, 014317, (2010).
- (16) M.A. Jafarizadeh, M. Ghapanvari, N. Fouladi, Phys. Rev. C 92, 054306, (2015).
- (17) F. Iachello, A. Leviatan, and D. Petrellis, Phys. Lett. B 705, 379, (2011).
- (18) D. Petrellis, A. Leviatan, and F. Iachello, Ann. Phys. (NY) 326, 926, (2011).
- (19) K. Nomura, T. Niks̆ić, D. Vretenar, Phys. Rev. C 94, 064310, (2016).
- (20) K. Nomura, T. Niks̆ić, D. Vretenar, Phys. Rev. C 96, 014304, (2017).
- (21) S. Quan, Z.P. Li, D. Vretenar, and J. Meng, Phys. Rev. C 97, 031301(R), (2018).
- (22) Yu Zhang, L. Bao, Xiu Guan, Feng Pan, J.P. Draayer, Phys. Rev. C 88, 064305, (2013).
- (23) Yu Zhang, Feng Pan, Yu-Xin Liu, Yan-an Luo, and J.P. Draayer, Phys. Rev. C 88, 014304, (2013).
- (24) Yu Zhang, Feng Pan, Yu-Xin Liu, Zan-Feng Hou, and J.P. Draayer, Phys. Rev. C 82, 034327, (2010).
- (25) Yu Zhang, Xin Guan, Yin Wang, Yan Zuo, Li-Na Bao, and Feng Pan, Chin. Phys. 39, 104103, (2015).
- (26) Xiang-Ru Yu, JingHu, Xiao-Hue Li, Si-Yu An, and Yu Zhang, Chin. Phys. 42, 034103, (2018).
- (27) D. Bucurescu and N.V. Zamfir, Phys. Rev. C 95, 014329, (2017).
- (28) D. Bucurescu and N.V. Zamfir, Bulg. J. Phys 44, 309, (2017).
- (29) F. Iachello and N.V. Zamfir, Phys. Rev. Lett. 92, 212501, (2004).
- (30) A.E.L. Dieperink, O. Scholten, and F. Iachello, Phys. Rev. Lett. 44, 1747, (1980).
- (31) Meng Wang, G. Audi, F.G. Kondev, W.J. Huang, S. Naimi and Xing Xu, Chin. Phys. 41, 030003, (2017).
- (32) I. Angeli, Yu.P. Gangrsky, K.P. Marinova, I.N. Boboshin, S.Yu. Komarov, B.S. Ishkanov, and V.V. Varlamov, J. Phys. G 36, 085102 (2009).
- (33) I. Angeli and K.P. Marinova, J. Phys. G 42, 055108 (2015).
- (34) I. Angeli and K.P. Marinova, At. Data Nucl. Data Tables 99, 69 (2013).
- (35) E.A. McCutchan, N.V. Zamfir, and R.F. Casten, Phys. Rev. C 69, 064306, (2004).
- (36) D. Bonatsos, E.A. McCutchan, R.F. Casten, and R.J. Casperson, Phys. Rev. Lett. 100, 142501, (2008).
- (37) N.V. Zamfir, R.F. Casten, M.A. Caprio, C.W. Beausang, R. Krücken, J.R. Novak, J.R. Cooper, G. Cata-Danil, and C.J. Barton, Phys. Rev. C 60, 054312, (1999).
- (38) Yu Zhang, Zhan-feng Hou, Yu-xin Liu, Phys. Rev. C 76, 011305(R), (2007).
- (39) J.L. Wood, E.F. Zganjar, C. De Coster, and K.L.G. Heyde, Nucl. Phys. A 651, 323, (1999).
- (40) P. von Brentano, V. Werner, R.F. Casten, C. Scholl, E.A. McCutchan, R. Krücken, and J. Jolie, Phys. Rev. Lett. 93, 152502, (2004).
- (41) J. Wiederhold, R. Kern, C. Lizarazo, N. Pietralla, V. Werner, R.V. Jolos, D. Bucurescu, N. Florea, D. Ghiţă, T. Glodariu, R. Lică, N. Mărginean, R. Mărginean, C. Mihai, R. Mihai, I.O. Mitu, A. Negret, C. Niţă, A. Olacel, S. Pascu, L. Stroe, S. Toma, and A. Turturică, Phys. Rev. C 94, 044302, (2016).
- (42) R. Fossion, C.E. Alonso, J.M. Arias, L. Fortunato, and A. Vitturi, Phys. Rev. C 76, 014306, (2007).
- (43) Yu Zhang and F. Iachello, Phys.Rev. C 95, 034306 (2017).
- (44) D.A. Meyer, V. Wood, R.F. Casten, C.R. Fritzpatrick, G. Graw, D. Bucurescu, J. Jolie, P. von Brentano, R. Hertenberger, H.-F. Wirth, N. Braun, T. Faestermann, S. Heinze, J.L. Jerke, R. Krücken, M. Mahgoub, O. Möller, D. Mücher, and C. Scholl, Phys. Lett. B 638, 44, (2006).
- (45) P. Cejnar and J. Jolie, Phys. Rev. E 61, 6237, (2000).
- (46) D.A. Meyer, V. Wood, R.F. Casten, C.R. Fitzpatrick, G. Grawm D. Bucurescu, J. Jolie, P. von Brentano, R. Hertenberger, H.-F. Wirth, N. Braun, T. Faestermannn, S. Henize, J.L. Jerke, R. Krücken, M. Mahgoub, O. Möller, D. Mücher, and C. Scholl, Phys. Rev. C 74, 044309, (2006).
- (47) T. von Egidy and D. Bucurescu, Phys. Rev. C 80, 054310 (2009).
- (48) A. Gilbert and A. G. W. Cameron, Can. J. Phys. 43, 1446 (1965); P. J. Brancazio and A. G. W. Cameron, ibid. 47, 1029 (1969).
- (49) R. Capote, M. Herman, P. Obloz̆inský, P.G. Young, S. Goriely, T. Belgya, A.V. Ignatyuk, A.J. Koning, S. Hillaire, V.A. Plujko, M. Avrigeanu, O. Bersillon, M.B. Chadwick, T. Fukahori, Zhigang Ge, Yinlu Han, S. Kailas, J. Kopecky, V.M. Maslov, G. Reffo, M. Sin, E.Sh. Soukhovitskii, and P. Talou, Nucl. Data Sheets 110, 3107 (2009).
- (50) J.M. Pearson, Hyperfine Inter., 132, 59, (2001).
- (51) R.B. Cakirli, R.F. Casten, and K. Blaum, Phys. Rev. C 82, 061306(R) (2010).
- (52) C. Kremer, S. Aslanidou, S. Bassauer, M. Hilcker, A. Krugmann, P. von Neumann-Cosel, T. Otsuka, N. Pietralla, V.Yu. Ponomarev, N. Shimizu, M. Singer, G. Steinhilber, T. Togashi, Y. Tsunoda, V. Werner, and M. Zweidinger, Phys. Rev. Lett. 117, 172503 (2016).
- (53) T. Togashi, Y. Tsunoda, T. Otsuka, and N. Shimizu, Phys. Rev. Lett. 117, 172502 (2016).
- (54) Y. Tsunoda, T. Otsuka, N. Shimizu, M. Honma, and Y. Utsuno, Phys. Rev. C 89, 031301(R) (2014).
- (55) E. Clément, M. Zielińska, S. Péru, H. Goutte, S. Hilaire, A. Görgen, W. Korten, D.T. Doherty, B. Bastin, C. Bauer, A.Blazhev, N. Bree, B. Bruyneel, P.A. Butler, J. Butterworth, J. Cederkäll, P. Delahaye, A. Dijon, A. Ekström, C. Fitzpatrick, C. Fransen, G. Georgiev, R. Gernhäuser, H. Hess, J. Iwanicki, D.G. Jenkins, A.C. Larsen, J. Ljungvall, R. Lutter, P. Marley, K. Moschner, P.J. Napiorkowski, J. Pakarinen, A. Petts, P. Reiter, T. Renstrom, M. Seidlitz, B. Siebeck. S. Siem, C. Sotty. J. Srebrny, I. Stefanescu, G.M. Tveten, J. Van de Walle, M. Vermeulen, D. Voulot, N. Warr, F. Wenander, A. Wiens, H. de Witte, and K. Wrzosek-Lipska, Phys. Rev. C 94, 054326 (2016).
- (56) K. Heyde, J. Jolie, R. Fossion, S. De Baerdemacker, and V. Hellemans, Phys. Rev. C 69, 054304 (2004).
- (57) R. Krücken, B. Albanna, C. Bialik, R.F. Casten, J.R. Cooper, A. Dewald, N.V. Zamfir, C.J. Barton, C.W. Beausang, M.A. Caprio, A.A. Hecht, T. Klug, J.R. Novak, N. Pietralla, and P. von Brentano, Phys. Rev. Lett. 88, 232501 (2002).
- (58) R.F. Casten and N.V. Zamfir, Phys. Rev. Lett. 87, 052503 (2001); W. D. Kulp, J. L. Wood, P. E. Garrett, C. Y. Wu, D. Cline, J. M. Allmond, D. Bandyopadhyay, D. Dashdorj, S. N. Choudry, A. B. Hayes, H. Hua, M. G. Mynk, M. T. McEllistrem, C. J. McKay, J. N. Orce, R. Teng, and S. W. Yates, Phys. Rev. C 77, 061301(R) (2008).
- (59) D. Tonev, A. Dewald, T. Klug, P. Petkov, J. Jolie, A. Fitzler, O. Möller, S. Heinze, P. von Brentano, and R.F. Casten, Phys. Rev. C 69, 034334 (2004).
- (60) O. Möller, A. Dewald, P. Petkov, B. Saha, A. Fitzler, K. Jessen, D. Tonev, T. Klug, S. Heinze, J. Jolie, P. von Brentano, D. Bazzacco, C.A. Ur, E. Farnea, M. Axiotis, S. Lunardi, G. de Angelis, D.R. Napoli, N. Marginean, T. Martinez, M.A. Caprio, and R.F. Casten, Phys. Rev. C 74, 024313 (2006).
- (61) R.M. Clark, M. Cromaz, M.A. Deleplanque, M. Descovich, R.M. Diamond, P. Fallon, R.B. Firestone, I.Y. Lee, A.O. Macchiavelli, H. Mahmud, E. Rodirguez-Vieitez, F.S. Stephens, and D. Ward, Phys. Rev. C 68, 037301 (2003).
- (62) E.A. McCutchan, N.V. Zamfir, R.F. Casten, M.A. Caprio, H. Ai, H. Amro, C.W. Beausang, A.A. Hecht, D.A. Meyer, and J.J. Ressler, Phys. Rev. C 71, 024309 (2005).
- (63) J.E. García-Ramos, J.M. Arias, J. Barea, and A. Frank, Phys. Rev. C 68, 024307 (2003).
- (64) F. Iachello and P. Van Isacker, The Interacting Boson-Fermion Model (Cambridge University Press, Cambridge, 1991).
- (65) R.F. Casten, N.V. Zamfir, and D.S. Brenner, Phys. Rev. Lett. 71, 227 (1993).
- (66) R.F. Casten, Dimitri Kusnezov, and N.V. Zamfir, Phys. Rev. Lett. 82, 5000 (1999)
- (67) A. Wolf, R.F. Casten, N.V. Zamfir, and D.S. Brenner, Phys. Rev. C 49, 802 (1994).
- (68) Evaluated Nuclear Structure Data File (ENSDF), maintained by the National Nuclear Data Center, Brookhaven National Laboratory (http://www.nndc.bnl.gov/ensdf).
- (69) D. Bucurescu, E. Drăgulescu, S. Pascu, H-T. Wirth, D. Filipescu, G. Căta-Danil, I. Căta-Danil, D. Deleanu, K. Eppinger, T. Faestermann, D.G. Ghiţă, T. Glodariu, R. Hertenberger, M. Ivaşcu, R. Krücken, N. Mărginean, R. Mărginean, C.Mihai, A. Negret, T. Sava, L. Stroe, K. Wimmer, and N.V. Zamfir, Phys. Rev. C 85, 017304 (2012).