Rotation in the NGC 1333 IRAS 4C Outflow
Abstract
We report molecular line observations of the NGC 1333 IRAS 4C outflow in the Perseus Molecular Cloud with the Atacama Large Millimeter/Submillimeter Array. The CCH and CS emission reveal an outflow cavity structure with clear signatures of rotation with respect to the outflow axis. The rotation is detected from about 120 au up to about 1400 au above the envelope/disk mid-plane. As the distance to the central source increases, the rotation velocity of the outflow decreases while the outflow radius increases, which gives a flat specific angular momentum distribution along the outflow. The mean specific angular momentum of the outflow is about 100 . Based on reasonable assumptions on the outward velocity of the outflow and the protostar mass, we estimate the range of outflow launching radii to be au. Such a launching radius rules out that this outflow is launched as an X-wind, but rather, it is more consistent to be a slow disk wind launched from relatively large radii on the disk. The radius of the centrifugal barrier is roughly estimated, and the role of the centrifugal barrier in the outflow launching is discussed.
1 Introduction
Outflows play an important role in the star formation process, as they remove the angular momentum from the accretion disks, allowing the material accreting to the protostars. The outflows are believed to be driven magneto-centrifugally from the disk, but the detailed mechanism of outflow launching is not completely understood. Theoretical models differ in where the outflow is launched, ranging from the innermost region of a disk close to the protostar (X-winds; e.g. Shu et al. 2000), to a wider range of radii on the disk surface (disk winds; e.g. Königl & Pudritz 2000). It is difficult to directly observe the launching area which is quite small even in the case of disk winds. However, the amount of angular momentum that an outflow transfers away from the disk depends on the launching radius and disk size. Therefore, by measuring the outflow rotation, one can constrain the launching radii of the outflow. Using such a method, recent observations have suggested that the low-velocity outflows with wide opening angles are launched from about au on the disk, as the disk wind model predicts (e.g. Bjerkeli et al. 2016; Hirota et al. 2017; Lee et al. 2018), and the high-velocity collimated jet may be launched from the innermost region of the disk, as an X-wind would suggest (e.g. Lee et al. 2017). Some observation has also suggested that the axial jet and the wider slow outflow may be different parts of the same disk wind, which is launched throughout the disk from the innermost region up to the outer disk (e.g. Tabone et al. 2017).
In this paper, we report our recent observations of the NGC 1333 IRAS 4C star-forming region with the Atacama Large Millimeter/Submillimeter Array (ALMA), which reveal a rotating molecular outflow. Our target IRAS 4C is a low-mass protostar (; Enoch et al. 2009; Sadavoy et al. 2014; Tobin et al. 2016) located in the NGC 1333 star-forming region in the Perseus Molecular Cloud at a distance of 235 pc (Hirota et al. 2008). It is classified as a Class 0 source based on its bolometric temperature of (Enoch et al. 2009; Sadavoy et al. 2014; Young et al. 2015; Tobin et al. 2016). IRAS 4C lies 47 northeast of the IRAS 4A star-forming region, and 54 north-northeast of the IRAS 4B star-forming region. Koumpia et al. (2016) pointed out that IRAS 4C may actually lie slightly in front of the IRAS 4A/B regions, since absorption features seen in IRAS 4A/B coincide in velocity with the emission features of IRAS 4C. This is also supported by the fact that IRAS 4A/B systems have a systemic velocity of about , while IRAS 4C has a systemic velocity of about (Higuchi et al. 2017). Note that, IRAS 4B’ (a.k.a IRAS 4BE or IRAS 4B II), the source 10 east of IRAS 4B, has been sometimes called IRAS 4C as well. (e.g. Looney et al. 2000; Plunkett et al. 2013), but more often IRAS 4C is used for the source in this paper (e.g. Sandell & Knee 2001; Hatchell et al. 2005; Tobin et al. 2016).
C18O observations revealed a rotational structure in the north-south direction at the center of IRAS 4C, but whether the rotation is Keplerian or not is not known due to the low S/N (Tobin et al. 2015). Spitzer IRAC observations show an outflow cavity structure highlighted by scattered light and shocked emission to the east side of the central source, with the west side being much fainter (Figure 19 of Tobin et al. 2015). The east side is therefore inferred to be the blue-shifted side, because the blue-shifted outflow cavity tends to be brighter than the red-shifted cavity in NIR and MIR since it is less extincted. Despite the outflow cavity structure seen in infrared, there was no clear evidence of a molecular outflow from (sub-)mm observations. Previous 12CO observations either reported no detection of outflow emission toward this source (Plunkett et al. 2013; Tobin et al. 2015) or only weak compact blue-shifted emission towards east of the continuum source (Stephens et al. 2018). One possible explanation for the weak 12CO outflow emission is that the outflow lies close to the plane of sky, so that the low-velocity outflow emission is easily mixed with the emission of the ambient gas, especially for abundant species like 12CO. Indeed, the inclination of the source is estimated to be nearly edge-on (Tobin et al. 2015) to about between the disk plane and the line of sight (Segura-Cox et al. 2016). On the other hand, the 13CO emission reveal a compact () structure with the blue-shifted emission slightly offset to the east of the red-shifted emission, which was explained as a slow outflow (Koumpia et al. 2016). Here we report that the outflow cavity structure is clearly detected in the CCH and CS emissions, with kinematics consistent with rotation with respect to the outflow axis. This allows us to measure the angular momentum distribution in the outflow, and further constrain its launching radii and launching mechanism.
2 Observations
This source was observed as a part of the Perseus ALMA Chemical Survey (PEACHES; ALMA project 2016.1.01501.S; PI: N. Sakai) for 37 protostellar sources in the Perseus Molecular Cloud. The observations were carried out in ALMA band 6 for four times from Nov. 26 to Nov. 30, 2016. 40 to 42 antennas were used and the baselines range from 15 to 700 m. The total integration time per source is 10 min. J0237+2848 was used as the bandpass calibrator, J0238+1636 was used as the flux calibrators, and J0336+3218 was used as the phase calibrator. The source was observed with single pointing, and the primary beam size (half power beam width) is 22.9 at Band 6. The molecular lines were observed with velocity resolutions of about 0.14 . In this paper, we focus on the CCH lines, as well as the and lines (see Table 2). Two hyperfine lines ( and ) of the CCH transition were detected. The SiO line was also observed simultaneously, but not detected. In addition, a spectral window with a bandwidth of 938 MHz was used to map the 1.3 mm continuum. The data were calibrated and imaged in CASA (McMullin et al. 2007). Self-calibration to the phase and amplitude was performed using the continuum data after the normal calibration, and applied to the molecular line data. The CLEAN algorithm was used to image the data. For the spectral data we defined its own clean region for each channel, encircling the area with the brightest emission. Robust weighting with the robust parameter of 0.5 was used in the clean process. The resulting synthesized beam of the continuum data is (), corresponding to about . The synthesized beams of the molecular line data are summarized in Table 2. The largest recoverable scale is about . The continuum peak is derived to be at , .
3 Results
3.1 Distribution
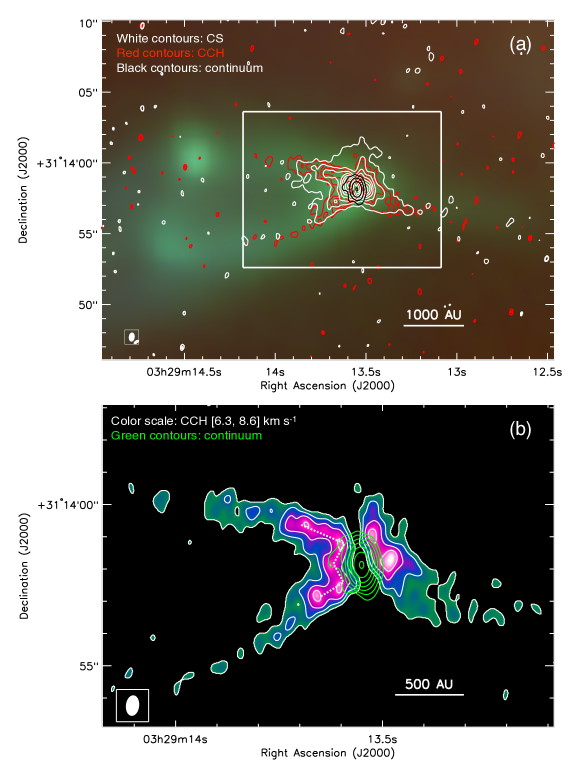
Figure 1 shows the integrated maps of and emissions. The CCH line has very similar distribution as the line shown in the figure, but with slightly lower intensity. The CCH emission shows a cavity structure with its base at the position of the central source and extending toward the east. The morphology of this cavity structure is consistent with the outflow cavity seen in mid-IR continuum. The eastern lobe of the CCH outflow cavity appears to be highly axisymmetric. The position angle of this outflow axis is 96∘, which is consistent with that estimated from the MIR images on a larger scale (Tobin et al. 2015). In contrast to the eastern side, the outflow cavity structure in the western side is incomplete. The CCH emission is more concentrated toward the center and only the southern cavity is seen. The asymmetry seen in the CCH line emission is very similar to that in MIR emissions, suggesting that, in addition to the extinction, the material distribution may be indeed asymmetric on the two sides of the outflows. One possibility is that the western lobe is affected by the red-shifted outflows from IRAS 4A. However, it is hardly the case if IRAS 4C is actually in front of IRAS 4A as suggested by Koumpia et al. (2016). In any case, we focus our discussion on the eastern lobe of the outflow in this paper.
Close to the protostar, the continuum emission shows an elongated structure with its major axis perpendicular to the outflow axis, which is consistent with the scenario that the continuum emission traces an envelope/disk system around the protostar. The size of the continuum source is determined to be () with . The total continuum flux above within a radius of 2 is 95 mJy, which corresponds to a mass of 0.061 , assuming a temperature of 30 K, dust opacity of Ossenkopf & Henning 1994 (), and the standard gas-to-dust mass ratio of 100. Along the major axis of the continuum emission (i.e. the mid-plane of the envelope/disk system assuming an edge-on inclination), there is a lack of CCH emission (see Figure 1b). The CCH emission highlights only the surface of the disk-like structure.
Compared with the CCH emission, the CS emission is more concentrated toward the central source. Although it also traces the cavity structure of the outflow, a large amount of emission comes from inside the apparent cavity highlighted by the CCH emission. Close to the protostar, there are two emission peaks to the east and west of the continuum emission, i.e. above and below the mid-plane of the disk-like structure. However, these emission peaks are closer to the mid-plane than the CCH emission. Unlike the CCH emission, the CS emission also exists along the mid-plane and further extends to the south and north of the continuum emission.
3.2 Outflow Cavities
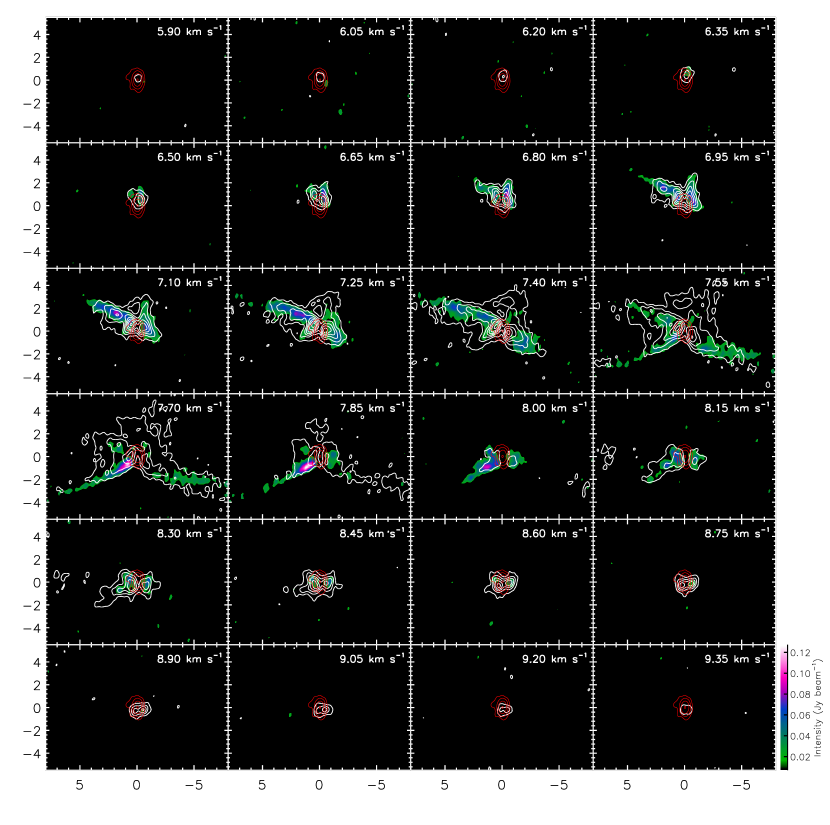
Figure 2 shows the channel maps of the and emissions. The outflow cavity structures are mostly detected within the velocity range of . There is little velocity difference between the eastern side and the western side of the outflow, which, combined with the low velocity of the molecular outflow, is consistent with a nearly edge-on inclination. However, there is clear velocity differences between the northern cavity wall of the outflow and the southern cavity wall, which is best seen in the eastern lobe in the CCH emission.
In the CCH emission, at the blue-shifted velocity , the northern cavity wall of the eastern lobe first appears from the bottom of the cavity close to the central source. From to , this structure extends away from the center to the east, and reaches its maximum at . At , both the northern and southern cavity walls are seen to have their maximum lengths. We believe that this velocity corresponds to the central velocity of the eastern lobe. At the red-shifted velocity to , the northern cavity wall disappears, and the emission in the southern cavity wall retreats from far away to the nearby region of the central source. To sum up, in the eastern lobe, the low velocity CCH emission traces full length of the outflow cavity while the high velocity emission only traces the base of the outflow cavity, and the northern cavity wall is blue-shifted while the southern cavity wall is red-shifted. Such a behavior can be easily explained by a rotating outflow, with lower rotation velocity far away from the central source at a larger radius from the outflow axis, and higher rotation velocity closer to the central source at a smaller radius from the outflow axis. Such distribution of rotation velocity is consistent with a constant specific angular momentum in the outflow. The western outflow cavity shows similar behavior, but is not as clear as the eastern cavity due to its incomplete structure. The CS emission also follows such a behavior. However, the rotation signature is not as prominent as the CCH emission, because the CS emission is not only highlighting the projected boundary of the outflow cavity. It is worth noting that the outflow cavity walls do not start from the position of the central source (i.e. the continuum peak), but instead from a position slightly offset from the central source. The northern cavity wall seen in the CCH emission starts from about to the north of the continuum peak (best seen in the channel map of ), and the southern cavity wall starts from about to the south of the continuum peak (best seen in the CCH channel map of ). Therefore the general morphology of the CCH emission is similar to a W-shape (see the white dotted line in Figure 1b), instead of a V or U-shape usually seen in molecular outflows in larger scale observations. This W-shape structure indicates that the outflow traced by CCH is not launched from the innermost region of the disk but a certain distance from the central star. However, the current resolution is not high enough for direct analysis of this launching region.
3.3 Envelope and Disk
As Figure 1 shows, the CCH emission is missing on the mid-plane of the disk/envelope structure, while the CS emission exists on the mid-plane and further extends to the south and north of the continuum emission. Such differences can be seen in the high-velocity channels of Figure 2. At high velocities of and , the CCH emission is concentrated in the vicinity of the central protostar, but always has some offsets with respect to the mid-plane of the disk-like structure (major axis of the continuum). The CS emission has similar behaviors, showing two peaks on the two sides of the continuum structure, but at even higher velocities ( and ), the CS emission is peaked on the mid-plane and closer to the central source. These differences suggest that, although in this source the CS emission is mostly tracing the same material as the CCH emission, it also traces the infalling material in the mid-plane which reaches closer to the central source and has higher velocities from the rotation of the inner envelope or disk. We will discuss such kinematic features of CS in more details in §4.3. The different behaviors of the CCH and CS emissions indicate that there is a lack of CCH molecule on the envelope/disk mid-plane, although the optical depth effect may also have contributed. CCH is a reactive radical, and hence can be easily destroyed in a high density condition of the mid-plane. Meanwhile, the radiation from the protostar may further enhance the CCH formation in the dense photodissociation region on the surface of the disk or envelope (e.g. Pety et al. 2005; Oya et al. 2017; Imai et al. 2016). On the other hand, the CS molecule is relatively more stable and may exist in the mid-plane toward the protostar.
4 Discussions
4.1 Outflow or Infall?
Before we go into the kinematics of the outflow, we would like to argue that the CCH emission showing the outflow cavity structure actually traces the outflowing gas along the outflow cavity, rather than the infalling gas surrounding the outflow cavity. From the point of view of the CCH kinematics, the median velocity of the eastern CCH lobe is (see §4.2.2), which is blue-shifted compared to the median velocities of the envelope traced by CS and SO emissions (see §4.3). This is consistent with the scenario that CCH traces outflowing gas, since the blue-shifted 12CO outflow lobe is also seen towards the east of the central source (Stephens et al. 2018). In addition to this, we detect coherent rotation pattern from the inner region up to a large distance and high latitude (up to 1500 au at a polar angle of about ). This is also consistent with an outflow, since the rotation pattern in the outflow can be well preserved due to the magnetic fields in the wind launching. On the other hand, the rotation pattern of an infalling envelope gas with may be affected by the turbulence, the unsmooth and anisotropic distribution of the envelope material, or the change in direction of accretion.
From the point of view of chemical origin of CCH, there are mainly two mechanisms to form CCH in such protostellar sources. First, CCH can be formed in photodissociation regions created by the UV radiation from the central protostar (e.g. Pety et al. 2005), so it often traces the cavity walls of low velocity outflows (e.g. Oya et al. 2014, 2018). In those cases, the CCH emission shows kinematics consistent with outflow rather than infall. Second, CCH is also formed in the envelope via warm carbon-chain chemistry (WCCC; Sakai & Yamamoto 2013), and in some cases it mainly traces the infalling envelope (e.g. Sakai et al. 2014a), which also has rotation with conserved angular momentum. But in such cases, the CCH emission has intensity peaks along the mid-plane of the inner envelope, although the excitation condition affects its intensity profile to some extent (e.g. Sakai et al. 2014a, b; Oya et al. 2015, 2016, 2017). Therefore, the CCH emission in this source, at least in the part distant from the disk mid-plane, is most likely tracing the outflowing gas. However, at the base of the outflow cavity, it is still possible that some fraction of the CCH emission traces the gas on the surfaces of the disk and/or inner envelope.
We note that such a scenario may be further complicated by the interferometric effect. Compared with the observation of the same transitions of CCH by the IRAM 30 m telescope (Higuchi et al. 2017), our ALMA observation covers about 1/3 of the single dish fluxes. The missing flux is most likely associated with the extended envelope which is resolved out in the ALMA observation (the largest recoverable scale is about 1000 au in the observation). However, the CCH emission in the extended envelope along the outflow cavity wall may not be resolved out but may be even emphasized by the interferometric effect. As mentioned above, the CCH gas motion in this source is outflowing, and hence, even if the CCH molecules are formed in the extended envelope, they have already been entrained into the outflow. Therefore we can still study outflow kinematics by the CCH emissions.
As partly discussed above, there are two possible phenomena, which the outflowing CCH gas traces. The first is that the CCH traces the magneto-centrifugal wind launched from the disk. The second is that the CCH traces an entrained outflow, composed of envelope material accelerated by the magneto-centrifugal wind. For an entrained outflow, its momentum and angular momentum distributions not only depend on the momentum and angular momentum distributions in the magneto-centrifugal wind that accelerated it, but are also affected by its original density distribution in the envelope, especially the angular momentum distribution, since the rotation velocities of a magneto-centrifugal wind are usually much lower than its poloidal velocities. Therefore, the fact that we detect clear and smooth distribution of rotation over a large distance suggests that what we detected is unlikely to be an entrained outflow. On the other hand, if the magneto-centrifugal wind is launched from a relatively large radius (e.g. ) on the disk, its velocity can be at levels of a few tens of or lower. Combined with the very low inclination, it is still consistent with the observed low velocities (see discussions in §3.2). For a distance of 200 au () above the disk and an outflow velocity of , the dynamical timescale is about years, which is comparable to the timescale to form molecules in the photodissociation regions (e.g. Sakai & Yamamoto 2013). Therefore, the CCH molecules can form locally in the outflow. However, close to the bottom of the outflow cavity, the CCH molecules may be formed on the disk surface due to UV radiation and launched into the outflow. Below, we will discuss the outflow rotation based on the assumption that the CCH emission traces a magneto-centrifugal wind launched from the disk.
4.2 Outflow Rotation
4.2.1 Position-Velocity Diagrams of the Outflow
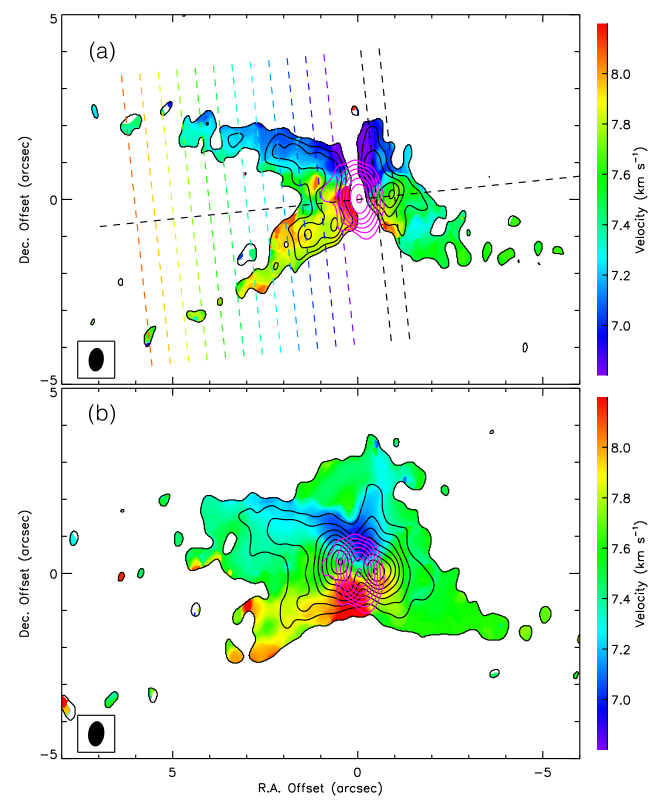
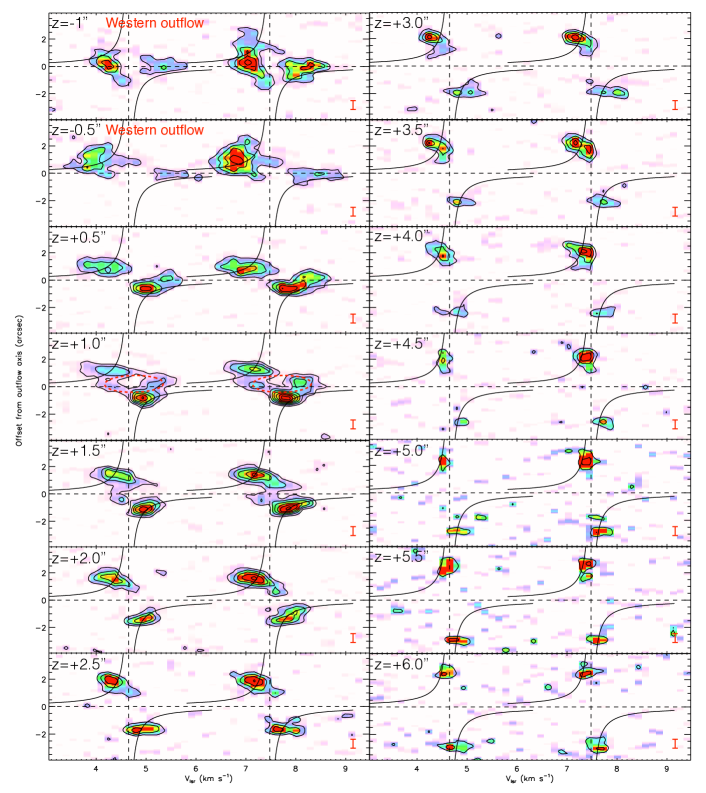
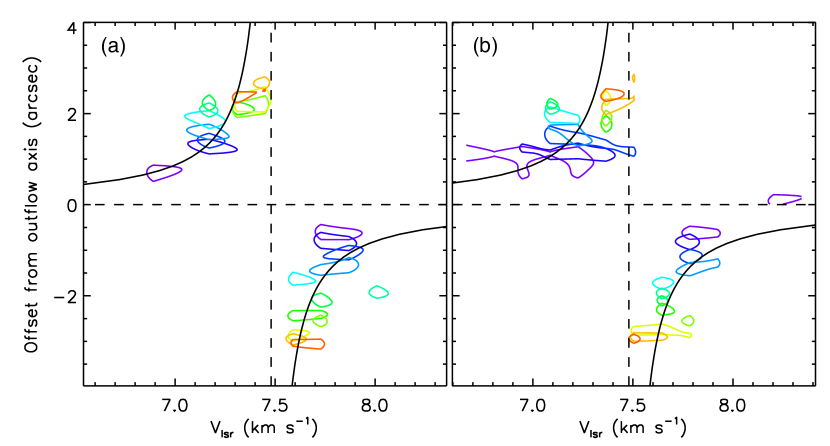
Figure 4 shows the position-velocity (PV) diagrams of the CCH emission in the eastern lobe and the base of the western lobe, along cuts perpendicular to the outflow axis (the cuts are shown in Figure 3). Here the outflow axis passes through the continuum peak and has a position angle of 96∘ to the north. Each cut has a width of 0.5 and has a distance to the central source ranging from to in the eastern lobe, and and in the western lobe. For the eastern lobe (), in each panel, the velocities of the emission peaks associated with the northern wall (positive offsets) and the southern wall (negative offsets) are symmetric with respect to a median velocity which is about 7.5 (the vertical dashed lines). This median velocity does not appear to change with , indicating a nearly constant forwarding velocity of the outflow (no acceleration or deceleration), or a nearly edge-on inclination. As we discussed in §3, the velocity difference between the northern and southern outflow cavity walls decreases with , while the position offset between the northern and southern outflow cavity walls increases with , indicating rotation with nearly constant angular momentum. A curve showing a constant angular momentum with respect to the outflow axis of 98 (0.42 arcsec ) is shown in each panel. Only the eastern lobe is used to determine such a value (see §4.2.2). The emission peaks in each PV diagram in the eastern lobe () follow this curve quite well. This is better illustrated by Figure 5, where we plot the emission peaks (defined as the peak intensities) of all panels with of Figure 4 in a single panel. The emission in the western lobe () appears to be also consistent with it.
Besides the emission associated with the outflow cavity walls, at (i.e. 120 au 240 au) from the envelope/disk mid-plane on both sides, there are blue and red-shifted emission inside the apparent outflow cavity around the position of axis (see Figure 4). These emissions correspond to the center part of the W-shape of the integrated emission seen in Figure 1. They can also be seen in the channel maps of and in Figure 2. These emissions, together with the emission associated with the cavity walls, form elliptical shapes in the PV diagrams (best seen in the panel of , labelled by red dashed ellipses). Such kinematic structure can be explained by both an expanding shell with rotation (e.g. Hirota et al. 2017), or infalling-rotating motion (e.g. Sakai et al. 2014b). Since the PV slice is 1 (235 au) above the envelope/disk mid-plane, and the kinematics smoothly changes to that of rotating outflow at a larger , we think that it is the expanding shell that produces such features. The fact that the expanding motion of the outflow shell is only prominent at low can be explained by the curvature of the outflow shell. At the base of the outflow cavity, along a line of sight toward the center of the outflow cavity, the outflowing motion is mostly in the line-of-sight direction, and also the column density of the molecule is higher due to the projection effect. However, we cannot rule out the possibility that this is caused by infalling motion of the envelope. At a height of (), it is possible that the CCH emission traces the boundary between the outflow and the infalling envelope. Currently, we lack enough spatial and velocity resolutions to disentangle such spatial and kinematic changes.
4.2.2 Angular Momentum in the Outflow
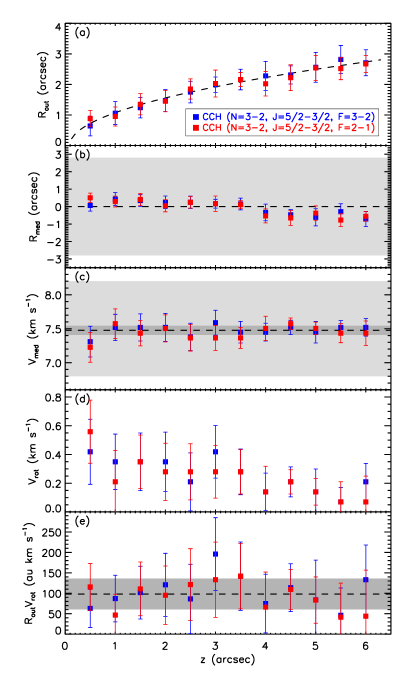
To be more quantitative, we derive some outflow properties in the following way. In each panel of Figure 4, i.e. at each distance to the disk/envelope mid-plane, we locate the emission peaks associated with the northern and southern outflow cavity walls, with their line-of-sight velocities to be and , and their offsets to the designated outflow axis to be and . We define as the radius of the outflow cavity, and as the distance from the mid-point between the northern and southern cavity walls to the chosen outflow axis. Assuming an edge-on inclination, the rotation velocity is , and the median line-of-sight velocity should only reflect the outflowing velocity. The specific angular momentum is then . Meanwhile, we calculate the velocity dispersions of the emission relative to and as the uncertainties in velocities, and similarly we employ the widths of the outflow cavity wall at each as the uncertainties of the position offset determination.
In Figure 6, we show the profiles of , , , , and . The shape of the CCH outflow cavity can be described by a parabolic function with both and in arcsec. In Panel (b), the distribution of suggests that the centers of the outflow cavity do not perfectly lie on the chosen outflow axis, although this deviation is small compared with the width of the outflow cavity. Such a deviation is not caused by the chosen position angle of the outflow axis, but it rather indicates that the axis of symmetry passes slightly to the north of the continuum peak, which can be seen to some extent from the integrated maps shown in Figure 1. While this may be caused by a slight asymmetry in the distribution of dust emission in the disk, it is also possible that this is caused by a small outflow precession. The median line-of-sight velocity of the outflow is quite flat except at , with a mean value of about 7.5 and standard deviation of 0.07 (excluding the data points at ). As discussed above, the nearly constant indicates that either the outflow has a nearly constant forwarding velocity, or the outflow is nearly on the plane of sky. Panel (d) shows that the rotation velocity decreases with the distance to the central source from about 0.5 at (120 au) to about 0.1 at (1400 au). Combining the increasing with and decreasing with , the specific angular momentum is largely flat. The mean value of the specific angular momentum is about 100 with a standard deviation of 40 .
4.2.3 Launching Radius of the Outflow
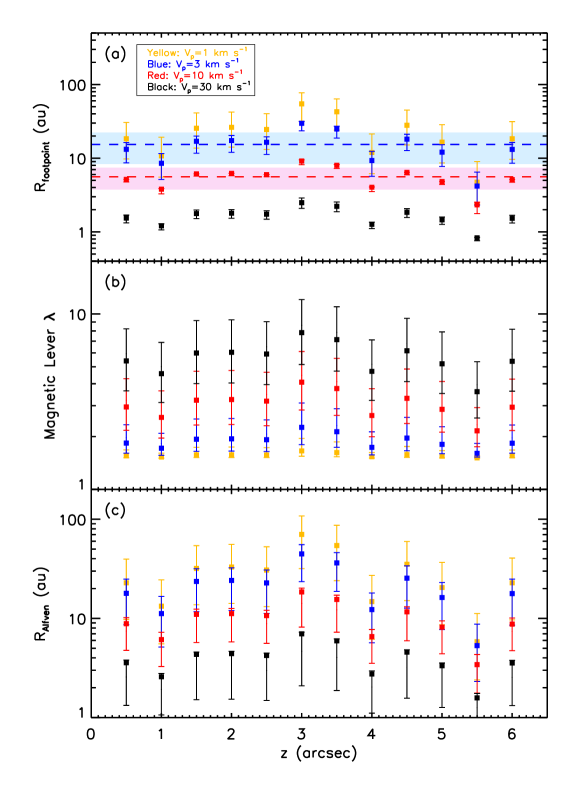
If the rotation signature that we detect originates from the rotation of a magneto-centrifugal wind launched from the accretion disk, the disk rotation rate at the outflow-launching region (and therefore the launching radius) can be constrained by the outflow radius , the rotation velocity , and the poloidal velocity of the outflow , combined with the protostellar mass , following the method of Anderson et al. (2003) (their Eq. 4). Such a method is valid for general magneto-centrifugal winds launched from the disk, independent of the detailed configuration of magnetic field (disk winds or X-winds). Panel (a) of Figure 7 shows the derived launching radii of the outflow using the measured and (averaging the measurements from the two hyperfine emissions of CCH).
We adopt four values of (1, 3, 10 and 30 ) in the calculation. As discussed in §4.3, the eastern lobe may be blue-shifted by about 0.3 in relative to the central envelope structure, assuming a small inclination angle of , the forwarding velocity of the outflow is about 3.5 . The forwarding velocity becomes 0.7 if the inclination angle is (Segura-Cox et al. 2016). An inclination higher than this is improbable for this source. On the other hand, Koumpia et al. (2016) found that, in 13CO emission, the peaks of the blue-shifted wing ( to ) and the red-shifted wing ( to ) have a small offset. If we use half of the velocity differences between blue and red wings as the projected outflow velocity, the forwarding velocity of the outflow is estimated to be about 15 , assuming . However, the outflow rotation, which is not resolved in their observations, can also contribute to the observed line width, and also the envelope material can contribute to the 13CO emission at these low velocities. A much higher outflow velocity is unlikely (e.g. ), because even with a very small angle of inclination, it can make noticeable velocity differences between the eastern and western lobes. Therefore, the chosen values of (1, 3, 10, and 30 ) cover a reasonable parameter space, with being more probable, and and as lower and upper limits. The protostellar mass of this system is also uncertain. The luminosity of the system () suggests that this is a protostar with a quite low mass. In §4.3, we obtain a mass estimation of about from the dynamics of the envelope/disk system, which we adopt as the fiducial value of the protostellar mass. We also use of 0.1 and 0.4 as the lower and upper limits for in the calculation, which are 2 times lower or higher than the fiducial value.
Figure 7(a) shows the derived outflow launching radii using these and . The derived launching radii are largely flat with the distances to the central source , i.e., the observed outflow at different distances is launched from similar radii on the disk. With the fiducial protostellar mass of , the outflow launching radii have a mean value of 15 au and a standard deviation of 7 au for the case of , and have a mean value of 5.6 au and a standard deviation of 1.8 au for the case of . A launching radius smaller than about 1 au is unlikely since it requires a high outflowing velocity. On the other hand, a launching radius larger than about 50 au is also unlikely, since it requires either a very low outflowing velocity or a much lower protostar mass. Therefore, the most likely launching radii of the outflow are about 5 to 15 au, with the uncertainties mostly due to the uncertainties in the outflow forwarding velocity. The flat distribution of the derived outflow launching radii with is due to the flat angular momentum distribution and the fact that a constant is adopted for different . If the outflow is accelerating, e.g. from about at lower to about at higher , the outflow at high should originate from a smaller radius (e.g. around 5 au) in the disk. In contrast, while the outflow at low should originate from a larger radius (e.g. around 15 au), which may indicate the growth of the outflow launching radius with time. Such scenarios need future observations to distinguish.
The derived launching radii ( au), even after considering the large uncertainties ( au) are consistent with disk wind models of magneto-centrifugal outflow (e.g. Königl & Pudritz 2000). In these models, the wind is launched from a wide range of radii on the disk, as opposed to X-wind models (e.g. Shu et al. 2000), in which the wind is launched from the very inner region of the disk (a few protostellar radii). Such launching radii are also similar to the observations of other rotating wide and slow () protostellar outflows, e.g. TMC1A (low mass Class I source, au; Bjerkeli et al. 2016), Orion Source I (massive protostar, au; Hirota et al. 2017), HH 212 (low mass Class 0 source, au according to Tabone et al. 2017, and au according to Lee et al. 2018), and HH 46/47 (low mass Class I source, au; Zhang et al. 2016). In the case of HH 212, the rotation in the inner jet has also been reported by Lee et al. (2017) with a derived au for the jet. Small launching radii typically are found in searches of jet rotation, ranging from a few to a few au (e.g. Lee et al. 2009; Choi et al. 2011; Chrysostomou et al. 2008; Coffey et al. 2007). Therefore, our results are consistent with a wide-angle disk wind launched from relatively large radii on the disk.
It is worth noting that the measured specific angular momentum in the outflow is only the kinetic part of the total specific angular momentum. The total specific angular momentum, including additional magnetic contribution, should be conserved along a streamline and equals to , where is the angular velocity of the Keplerian disk at the launching radius , and is the Alfvén radius where the poloidal velocity of the outflow along the streamline reaches the poloidal Alfvén speed. The ratio between the total specific angular momentum of the outflow and the specific angular momentum of the Keplerian disk at the launching radius is then , which is the magnetic lever arm that determines how much angular momentum is extracted from the disk. Following Eq. 10 of Ferreira et al. (2006), we derive the magnetic lever arm (Figure 7b) and then Alfvén radius (Figure 7c), from the measured angular momentum, and different assumed and . Previous studies show typical values of of disk wind ranging from a few to 20 (e.g. Ferreira et al. 2006; Tabone et al. 2017), which favors the cases with or higher. Such values of give the Alfvén radii ranging from a few au to about 50 au. Note that the derived Alfvén radii (see Figure 6, Panel a), which suggests that at these radii most of the angular momentum has been transferred to the rotation from the magnetic field (Ferreira et al. 2006). Therefore it is natural that the observed shows a flat distribution with .
4.3 Connection with the Envelope/disk Structure
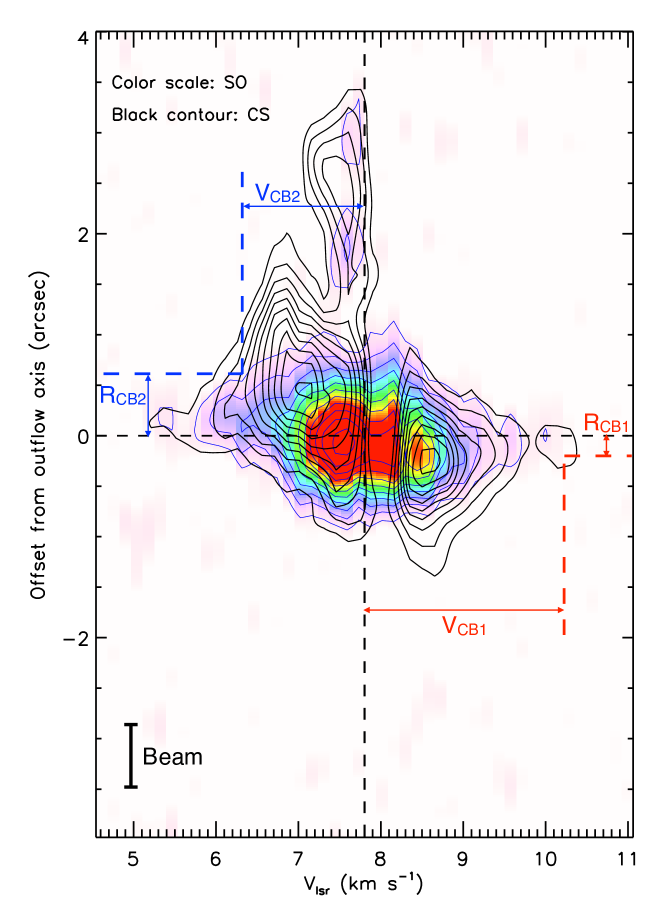
Figure 8 shows the PV diagrams of the and emissions along the mid-plane of the envelope/disk. While the SO emission is mostly concentrated within 1 from the continuum peak, the CS emission is broader toward the north and south. Toward the north, there is extended CS emission further outside of tracing the extended envelope. In contrast, such an envelope component is not seen in the south. These features may be due to the asymmetric distribution of envelope material or self-absorption. It has been shown that, while CS mostly traces the envelope outward of the centrifugal barrier of the infalling envelope, SO is enhanced at the centrifugal barrier (Sakai et al. 2014b; Oya et al. 2015) by accretion shocks liberating SO from dust grain surfaces to the gas phase. Therefore, it is natural that the SO emission is more confined around the protostar than CS. In such a case, the highest velocity seen in CS and its position could measure the velocity and radius of the centrifugal barrier. However, in some cases, CS can survive somewhat inside the centrifugal barrier (e.g. Oya et al. 2017) and also probe higher velocities in the disk. As Figure 8 shows, there is not enough spatial resolution to clearly distinguish these two scenarios. Even if the SO traces a higher velocity of the disk Keplerian rotation, it can be smeared out and mixed with the rotation of the inner envelope. On the other hand, since SO emission/abundance is enhanced due to the accretion shock around the centrifugal barrier, the radius of the SO enhanced emission can also suggest the radius of the centrifugal barrier.
Therefore, we estimate two sets of centrifugal barrier properties. In the first method, assuming that CS only traces the envelope outside of the centrifugal barrier, we use the highest velocity seen in CS and its position as the velocity and radius of the centrifugal barrier, which gives and , i.e. 50 au (the red lines and labels in Figure 8). In the second method, we use the outer radius of the SO emission and the maximum velocity at that radius as the velocity and radius of the centrifugal barrier (see Sakai et al. 2014a), assuming SO is only enhanced around the centrifugal barrier and inside. In this case, we obtain and , i.e. 140 au (the blue lines and labels in Figure 8). Following Sakai et al. (2014b), we then estimate the protostellar mass to be from both sets of estimations.
As discussed in §4.2.3, the launching radii of the outflow are estimated to be , which is smaller than the radius of the centrifugal barrier obtained above (). This is reasonable since the centrifugal barrier can be considered as the outer radius of the accretion disk. Some studies have indicated that the centrifugal barrier may play a role in the outflow launching (Sakai et al. 2017; Alves et al. 2017). However, it is not clear whether the centrifugal barrier is directly related to the outflow launching in this source, considering their different radii. The specific angular momentum at the centrifugal barrier is estimated to be , which is comparable to the mean specific angular momentum of the outflow (about ). However, since the location and velocity of the centrifugal barrier are only roughly estimated without resolving spatially, they would have large uncertainties. The possibility of a smaller centrifugal barrier radius which is closer to the outflow launching radii cannot be ruled out. Segura-Cox et al. (2016) estimated a disk radius of about 30 au for this source by fitting 8 mm continuum emission, which is closer to the outflow launching radii estimated here. Apparently, high angular resolution observations are needed.
Finally, we note that the median velocities of the envelope traced by CS and SO emissions are about , which is offset from the median velocities of of the eastern lobe (see Panel c of Figure 6), indicating that the eastern lobe is indeed slightly blue-shifted.
5 Conclusions
We present ALMA observations of the NGC 1333 IRAS 4C outflow, including CCH, CS and SO emission. Our main conclusions are as follows.
1) The outflow cavity structure is detected and resolved in the CCH and CS line emission. This is the first time that the molecular outflow associated with this source is clearly detected. The morphology of this molecular outflow coincides with the cavity structure seen in MIR emissions. While the CCH emission appears to mostly trace the outflow cavity structure, the CS emission traces the envelope. The morphology and kinematics of the molecular emission are consistent with an almost edge-on inclination of the disk, as previously speculated.
2) The observed velocity pattern of the CCH emission is dominated by the rotation of the outflow cavity walls around its axis. The contribution of the outward motion of the outflow is very minor due to the nearly edge-on inclination. The rotation is detected from about 0.5 (120 au) above the envelope/disk mid-plane up to the full extension of the CCH outflow at 6 (1400 au) from the central source. The velocity pattern is highly symmetric with respect to the outflow axis. The measured rotation velocity is about 0.5 at 0.5 above the disk, and smoothly decreases to about 0.1 at 6 above the disk. Because of the parabolic shape of the outflow cavity wall, the angular momentum of the outflow is nearly flat with the distance to the protostar. The mean specific angular momentum in the outflow is estimated to be about 100 .
3) From the derived angular momentum in the outflow, by assuming reasonable forwarding velocity of the outflow and protostellar mass, we infer the most likely launching radii of the outflow to be au. The derived launching radii are similar to those derived from observations of rotation in other wide slow molecular outflows. Such a range of launching radii is consistent with the picture of a disk wind in which the outflow is launched over a range of radii of the disk, as opposed to an X-wind in which the outflow is launched from the innermost region of the disk (typically a few protostellar radii).
4) From the CS and SO emission which traces the envelope and maybe disk, we roughly estimate a radius of the centrifugal barrier of about au and a specific angular momentum of about at the centrifugal barrier. Our current observations do not have enough resolution to resolve the transition from the envelope to the disk and clearly locate or even resolve the centrifugal barrier structure. Therefore the above estimated radius and specific angular momentum are highly uncertain. Thus, the higher angular resolution observations are needed in order to study connections between the outflow launching and the centrifugal barrier.
References
- Alves et al. (2017) Alves, F. O., Girart, J. M., Caselli, P., et al. 2017, A&A, 603, L3
- Anderson et al. (2003) Anderson, J. M., Li., Z.-Y., Krasnopolsky, R., Blandford, R. 2003, ApJL, 590, L107
- Bjerkeli et al. (2016) Bjerkeli, P., van der Wiel, M. H. D., Harsono, D., Ramsey, J. P. Jørgensen, J. K. 2016, Nature, 540, 406
- Choi (2001) Choi, M. 2001, ApJ, 553, 219
- Choi et al. (2011) Choi, M., Kang, M., Tatematsu, K, 2011, ApJL, 728, 34
- Chrysostomou et al. (2008) Chrysostomou, A., Bacciotti, F., Nisini, B., Ray, T. P., Eislöffel, J., Davis, C. J., Takami, M. 2008, A&A, 482, 575
- Coffey et al. (2007) Coffey, D., Bacciotti, F., Ray, T. P., Eisloffel, J., Woitas, J. 2007, ApJ, 663, 350
- Enoch et al. (2009) Enoch, M. L., Evans, N. J., Sargent, A. I., Glenn, J. 2009, ApJ, 692, 973
- Ferreira et al. (2006) Ferreira, J., Dougados, C., Cabrit, S. 2006, A&A, 453, 785
- Hatchell et al. (2005) Hatchell, J., Richer, J. S., Fuller, G. A., et al. 2005, A&A, 440, 151
- Higuchi et al. (2017) Higuchi, A., Sakai, N., Watanabe, Y., et al. 2017, submitted to ApJ
- Hirota et al. (2008) Hirota, T., Bushimata, T., Choi, Y. K., et al. 2008, PASJ, 60, 37
- Hirota et al. (2017) Hirota, T., Machida, M. N., Matsushita, Y., et al. 2017, Nat. Astron., 1, 0146
- Imai et al. (2016) Imai, M., Sakai, N., Oya, Y., et al. 2016, ApJ, 830, 37
- Königl & Pudritz (2000) Königl, A. & Pudritz, R. E., in Protostars and Planets IV (eds Mannings, V. et al.) 759-787 (Univ. Arizona Press, 2000)
- Koumpia et al. (2016) Koumpia, E., van der Tak, F. F. S., Kwon, W., et al. 2016, A&A, 595, 51
- Lee et al. (2009) Lee, C.-F., Hirano, N., Palau, A., Ho, P. T. P., Bourke, T. L., Zhang, Q., Shang, H. 2009, ApJ, 699, 1584
- Lee et al. (2017) Lee, C.-F., Ho, P. T. P., Li, Z.-Y., et al. 2017, Nat. Astron., 1, 0152
- Lee et al. (2018) Lee, C.-F., Li, Z.-Y., Codella, C., et al. 2018, ApJ, 856, 14
- Looney et al. (2000) Looney, L. W., Mundy, L. G., Welch, W. J. 2000, ApJ, 529, 477
- McMullin et al. (2007) McMullin, J. P., Waters, B., Schiebel, D., Young, W., & Golap, K. 2007, Astronomical Data Analysis Software and Systems XVI (ASP Conf. Ser. 376), ed. R. A. Shaw, F. Hill, & D. J. Bell (San Francisco, CA: ASP), 127
- Müller et al. (2005) Müller, H. S. P., Schlöder, F., Stutzki, J., Winnewisser, G. 2005, JMoSt, 742, 215
- Ossenkopf & Henning (1994) Ossenkopf, V., Henning, T. 1994, A&A, 291, 943
- Oya et al. (2015) Oya, Y., Sakai, N., Lefloch, B., et al. 2015, ApJ, 812, 59
- Oya et al. (2016) Oya, Y., Sakai, N., López-Sepulcre, A., et al. 2016, ApJ, 824, 88
- Oya et al. (2014) Oya, Y., Sakai, N., Sakai, T., et al. 2014, ApJ, 795, 152
- Oya et al. (2017) Oya, Y., Sakai, N., Watanabe, Y., et al. 2017, ApJ, 837, 174
- Oya et al. (2018) Oya, Y., Sakai, N., Watanabe, Y., et al. 2018, ApJ accepted, arXiv:1806.10298
- Pety et al. (2005) Pety, J., Teyssier, D., Fossé D., et al. 2005, A&A, 435, 885
- Plunkett et al. (2013) Plunkett, A. L., Arce, H. G., Corder, S. A., et al. 2013, ApJ, 774, 22
- Sadavoy et al. (2014) Sadavoy, S. I., Di Francesco, J., André, P., et al. 2014, ApJL, 787, L18
- Sakai et al. (2014a) Sakai, N., Oya, Y., Sakai, T., et al. 2014a, ApJL, 791, L38
- Sakai et al. (2014b) Sakai, N., Sakai, T., Hirota, T., et al. 2014b, Nature, 507, 78
- Sakai et al. (2017) Sakai, N., Oya, Y., Higuchi, A., et al. 2017, MNRAS, 467, L76
- Sakai & Yamamoto (2013) Sakai, N. & Yamamoto, S., 2013, ChRv, 113, 8981
- Sandell & Knee (2001) Sandell, G., Knee, L. B. G. 2001, ApJL, 546, 49
- Segura-Cox et al. (2016) Segura-Cox, D. M., Harris, R. J., Tobin, J., et al. 2016, ApJL, 817, L14
- Stephens et al. (2018) Stephens, I. W., Dunham, M. M., Myers, P. C., et al. 2018, ApJS accepted, arXiv:1806.07397
- Shu et al. (2000) Shu, F. H., Najita, J. R., Shang, H., Li, Z.-Y., in Protostars and Planets IV (eds Mannings, V. et al.) 789-814 (Univ. Arizona Press, 2000)
- Tabone et al. (2017) Tabone, B., Cabrit, S., Bianchi, E., et al. 2017, A&A, 607, L6
- Tobin et al. (2016) Tobin, J. J., Looney, L. W., Li, Z.-Y., et al. 2016, ApJ, 818, 73
- Tobin et al. (2015) Tobin, J. J., Looney, L. W., Wilner, D. J., et al. 2015, ApJ, 805, 125
- Young et al. (2015) Young, K. E., Young, C. H., Lai, S.-P., Dunham, M. M., Evans, N. J., II 2015, ApJ, 150, 40
- Zhang et al. (2016) Zhang, Y., Arce, H. G., Mardones, D., et al. 2016, ApJ, 832, 158
| Molecule | Transition | Frequency (GHz) | (K) | (D2) | Synthesized Beam |
|---|---|---|---|---|---|
| CCH | 262.0674690 | 25.2 | 1.067 | () | |
| CCH | 262.0649860 | 25.2 | 1.633 | () | |
| CS | 244.9355565 | 35.3 | 19.17 | () | |
| SO | 258.2558259 | 56.5 | 13.74 | () |