Resonant excitations of a Bose Einstein condensate in an optical lattice
Abstract
We investigate experimentally a Bose Einstein condensate placed in a 1D optical lattice whose phase or amplitude is modulated in a frequency range resonant with the first bands of the band structure. We study the combined effect of the strength of interactions and external confinement on the 1 and 2-phonon transitions. We identify lines immune or sensitive to atom-atom interactions. Experimental results are in good agreement with numerical simulations. Using the band mapping technique, we get a direct access to the populations that have undergone -phonon transitions for each modulation frequency.
Many recent cold atom experiments in optical lattices have demonstrated the usefulness of time-dependent modulation to probe or engineer single and many-body states ChuPRL ; ArimondoPRL ; Oberthaler ; NJP18 ; RMPEckardt ; am1 ; am2 ; Kollath ; probe2 ; mode1 ; transport1 ; transport2 ; PRXJean ; Lellouch18 ; Hofstadter ; Haldane ; sengstock . Shaken lattices have also many applications for atom interferometry interf1 ; interf2 ; interf3 . Using modulation frequencies in a range of values different from interband resonances has been used to renormalize the tunneling rate ChuPRL ; ArimondoPRL ; Oberthaler ; NJP18 ; RMPEckardt , to probe the Mott insulator - superfluid transition am1 ; am2 ; Kollath ; probe2 , to excite collective modes mode1 , to drive quantum transport transport1 ; transport2 , to endow a system with new properties including artificial gauge fields PRXJean ; Lellouch18 , or to create nontrivial topological band structures Hofstadter ; Haldane ; sengstock ; RMPEckardt to name a few.
For a large amplitude of modulation and a sufficiently deep optical lattice, the classical phase space becomes mixed. This regime has been investigated in the early 2000 to set up experiments dedicated to the observation of dynamical tunneling cat1 ; cat2 ; cat3 . For a modulation with a rich spectrum, the classical phase space even becomes fully chaotic, a regime that was used to investigate 3D Anderson localization anderson .
Resonant modulation favors interband transitions raizen94 ; simonet ; PRA2013 ; Interfero ; Lacki and band hybridization hy1 ; hy2 ; hy3 . It has been used as a spectroscopic calibration and for manipulation of wave packets raizen94 ; holder ; simonet ; PRA2013 ; arlt ; spectroscopy . Polychromatic resonant modulation has also been investigated revealing the possible interference between separated excitation paths coherentcontrol ; polycexc . However, such resonant modulation may cause heating RMPEckardt . A detailed understanding of resonant excitations appears essential to exploit the full potentialities of Floquet engineering RMPEckardt .
Furthermore, the band structure of a quantum gas in an optical lattice can be modified by atom-atom interactions. When the interaction energy is on the order of the lattice depth, the band structure exhibits a loop structure about the center of the Brillouin zone allowing for dynamical instabilities and possible hysteretic behavior loop1 ; loop2 ; loop3 ; loop4 .
In this article, we investigate experimentally and numerically resonant interband excitations in a Bose-condensed atomic cloud confined by a 1D modulated optical lattice in the presence of weak interactions. By weak interactions we mean that the interaction energy is significantly lower than the lattice depth. However, we find a clear signature of interactions in our spectrum studies whilst the band structure is not significantly modified by interactions. In this work, we put the emphasis on 1 and 2-phonon transitions.
The paper is organized as follows. In Sec. I, we provide an overview of the relevant features of our experimental setup. In Sec. II, we discuss the selection rules at work depending on the types of modulation (phase or amplitude modulation), along with their limitations. Section III provides the results of our numerical simulations and enables us to give some insight about the role of atom-atom interactions on the spectrum. The experimental spectra are then presented in Section IV. In Sec. V, we detail our experimental approach and analysis of the dynamics of the excited atoms.
I Overview of the lattice setup
The lattice results from the interference of two counter propagating laser beams originating from the same single mode laser (wavelength 1064 nm). The excitation is carried out either by phase or amplitude modulation. The lattice potential experienced by the rubidium-87 atoms reads
| (1) |
where nm is the lattice spacing. The depth is measured in units of the characteristic energy of the lattice through the dimensionless parameter : with footnote1 . The atoms also experience an external confinement provided by the hybrid trap in which the BEC is produced PRL2016 ; PRA2018 . Using one or two dipole beams for the hybrid trap, we have the possibility to change the angular frequency of this extra confinement by a factor 10 from Hz to Hz.
To engineer the phase and amplitude of the lattice, we proceed in the following manner: a 15 Watts single mode laser used for the optical lattice is first diffracted by an Acousto-Optic Modulator (AOM0), and then split into two beams having the same power. Each beam is subsequently diffracted by an AOM before entering into the cell chamber. Those two latter AOMs are driven by two phase-locked synthesizers that imprint their relative phase on the laser light. The modulation amplitude, , is realized by tuning the RF power of the AOM0 while the phase control on is achieved by an appropriate pre-programming of the synthesizers.
II Selection rules for phase and amplitude modulation
For a BEC adiabatically loaded into the static optical lattice , the wave function lies in the ground state band. Once the modulation is switched on, interband transitions can occur. The interband transition probability is proportional to the square modulus of the matrix element
| (2) |
where are the Bloch states, is the band index () and the quasi-momentum. Bloch states are usually rewritten in terms of the periodic Bloch functions, , as with . The matrix element (2) vanishes as soon as , because of the symmetries of the modulation potential and the properties of the Bloch function.
Phase and amplitude modulations do not obey the same selection rules for the transfer from a band of index to .
Consider a phase modulated optical lattice ( and ), the lattice potential reads
| (3) |
where is the first kind Bessel function of order . We first notice that the phase modulation renormalizes the depth of the lattice from to . However, for the amplitude of the phase modulation, , considered in this article footnote0 . As a result, the reasoning for the transition between bands can be performed on the bare lattice (with no modulation). In practice, only the first orders play a role since when is about zero.
For a homogeneous lattice, the Bloch functions et of two successive bands at have opposite parities. The last term of Eq. (3) is responsible for a non zero matrix element between those two successive Bloch functions:
| (4) |
The corresponding interband transition is therefore allowed as a 1-phonon process. Interestingly, the matrix element between bands having the same parity (still at ) does not vanish:
The first contributing term scales as revealing the underlying 2-phonon process.
In summary, the phase modulation enables 1-phonon transitions to bands with opposite parity (, , …), while the transition to bands with the same parity is allowed through a 2-phonon process.
For amplitude modulation () the strength of the transition is given by the matrix element of the modulating term between the Bloch functions. Only 1-phonon transitions between bands of identical parity are therefore allowed. We stress that those selection rules are only valid for and for a potential having a discrete translational symmetry. In practice, when a Bose-Einstein condensate is loaded into the lowest band it is not uniquely projected on , but has also components with the same weight on and with . Furthermore, the extra harmonic confinement superimposed to the lattice breaks the discrete translational symmetry.
III Numerical simulations
To confirm this qualitative analysis and conduct a first investigation of the role of interactions on the resonant excitations, we have performed numerical simulations of the 1D time-dependent Gross-Pitaevskii equation using the GPELab toolbox GPELab which solves the dimensionless equation
| (5) | |||||
The dimensionless time is normalized to with s for our parameters, , and . The value of the dimensionless interaction parameter is on the order of 0.8 for our experiments PRL2016 . In practice, we first determine the ground state through an imaginary time evolution for the static lattice potential of depth . We then use this state as an initial condition to run the evolution of the wave function under the time-dependent lattice potential (Eq. (5)).
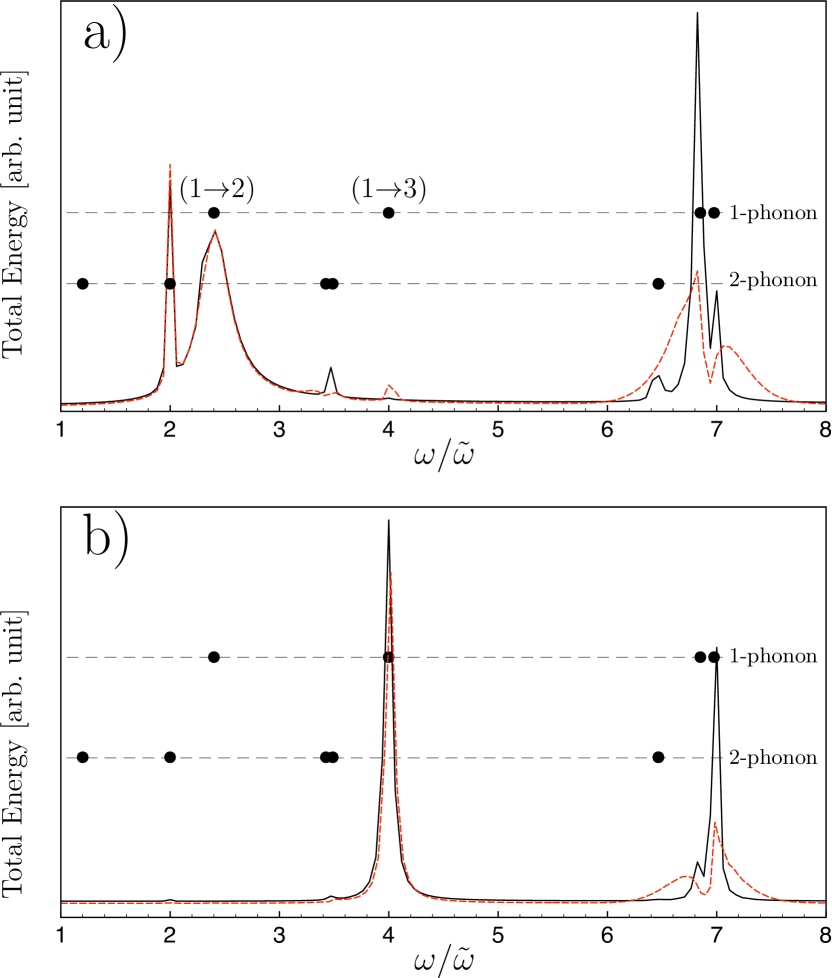
In Fig. 1, we plot the evolution of the total energy of the BEC for a fixed duration of the modulation time (100 in dimensionless unit) as a function of the normalized modulation frequency. The results are obtained for both phase (Fig. 1a) and amplitude (Fig. 1b) modulations, and in the absence (, dashed line) or presence (, solid line) of interactions. Black disks indicate the frequency of interband transitions at for 1 and 2-phonon transitions.
For phase modulation (Fig. 1a), the main peaks coincide with the expectation from the selection rules. For the investigated range of modulation frequencies, the main peaks are: (1) the 1-phonon transitions from band 1 (ground state) to 2 (), and from band 1 to 4 (), and (2) the 2-phonon transition from 1 to 3 (). Another less intense 2-phonon transition is observed at (from band 1 to 5). We also observe a few forbidden transitions: a small peak for the 1 to 3 transition () and a 1-phonon transition from 1 to 5 (). We have shown numerically that the amplitude of those small peaks decreases when the external confinement is weakened. This confirms that we can ascribe the violation of the selection rules to the breakdown of the translational invariance by the external confinement. Comparing the and energy spectra, we find that the 2-phonon transition at is unaffected by interactions. We have also checked that this line is immune to the value of the external confinement. Those results are consistent with our previous studies dealing with the intrasite dipole mode known to be independent of the strength of interactions PRL2016 ; PRA2018 . The phase modulation at this frequency simply excites this oscillatory mode. The interactions modify the other lines. For instance, the 1-phonon transition on the forbidden line at is washed out, or the 1-phonon transition on the 1 to 4 line () increases significantly and acquires a reduced width. Here the excitation drives the intrasite breathing mode. It means that such a line can be used a priori to monitor in situ the strength of the interactions.
As expected from the parity argument, the energy spectrum for amplitude modulation exhibits lines with opposite selection rules for 1-phonon lines as compared to phase modulation. Similarly to the phase modulation results, we get a transition whose strength is strongly affected by interactions (1-phonon transition from band 1 to 5). The numerical simulations discussed in this section have been carried out with an amplitude of modulation similar to that used in experiments (see below). As intuitively expected, we have also seen numerically that the linewidth of the transitions increases with the amplitude of modulation.
IV Experimental spectra
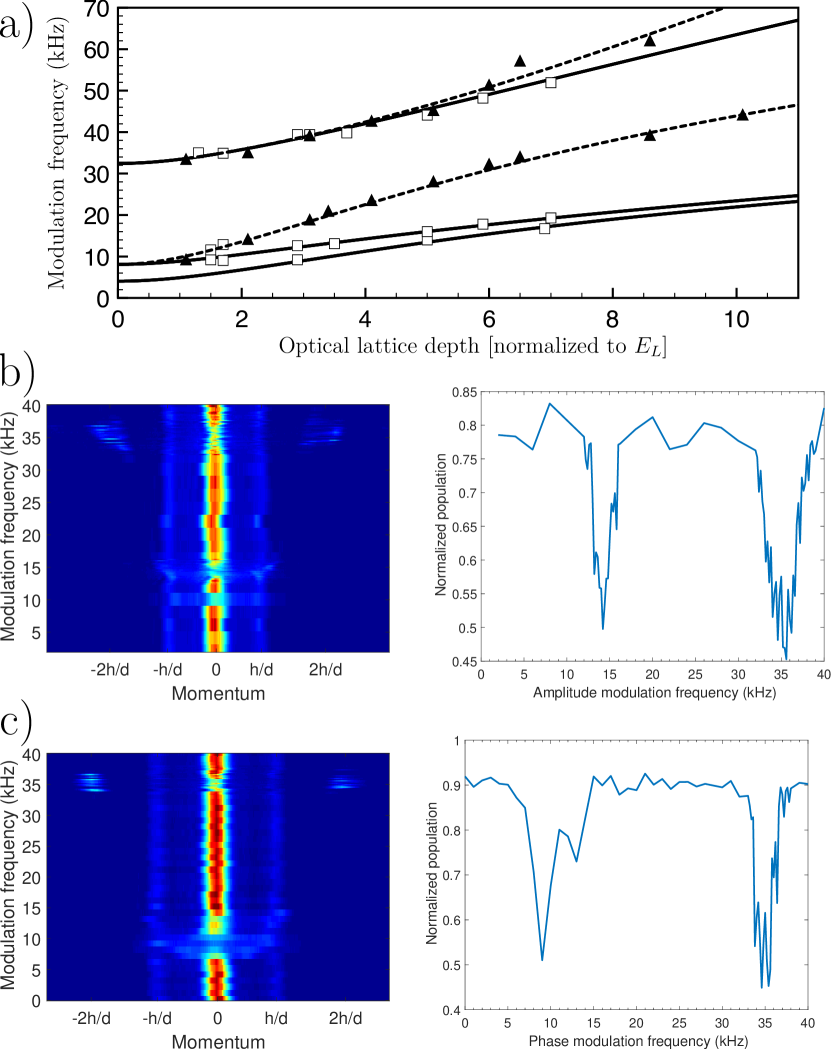
As illustrated in Fig. 2, the selection rules can be observed directly on the experiment. For this purpose, we proceed in the following manner. We load a BEC of rubidium-87 atoms into an optical lattice of depth by ramping the laser intensity in 30 ms with a vanishing initial and final slope to avoid any excitation PRL2016 ; PRA2018 . The modulation is switched on 2 ms after this adiabatic loading and lasts for 1 to 5 ms for phase modulation and 3 to 15 ms for amplitude modulation. All confinement is subsequently turned off and an absorption image is taken after a 25 ms time-of-flight. The maximum shift of the position of the lattice is for phase modulation while the lattice depth varies as with for amplitude modulation. The experiment is repeated for many modulation frequencies in the range of interest for a given lattice depth. The concatenation of those pictures are represented in Figs. 2b and c for amplitude and phase modulation respectively. The image taken after the time-of-flight reveals the Fourier space components of the wave function. In the absence of excitation, we simply recover the well-known diffraction pattern of a BEC associated to a periodic structure of lattice spacing and that exhibits peaks separated by stringariinguscio . For resonant excitations, atoms acquire a larger energy which results in a depletion of the zeroth order of the diffraction pattern and a concomitant increase of the populations of the other higher orders.
To process those images, we extract line by line the population in each diffraction order and infer from the depletion of the zeroth order the resonance frequencies. We find a good agreement between the experimental values and the ones calculated from the band structure spectrum as illustrated in Fig. 2. We also observe directly the selection rules. Indeed, only 1-phonon lines are observed for amplitude modulation while one and two phonon lines can be excited by phase modulation. Note that, at low depth (1.5 and 1.8 ), we get an excitation for the phase modulation whose frequency coincides with an a priori forbidden line, a result ascribed to the role of the confining external potential as discussed in Sec. III.
For rubidium atoms we do not benefit from an easily accessible Feshbach resonance without losses. We cannot therefore change the scattering length on a wide range and observe directly the effect of interactions on the excitation line as in the numerical results shown in Fig. 1. However, the density can be tuned through the value of the angular frequency associated to the external confinement (see Section I). As a result, the lines can a priori be modified for two reasons: the compression/decompression of the trap and the interaction strength through the atomic density.
The projection of the ground state wave function on the Bloch functions of the lowest band depends a priori on the external confinement. By increasing the external confinement, the shape of the wave function is changed and departs more and more from the quasi-momentum eigenfunction InteractionBroadening . As a result, the number of modes with quasi-momenta of the ground band basis that should be used to get a complete representation of the wave function increases. This spreading of the wave function on a larger extent suggests that the lines are sensitive to the interaction strength.
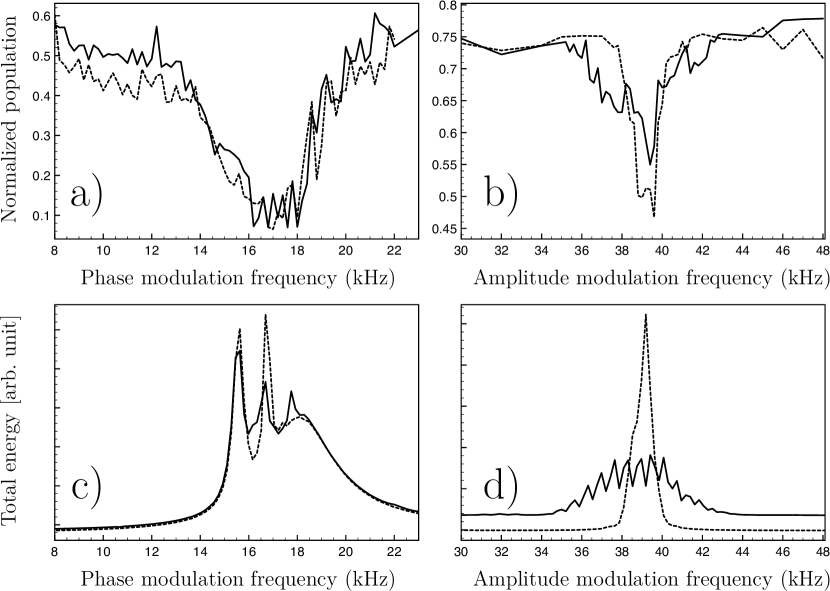
In figure 3, we have represented two different sets of spectrum data recording: about the 2-phonon line for phase modulation and about the second 1-phonon line for amplitude modulation. The experimental results are compared to numerical simulations performed under the same conditions where the total energy is plotted as a function of the modulation frequency for the same amplitude of modulation as the one used in experiments. The depth of the optical lattice is determined in each case by exciting the intrasite dipole mode as detailed in Ref. PRA2018 , and therefore by a method independent from the modulation experiments. For phase modulation (Figs. 3a and c) the 1-phonon line (18 kHz), the 2-phonon line (15.8 kHz) and the 3-phonon line (16.7 kHz) are excited. They appear to be essentially immune to the variation of the external confinement. This result was expected since those lines are associated to the excitation of the intrasite dipole mode PRL2016 ; PRA2018 . In contrast, the second 1-phonon line for amplitude modulation is spectrally broadened when the external confinement is stronger. The reason lies in the fact that this excitation is coupled to higher modes such as the breathing mode that is sensitive to interactions.
V Dynamics of excited atoms
We now focus on the dynamics of atoms once they have been excited to upper bands. Indeed, after an excitation for a non zero quasi-momentum the semiclassical local velocity is finite and given by the slope of the energy band:
| (6) |
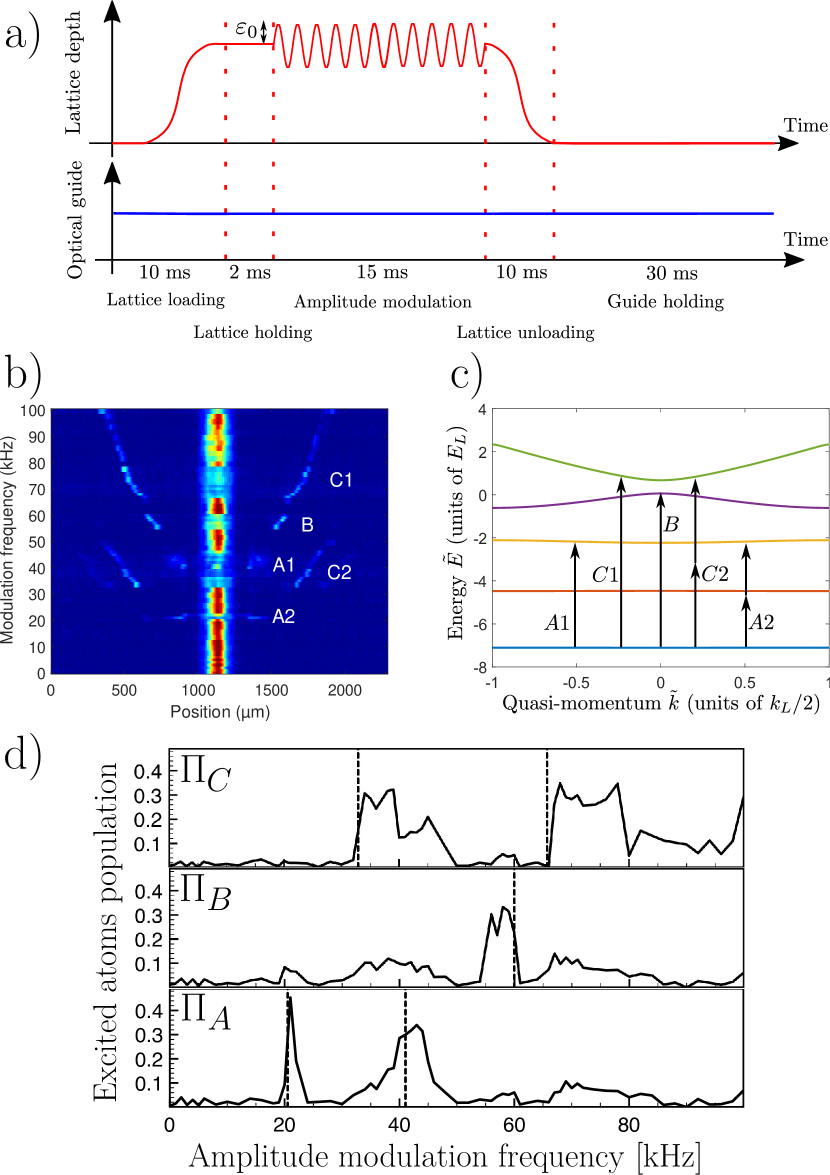
where is the characteristic velocity of the lattice, is the energy normalized to and the wave vector normalized to . For instance, the transition from band 1 (ground state) to band 3 (point of Fig. 4c) yields a maximum velocity on the order of a few hundreds of m.s-1. Interestingly, those velocities remain below the sound velocity and therefore do not deposit energy into the condensate because of the Landau superfluidity criterium. The size of the condensate being on the order of 200 m, one shall wait for a very long time, a fraction of a second, to see in position space the excited atoms going out from the condensate. To overcome this limitation, we use the band mapping technique which amounts to accelerate the excited atoms. It consists in decreasing adiabatically the lattice intensity after the modulation bm1 ; bm2 ; bm3 . As a result, atoms lying on the first band (ground state) have a velocity ranging from 0 to , those on the second band a velocity ranging from to , and on the band a velocity belonging to the interval PRA2013 . With this mapping between velocity and the band number, we can identify the different kinds of excitation including the excitation through the absorption of two phonons. As a result of this adiabatic transformation, the atoms promoted by the modulation to higher bands, are accelerated and can collide in a dissipative manner with the BEC.
We have carried out such an experiment with an optical lattice of depth under an amplitude modulation. In this experiment, the modulation time is 15 ms and the amplitude modulation is large . As a result, we observe not only the allowed band transition at but also the ones at that occur through 2-phonon transitions. Once the excitation is performed, we decrease the lattice and let the atoms evolve in the presence of the external confinement (see Fig. 4a). To directly access to the mapping between band number and position, the images are taken without any time-of-flight. Results for each modulation frequency are summarized on Fig. 4b.
We have identified the excited bands using letters , and followed by a number 1 or 2 designing the number of phonons involved in the excitation process (see Fig. 4c). For instance, corresponds to the 1-phonon transition from band 1 to 3, while refers to the 2-phonon transition between the same bands. We indeed observe that and packets belong to the same range of velocities. The same conclusion holds for and between bands 1 and 5. The distance over which the packets propagate follows the expected hierarchy: atoms from packet A (band 3) have traveled over a shorter distance than atoms from packet B (band 4), and those of over a shorter distance than those of packet (band 5). This confirms the efficiency of the mapping procedure. Figure 4d provides the populations , and in the excited bands as a function of the modulation frequency extracted from the image Fig. 4b. In practice, the populations pertain to different velocity classes. To determine them as a function of time, we proceed each image in the following manner: we extract the maxima of all visible atomic clouds, and integrate the image on areas of width 60 pixels about them. This procedure allows us to take into account the displacement of the atoms due to their velocity. The dashed lines indicate the transition frequency associated to the 1 and 2-phonon lines from the ground state band to the excited bands at . Interestingly, we recover that the 2-phonon lines (for and ) have a width twice smaller than the 1-phonon line. For and , the atoms are excited essentially above the frequency indicated by the dashed line since the atoms that are excited have a quasi-momentum , and the corresponding excitation frequency is larger than that at as a result of the positive curvature of the band about . In contrast, the population in is excited for a lower frequency than that at because of the negative curvature of the band in the center of the Brillouin zone. We get a good understanding of the spectra of Fig. 4d based on the 1 and 2-phonon lines. However, it is not always easy to extract with a high reliability the populations. Indeed, some extra structures appear in the populations. Some of them may be interpreted as fingerprints of 3-phonon lines. The method used to extract the populations also gives from time to time some overlaps of the integration areas, when atoms of different populations have velocity too close from each other. This limitation is related to non adiabatic effects near the edges of Brillouin zones, a well known limitation of the mapping band technique Natu .
We note that it is also delicate to extract the exact velocity with a reasonable accuracy since we do not know exactly at which moment atoms are promoted to the excited band during the 15 ms modulation time. Furthermore, atoms do not evolve freely. They are guided by an horizontal optical dipole trap that generates a harmonic potential whose quarter of period is on the order of 25 ms, a time close to the holding time in the guide.
In conclusion, we have investigated both experimentally and numerically the excitation of atoms in an optical lattice whose phase or amplitude is modulated. We have observed the selection rules and discussed their validity domain. Our study highlights the role of interactions even when they are relatively weak. The band mapping technique has been used to identify in more details the fate of the excited atoms. This work opens up a few interesting perspectives for a deeper understanding of the role of interactions for Floquet engineering.
This work was supported by Programme Investissements d’Avenir under the program ANR-11-IDEX-0002-02, reference ANR-10-LABX-0037-NEXT, and the research funding grant ANR-17-CE30-0024-01. M. A. acknowledges support from the DGA (Direction Générale de l’Armement).
References
- (1) N. Gemelke, E. Sarajlic, Y. Bidel, S. Hong and S. Chu, Phys. Rev. Lett. 95, 170404 (2005).
- (2) H. Lignier, C. Sias, D. Ciampini, Y. Singh, A. Zenesini, O. Morsch, and E. Arimondo, Phys. Rev. Lett. 99, 220403 (2007).
- (3) E. Kierig, U. Schnorrberger, A. Schietinger, J. Tomkovic, and M. K. Oberthaler, Phys. Rev. Lett. 100, 190405 (2008).
- (4) E. Michon, C. Cabrera-Gutiérrez, A. Fortun, M. Berger, M. Arnal, V. Brunaud, J. Billy, C. Petitjean, P. Schlagheck, and D. Guéry-Odelin, New J. Phys. 20, 053035 (2018).
- (5) André Eckardt, Rev. Mod. Phys. 89, 011004 (2017).
- (6) T. Stöferle, H. Moritz, C. Schori, M. Köhl, and T. Esslinger, Phys. Rev. Lett. 92, 130403 (2004).
- (7) C. Schori, T. Stöferle, H. Moritz, M. Köhl, and T. Esslinger, Phys. Rev. Lett. 93, 240402 (2004).
- (8) C. Kollath, A. Iucci, T. Giamarchi, W. Hofstetter, and U. Schollwöck, Phys. Rev. Lett. 97, 050402 (2006).
- (9) N. Fabbri, S. D. Huber, D. Clément, L. Fallani, C. Fort, M. Inguscio and E. Altman, Phys. Rev. Lett. 109, 055301 (2012).
- (10) M. Endres, T. Fukuhara, D. Pekker, M. Cheneau, P. Schau, C. Gross, E. Demler, S. Kuhr and I. Bloch, Nature 487, (2012).
- (11) A.Alberti , V. V. Ivanov, G. M.Tino and G. Ferrari, Nat. Phys. 5, 547 (2009).
- (12) E.Haller, R.Hart, M.J.Mark, J.G.Danzl, L.Reichsöllner, and H.-Ch.Nägerl, Phys. Rev. Lett. 104, 200403 (2010).
- (13) N. Goldman and J. Dalibard, Phys. Rev. X 4, 031027 (2014).
- (14) S. Lellouch and N. Goldman, Quantum Science and Technology, 3, 024011 (2018),
- (15) D. R. Hofstadter, Phys. Rev. B 14, 2239 (1976); M. Aidelsburger, M. Atala, S. Nascimbène, S. Trotzky, Y.-A. Chen, and I. Bloch, Phys. Rev. Lett. 107, 255301 (2011); M. Aidelsburger, M. Atala, M. Lohse, J. T. Barreiro, B. Paredes, and I. Bloch, Phys. Rev. Lett. 111, 185301 (2013); H. Miyake, G. A. Siviloglou, C. J. Kennedy, W. C. Burton, and W. Ketterle, Phys. Rev. Lett. 111, 185302 (2013); M. Aidelsburger, M. Lohse, C. Schweizer, M. Atala, J. T. Barreiro, S. Nascimbène, N. R. Cooper, I. Bloch, and N. Goldman, Nat. Phys. 11, 162 (2015).
- (16) F. D. M. Haldane, Phys. Rev. Lett. 61, 2015 (1988); G. Jotzu, M. Messer, R. Desbuquois, M. Lebrat, T. Uehlinger, D. Greif, and T. Esslinger, Nature 515, 237 (2014).
- (17) J. Struck, C. Ölschläger, R. Le Targat, P. Soltan-Panahi, A. Eckardt, M. Lewenstein, P. Windpassinger, and K. Sengstock, Science 333, 996 (2011); J. Struck, M. Weinberg, C. Ölschläger, P. Windpassinger, J. Simonet, K. Sengstock, R. Höppner, P. Hauke, A. Eckardt, M. Lewenstein, and L. Mathey, Nat. Phys. 9, 738 (2013).
- (18) N. Poli, F.-Y. Wang, M. G. Tarallo, A. Alberti, M. Prevedelli, and G. M. Tino, Phys. Rev. Lett. 106, 038501 (2011).
- (19) M. G. Tarallo, A. Alberti, N. Poli, M. L. Chiofalo, F.-Y. Wang, and G. M. Tino, Phys. Rev. A 86, 033615 (2012).
- (20) C. A. Weidner and Dana Z. Anderson, Phys. Rev. Lett. 120, 263201 (2018).
- (21) D. A. Steck, W. H. Oskay, and M. G. Raizen, 2001, Science 293, 274 (2001).
- (22) W. K.Hensinger, et al., 2001, Nature 412, 52 (2001).
- (23) R. Dubertrand, J. Billy, D. Guéry-Odelin, B. Georgeot, G. Lemarié, Phys. Rev. A 94, 043621 (2016).
- (24) J. Chabé, G. Lemarié, B. Grémaud, D. Delande, P. Szriftgiser, and J. C. Garreau, Phys. Rev. Lett. 101, 255702 (2008).
- (25) M. C. Fischer, K. W. Madison, Qian Niu, and M. G. Raizen, Phys. Rev. A 58, R2648(R) (1998).
- (26) M. Weinberg, C. Ölschläger, C. Sträter, S. Prelle, A. Eckardt, K. Sengstock, and J. Simonet, Phys. Rev. A 92, 043621 (2015).
- (27) P. Cheiney, C. M. Fabre, F. Vermersch, G. L. Gattobigio, R. Mathevet, T. Lahaye and D. Guéry-Odelin, Phys. Rev. A 87, 013623 (2013).
- (28) D. Hu, L. Niu, S. Jin, X. Chen, G. Dong, J. Schmiedmayer and X. Zhou, Communications Physics, 1, 29 (2018).
- (29) M. Lacki and J. Zakrzewski, Phys. Rev. Lett. 110, 065301 (2013).
- (30) B.P. Holder and L. E. Reichl, Phys. Rev. A 76, 013420 (2007).
- (31) C. V. Parker, L.-C. Ha, C. Chin, Nat. Phys. 9, 769 (2013).
- (32) W. Zheng, B. Liu, J. Miao, C. Chin, H. Zhai, Phys. Rev. Lett. 113, 155303 (2014).
- (33) Logan W. Clark, Lei Feng, Cheng Chin, Science, 354, 606 (2016).
- (34) P. L. Pedersen, M. Gajdacz, N. Winter, A. J. Hilliard, J. F. Sherson, and J. Arlt, Phys. Rev. A 88, 023620 (2013).
- (35) N. Fläschner, M. Tarnowski, B. S. Rem, D. Vogel, K. Sengstock, C. Weitenberg, Phys. Rev. A 97, 051601 (2018).
- (36) C. Zhuang, C. R. Paul, X. Liu, S. Maneshi, L. S. Cruz, and A. M. Steinberg, Phys. Rev. Lett. 111, 233002 (2013).
- (37) L. Niu, D. Hu, S. Jin, X. Dong, X. Chen, X. Zhou, Optics Express, 23, 10064 (2015).
- (38) Biao Wu and Qian Niu Phys. Rev. 64, 061603 (2001).
- (39) D. Diakonov, L. M. Jensen, C. J. Pethick and H. Smith Phys. Rev. 66, 013604 (2002).
- (40) M. Machholm, C. J. Pethick and H. Smith, Phys. Rev. 67, 053613 (2003).
- (41) S. B. Koller, E. A. Goldschmidt, R. C. Brown, R. Wyllie, R. M. Wilson and J. V. Porto, Phys. Rev. A 94, 063634 (2016).
- (42) The expansion of the zeroth order Bessel function about zero reads . For , we get .
- (43) where with is the recoil energy associated to the absorption of a single photon from the laser producing the lattice.
- (44) A. Fortun, C. Cabrera-Gutiérrez, G. Condon, E. Michon, J. Billy, and D. Guéry-Odelin, Phys. Rev. Lett. 117, 010401 (2016).
- (45) C. Cabrera-Gutiérrez, E. Michon, V. Brunaud, T. Kawalec, A. Fortun, M. Arnal, J. Billy, and D. Guéry-Odelin, Phys. Rev. A 97, 043617 (2018).
- (46) X. Antoine and R. Duboscq, Computer Physics Communications 185, 2969 (2014); ibid 193, 95 (2015).
- (47) P. Pedri, L. Pitaevskii, S. Stringari, C. Fort, S. Burger, F. S. Cataliotti, P. Maddaloni, F. Minardi, and M. Inguscio, Phys. Rev. Lett. 87, 220401 (2001).
- (48) J. Li, Y. Yu, A. M. Dudarev and Q. Niu, New J. Phys. 8, 154 (2006).
- (49) M. Greiner, I. Bloch, O. Mandel, T. W. Hänsch, and T. Esslinger, Phys. Rev. Lett. 87, 160405 (2001).
- (50) J. H. Denschlag et al., J. Phys. B 35, 3095 (2002).
- (51) M. Kohl, H. Moritz, T. Stoferle, K. Gunter, and T. Esslinger, Phys. Rev. Lett. 94, 080403 (2005).
- (52) S. S. Natu, D. C. McKay, B. DeMarco, and E. J. Mueller, Phys. Rev. A, 85, 061601 (2012).