Gaia: Orion’s Integral Shaped Filament is a Standing Wave
Abstract
The Integral Shaped Filament (ISF) is the nearest molecular cloud with rapid star formation, including massive stars, and it is therefore a star-formation laboratory. We use Gaia parallaxes, to show that the distances to young Class II stars (“disks”) projected along the spine of this filament are related to the gas radial velocity by
where is a constant. This implies that the ISF is a standing wave, which is consistent with the Stutz & Gould (2016) “Slingshot” prediction. The timescale is consistent with the “Slingshot” picture that the Orion Nebula Cluster (ONC) is the third cluster to be violently split off from the Orion A cloud (following NGC 1981 and NGC 1987) at few-Myr intervals due to gravito-magnetic oscillations. We also present preliminary evidence that the truncation of the ISF is now taking place south of the ONC and is mediated by a torsional wave that is propagating south with a characteristic timescale , i.e. eight times shorter. The relation between these two wave phenomena is not presently understood.
keywords:
astrometry - open clusters and associations: individual: M42 (ONC) - Stars: formation - ISM: clouds - Clouds: Individual: Orion A1 Introduction
The Orion Nebula Cluster (ONC) and the Integral Shaped Filament (ISF) within which it is either embedded or projected, have been a crucial laboratory for the study of star formation for the last half-century. It is the nearest molecular cloud with rapid star formation and also the nearest with a substantial number of recently formed and forming high-mass stars (O’dell, 2001). Hence, every new instrument, whether radio, far-IR, mid-IR, near-IR, or optical, whether ground or space, that advances to new wavelengths and/or new resolution and flux limits, is turned on the ONC/ISF as one of its first targets. Even its location on the sky, a few degrees from the Equator, facilitates focus on the ONC/ISF.
Working from such new observational advances, in particular the new Herschel/Planck Orion A dust map of Stutz & Kainulainen (2015), Stutz & Gould (2016) proposed a new theory of star formation, dubbed “The Slingshot”, which challenged existing paradigms. If there can be said to be a “dominant paradigm” in this field, it is that turbulence in the interstellar medium (ISM), with or without the aid of magnetic fields, gives rise to near-linear (possibly branching and/or intersecting) filaments that collapse in multiple places to form dense cores that subsequently evolve into stars (e.g., Federrath, 2016; Smith et al., 2012). Clusters like the ONC then assemble by “cold collapse” of stars forming on multiple nearby filaments and sub-filaments (e.g., Bate et al., 2003; Kuznetsova et al., 2015; Fujii, 2015).
Prior to the work of Stutz & Gould (2016) there were already several well-known facts that appeared to contradict this paradigm. First, the ISF is eponymously “integral shaped”. Hence, it either did not form as a straight filament as predicted by simulations (e.g., Federrath, 2016; Smith et al., 2012) and as observed in nearby, low-star-formation clouds (e.g., Polychroni et al., 2013; Kainulainen et al., 2016; Liu et al., 2018), or, more likely, evolved from such initially-straight filaments by some process that was seemingly crucial for the onset of rapid star formation leading to a cluster. Second, when the region is mapped in starless and pre-stellar cores (Tatematsu et al., 2008; Lane et al., 2016; Friesen et al., 2017), Class 0/I “protostars” (Furlan et al., 2016; Stutz et al., 2013), and Class II “disks” (Megeath et al., 2012), these generally follow the one-dimensional (1-D) structure of the filament on which the ONC appears as a somewhat flattened overdensity. That is, the cluster appears to be assembling out of the filament where stars are prodigiously forming, rather than “collapsing” from somewhere else.
However, Stutz & Gould (2016) began their investigation along a different route. They deprojected the Stutz & Kainulainen (2015) 2-D dust map, which enabled them to estimate the 3-D gravitational potential in the entire Orion A cloud (including both the ISF and L1641 to the south). This enabled them to quantitatively compare the angular positions and radial velocities (RVs) of “protostars” and “disks” to the corresponding ridgelines of the gas filament (and its potential). They found that the velocity offsets of the “protostars” from the local gas-velocity ridgeline were small compared to variations in the gas velocity ridgeline over the ISF. And similarly for the angular offsets. The typical scale of offsets for “disks” was found to be at least twice as great. Stutz & Gould (2016) therefore conjectured that stars were formed on an oscillating filament and remained attached to it by mechanical, gas interactions during their pre-stellar and early protostellar phases when they had relatively low central densities. Then, as they became more compact, they would detach from the accelerating filament with whatever speed the local filament had at that moment (see also Boekholt et al., 2017). They noted that the magnetic energy density and gravitational potential energy density were comparable, and so they explained the filamentary acceleration as due to gravito-magnetic oscillations. They argued that these led to repeated waves propagating through the larger Orion A cloud, which each terminated at the northern end of this filament leading to successive episodes of cluster formation. That is, a few Myr prior to the current episode that is forming the ONC, a previous such wave resulted in the creation of the cluster NGC 1977 (which still has many “disks”) just to the north, and a few Myr previous to that, the next-to-last episode resulted in the cluster NGC 1981 (which has few “disks”), lying a similar distance yet further north.
Subsequently, Stutz (2018) showed that even within the ONC cluster, the gravitational potential due to the ISF gas filament dominated over the potential due to the ONC stars, except within about 0.35 pc (). This result tends to confirm the idea that the ONC is forming out of the ISF and not collapsing from somewhere else.
The single most important test of the “Slingshot” conjecture is whether there are actually waves in the Orion A ISF on the scales of the separations of the observed clusters (ONC, NGC 1977, NGC 1981), i.e., about one degree. The chief difficulty in testing this previously was that the position and velocity information that was available (whether for gas or stars) was in orthogonal directions. That is, the positional information was in the plane of the sky while the velocity information (i.e., RVs) was along the line of sight.
Gaia Data Release 2 (GDR2) parallaxes and proper motions (when combined with previous RV information) can in principle rectify this situation by providing a full 6-D phase-space picture. In fact, employing these data requires considerable care, which includes both issues of selection effects and of relating stellar to gas motions. In the present work, we focus on positions and velocities along the line of sight, i.e., comparing Gaia-based distances to RVs.
2 Gaia Data for Class II “Disks”
The RV of the Orion A gas is measured in exquisite detail, whereas the RV information about “protostars” and “disks” is much cruder. This follows partly from the fact that the gas is colder (and so yields an intrinsically less noisy picture) but mainly from the fact the density of measurements on the sky is much higher. Thus, in a universe that is much kinder than the one in which we live, we would measure the distance of this gas as a function of position along the filament. However, this is impossible. Fortunately, we can measure the distances of Class II “disks” using GDR2. As shown by Stutz & Gould (2016) these “disks” track the filament in both angular position and RV, albeit with some dispersion. Therefore, it is almost certain that they track the distance of the filament as well. Of course, as Stutz & Gould (2016) also showed, the protostars track the gas filament even more faithfully. Unfortunately, these are almost absent from GDR2 because they suffer too much extinction.
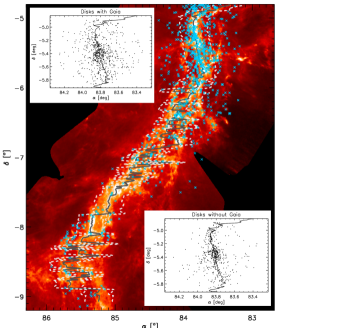
The two insets to Figure 1 show the Megeath et al. (2012) “disks” according to whether they are or are not detected in GDR2, together with the locus of the gas ridgeline. These insets have some worrisome features, the most unsettling of which is that there is a pronounced lack of detections on the western edge of the gas ridgeline in the neighborhood of the ONC. The most likely explanation is that these “disks” lie preferentially behind the filament and so suffer more extinction than other “disks”. The main concern about this is that GDR2 selection is automatically biasing us toward near-side “disks” that are closer than the filament itself. Our main tactic to deal with this is to restrict the analysis to both “disks” and gas that lie within of the gas ridgeline. The boundaries of this region are shown in the main panel, where the “disks” with “good parallaxes” (defined below) are superposed on the dust-density map of Stutz & Kainulainen (2015). Because the “disks” are already strongly peaked toward this restricted region, which is pc in projection, it is very unlikely that we are introducing biases on the pc scale on which we detect structures (see below).
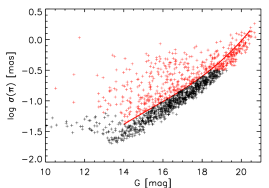
Figure 2 shows the GDR2 parallaxes errors versus Gaia magnitudes for all Megeath et al. (2012)“disks” in Orion A. We find that the objects to the left and above the dashed line preferentially have discrepant parallaxes. Rather than trying to identify discrepancies on an individual basis (which could introduce biases), we simply eliminate all objects in this region. We also eliminate all objects with formal errors because these contain very little information. The surviving “good parallax” objects are shown in the main panel in Figure 1.
As we will soon show, the measured structures have a depth of about pc for a system that lies at a distance pc. This implies parallax differences between objects of about , which is below even the best measurements for GDR2 (). Therefore, we must bin the data to elucidate structures. We pursue a binning scheme that aims to minimize the role of contaminants (which are inevitable) and flag those that remain, without any human intervention that could introduce conscious or unconscious biases. We order the objects by declination (i.e., the approximate direction of the filament) and bin them sequentially in bins of 25. We correct the GDR2 parallaxes for the zero-point errors as determined by Zinn et al. (2018). We find the mean and then automatically identify the highest-sigma positive and negative objects and eliminate these two. We then calculate the mean , standard error of the mean , and of each bin of 23 remaining objects. Because there are dof, these should be distributed as a distribution with 22 dof, under the assumptions that the GDR2 reported errors are correct and that the true dispersion of parallaxes is small compared to the typical reported errors.
We find that of the 20 bins, five have while the remaining 15 have . We regard this as unambiguous evidence that the first group of bins each has some objects at substantially different distances. The remaining 15 have a median of 37 (rather than 22). Hence, one of the two assumptions fails, i.e., either the GDR2 errors are underestimated or the scatter of true parallaxes is of order the error. Because this discrepancy could be resolved by putting the floor of the GDR2 errors at (rather than 20), we regard this as the more likely explanation. However, because the discrepancy is relatively small, it does not affect our conclusions, and so we do not further investigate its origins.
3 Wavy Structure of Orion A Along the Line of Sight
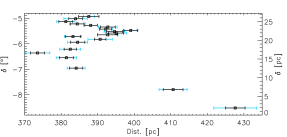
Figure 3 shows the distances of the binned “disks”, according to the formulae and . This is valid because in all cases. We show two error bars, and . The five points for which these differ by more than should be regarded as contaminated by objects at substantially different distances and therefore should be given lower weight in visually interpreting the diagram. The main features of this diagram are a “wave” in the neighborhood of the ISF (see also Appendix A of Kuhn et al., 2018) and a long “tail” to the south (L1641) pointing away from us at an angle from the line of sight. The latter is an interesting feature, which was already suggested by ground-based maser parallaxes (Kounkel et al. 2017; see also Kounkel et al. 2018), although the two objects measured in L1641 were considered too marginal by the authors to make a firm claim.
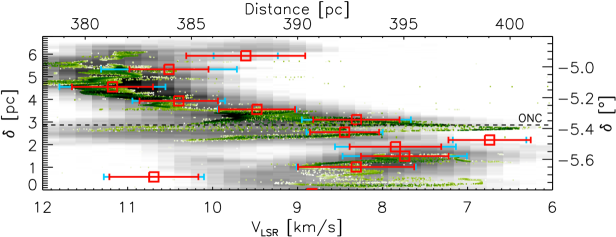
However in the present work, we focus on the ISF “wave”, which is shown in zoom in Figure 4. In this figure we overplot PV gas densities from two tracers, 13CO and . The latter both traces somewhat higher densities and has significantly better resolution ( versus full beam). Note that the distances are plotted left-to-right (as usual) but the velocities are plotted with blue-shifted velocities to the right. The mean and plotting scale of the velocities are adjusted by eye to match to the distances, which yields a scaling of . From this diagram, one sees that
| (1) |
where K is a constant. That is, assuming that the stars on average trace the gas (Stutz & Gould, 2016), the ISF is moving under a restoring force that is roughly proportional to displacement. Because the velocities and displacements are in phase, this corresponds to a standing-wave oscillation.
This wave structure broadly confirms the “Slingshot” prediction of Stutz & Gould (2016).
4 Smaller Scale Torsional Wave
Figure 5 shows a PV plot of the same (Tatematsu et al., 2008) gas as in Figure 4, but stretched in the vertical direction in order to better delineate structures. It reveals a filamentary wave on a much smaller physical scale and must faster timescale. In fact, this wave was already apparent in the high-resolution 13CO map of Kong et al. (2018). In their Figure 21, there are clear and roughly constant RV oscillations from the northern limit of their figure (roughly north of the ONC) to about north of the ONC with a full amplitude of and average spacing of about . The full amplitude of the oscillations then begins to increase and reaches about south of the ONC, where they come to an abrupt and seemingly violent end. As the wave approaches this terminus, the spacing appears to increase to about . However, the filament itself is being seen more face-on at the terminus (see Fig. 4), so the larger spacing is probably mostly or entirely due to a larger projection factor.
While the presence of this wave is quite obvious in Figure 21 of Kong et al. (2018), its nature is not. However, the PV plot in Figure 5 gives the clear impression of a torsional wave. Further analysis of this structure is deferred to Gonzalez-Lobos et al. (2018, in prep).
We recall that Stutz & Gould (2016) conjectured that the star clusters NGC 1981 and NGC 1977 had formed by successive waves that “snapped” like a whip as they approached the northern end of Orion A, leading to their detachment from the filament and thus a shortening of the filament (and so a widening of the gap between Orion A and B). They argued that such a “snapping” action was in the process of creating the ONC and would eventually lead to its separation from the filament.
The torsional wave seen in the data is qualitatively consistent with this picture but with some added nuances. First, the wave appears to be propagating southward from the northern edge of Orion A, rather than northward as conjectured by Stutz & Gould (2016). It does appear to be violently separating the ISF from the rest of Orion A at a point well below the ONC (as predicted), but the timescale of these oscillations is about , compared to Myr evaluated above for the filament as a whole. Here , with , is the deprojection factor of the filament (from Fig. 4) in the region of the oscillations. Because this short-timescale torsional wave seems to be responsible for “dissecting” the filament into nascent clusters, it is likely to be very important. But again, the study of this wave is beyond the scope of the present work.
Finally, the extremely violent nature of this wave, conveyed by the disruption of the filament at their terminus, suggests that it may have triggered the BNKL “explosion” (Bally et al., 2017), which occurred 500 years ago, just (1 pc) north of the terminus of the torsional wave.
Regardless of details, rapid, ISF-like star formation, which is capable of generating clusters like the ONC, is governed by far more violent, magnetically-mediated (e.g. Schleicher & Stutz, 2018; Reissl et al., 2018) processes than those framing the quiet lives of nascent stars in the sleepy suburbs of star formation like Taurus and Ophiuchus.
Acknowledgments
AS acknowledges funding through Fondecyt regular (project code 1180350), ”Concurso Proyectos Internacionales de Investigación” (project code PII20150171), and Chilean Centro de Excelencia en Astrofísica y Tecnologías Afines (CATA) BASAL grant AFB-170002. AG received support from the European Research Council under the European Union’s Seventh Framework Programme (FP 7) ERC Grant Agreement n. [321035].
References
- Bally et al. (2017) Bally J., Ginsburg A., Arce H., Eisner J., Youngblood A., Zapata L., Zinnecker H., 2017, ApJ, 837, 60
- Bate et al. (2003) Bate M. R., Bonnell I. A., Bromm V., 2003, MNRAS, 339, 577
- Boekholt et al. (2017) Boekholt T. C. N., Stutz A. M., Fellhauer M., Schleicher D. R. G., Matus Carrillo D. R., 2017, MNRAS, 471, 3590
- Federrath (2016) Federrath C., 2016, MNRAS, 457, 375
- Friesen et al. (2017) Friesen R. K., et al., 2017, ApJ, 843, 63
- Fujii (2015) Fujii M. S., 2015, PASJ, 67, 59
- Furlan et al. (2016) Furlan E., et al., 2016, ApJS, 224, 5
- Kainulainen et al. (2016) Kainulainen J., Hacar A., Alves J., Beuther H., Bouy H., Tafalla M., 2016, A&A, 586, A27
- Kong et al. (2018) Kong S., et al., 2018, ApJS, 236, 25
- Kounkel et al. (2017) Kounkel M., et al., 2017, ApJ, 834, 142
- Kounkel et al. (2018) Kounkel M., et al., 2018, preprint, (arXiv:1805.04649)
- Kuhn et al. (2018) Kuhn M. A., Hillenbrand L. A., Sills A., Feigelson E. D., Getman K. V., 2018, preprint, (arXiv:1807.02115)
- Kuznetsova et al. (2015) Kuznetsova A., Hartmann L., Ballesteros-Paredes J., 2015, ApJ, 815, 27
- Lane et al. (2016) Lane J., et al., 2016, ApJ, 833, 44
- Liu et al. (2018) Liu H.-L., Stutz A., Yuan J.-H., 2018, MNRAS, 478, 2119
- Megeath et al. (2012) Megeath S. T., et al., 2012, AJ, 144, 192
- O’dell (2001) O’dell C. R., 2001, ARA&A, 39, 99
- Polychroni et al. (2013) Polychroni D., et al., 2013, ApJ, 777, L33
- Reissl et al. (2018) Reissl S., Stutz A. M., Brauer R., Pellegrini E. W., Schleicher D. R. G., Klessen R., 2018, preprint, (arXiv:1805.02674)
- Ripple et al. (2013) Ripple F., Heyer M. H., Gutermuth R., Snell R. L., Brunt C. M., 2013, MNRAS, 431, 1296
- Schleicher & Stutz (2018) Schleicher D. R. G., Stutz A., 2018, MNRAS, 475, 121
- Smith et al. (2012) Smith R. J., Shetty R., Stutz A. M., Klessen R. S., 2012, ApJ, 750, 64
- Stutz (2018) Stutz A. M., 2018, MNRAS, 473, 4890
- Stutz & Gould (2016) Stutz A. M., Gould A., 2016, A&A, 590, A2
- Stutz & Kainulainen (2015) Stutz A. M., Kainulainen J., 2015, A&A, 577, L6
- Stutz et al. (2013) Stutz A. M., et al., 2013, ApJ, 767, 36
- Tatematsu et al. (2008) Tatematsu K., Kandori R., Umemoto T., Sekimoto Y., 2008, PASJ, 60, 407
- Zinn et al. (2018) Zinn J. C., Pinsonneault M. H., Huber D., Stello D., 2018, preprint, (arXiv:1805.02650)