The extended HeII4686 emission in the extremely metal-poor galaxy SBS 0335-052E seen with MUSE††thanks: Based on observations collected at the ESO
Abstract
SBS 0335-052E, one of the most metal-poor (Z 3-4 Z⊙) HeII-emitter starbursts known in the nearby universe, is studied using optical VLT/MUSE spectroscopic and Chandra X-ray observations. We spatially resolved the spectral map of the nebular HeII4686 emission from which we derived for the first time the total HeII-ionizing energy budget of SBS 0335-052E. The nebular HeII line is indicative of a quite hard ionizing spectrum with photon energies 4 Ryd, and is observed to be more common at high-z than locally. Our study rules out a significant contribution from X-ray sources and shocks to the HeII photoionization budget, indicating that the He+ excitation is mainly due to hot stellar continua. We discovered a new WR knot, but we also discard single WR stars as the main responsible for the HeII ionization. By comparing observations with current models, we found that the HeII-ionization budget of SBS 0335-052E can only be produced by either single, rotating metal-free stars or a binary population with Z 10-5 and a ’top-heavy’ IMF. This discrepancy between the metallicity of such stars and that of the HII regions in SBS 0335-052E is similar to results obtained by Kehrig et al. (2015) for the very metal-deficient HeII-emitting galaxy IZw18. These results suggest that the HeII ionization is still beyond the capabilities of state-of-the-art models. Extremely metal-poor, high-ionizing starbursts in the local universe, like SBS 0335-052E, provide unique laboratories for exploring in detail the extreme conditions likely prevailing in the reionization era.
keywords:
galaxies: individual: SBS 0335-052E — galaxies: starburst — galaxies: dwarf — galaxies: ISM — galaxies: stellar content1 Introduction
The cosmic dawn (6 z 10) marks a major phase transition of the universe, during which the “first light” [metal-free stars (or the so-called PopIII-stars) and the subsequent formation of numerous low-mass, extremely metal-poor galaxies] appeared, putting an end to the dark ages. The details of the reionization history reflect the nature of these first sources, which is currently completely unconstrained and the subject of considerable observational and theoretical efforts (e.g., Bromm, 2013; Fialkov, Barkana, & Visbal, 2014; Visbal, Bryan, & Haiman, 2017). In recent years, Hubble Space Telescope (HST) deep field surveys (e.g., HUDF, CANDELS-deep) have improved the statistics of galaxies at z 6. Very soon, James Webb Space Telescope (JWST) will be studying the sources identified at this epoch. At z 6, however, observing the UV photons (10 nm 130 nm) gets progressively more difficult due to the increasing opacity of the intergalactic medium (IGM) (e.g., Dijkstra, Mesinger, & Wyithe, 2011). Even JWST will be able to study in detail (i.e., spectroscopically) only the brightest sources (M 1010 M⊙; Windhorst et al., 2006), rather than the more common lower-mass galaxies that are expected to reionize the universe (e.g., Bouwens et al., 2015), for which only the integrated properties can be derived.
An immediately accessible approach is to identify galaxies at lower redshifts with properties similar to galaxies in the very early universe. To do this, we need to distinguish the salient observational features that would be associated with such objects. HeII emission (at 1640 Å and 4686 Å in the rest-frame UV and optical ranges, respectively), observed to be more frequent in high-z galaxies than locally (e.g., Kehrig et al., 2011; Cassata et al., 2013), is indicative of far harder ionizing radiation than that seen in nearby systems, as photons with energy beyond 54.4 eV ( 228 Å) are required to twice ionize He. Star-forming (SF) galaxies with lower metal content tend to have larger narrow (nebular) HeII line intensities compared to those with higher metallicities (e.g., Guseva, Izotov, & Thuan, 2000). This agrees with the expected harder spectral energy distribution (SED) at the lower metallicities typical in the distant universe. Theoretical arguments suggest that PopIII-stars and nearly metal-free (Z Z⊙/100) stars have spectra hard enough to produce many He+-ionizing photons, and so the high-ionization HeII line has been considered one of the best signatures to single out candidates for the elusive PopIII-hosting galaxies (e.g., Tumlinson & Shull, 2000; Schaerer, 2003; Visbal, Haiman, & Bryan, 2015). Although recent observations indicate that high-ionization emission appears to be more usual at the highest redshifts, the observational signatures of such ionization are not always unambiguous (e.g., Cassata et al., 2013; Gräfener & Vink, 2015; Visbal, Haiman, & Bryan, 2016; Stark, 2016; Mainali et al., 2017). Recently, Berg et al. (2018) detected high-ionization narrow emission lines (e.g., CIV1548,1550, HeII1640, OIII]1661,1666) in a metal-deficient lensed galaxy at z 2. They found that the relative emission line strengths can be reproduced with a very high-ionization, low-metallicity starburst with binaries, with the exception of HeII which requires an extra ionization source likely from extreme stellar populations.
The nebular HeII line is the response of the galaxy gas to the HeII-ionizing continuum ( 228 Å), and the hot, massive HeII-ionizing stars, when not obscured, emit most of their radiation in the FUV ( 2000 Å). Based on current facilities, it is not possible to obtain direct extreme-UV observations of a such star at any redshift. As of today, individual stars cannot be safely resolved beyond the Local Group, and empirical constraints on massive stellar models are still limited to the SMC metallicity ( 1/5 Z⊙; e.g., Kehrig et al., 2011; Herrero et al., 2012; Massey, 2013; Massey et al., 2014; Garcia et al., 2014). Although significant progress has been made observationally and theoretically, modelling massive stellar evolution, in particular at the low metallicity regime, continues to be challenge (e.g., Puls, Vink, & Najarro, 2008; Tramper et al., 2011; Muijres et al., 2012; Langer, 2012; Smith, 2014; Szécsi et al., 2015; Georgy, Hirschi, & Ekström, 2016; Sander et al., 2017). Ultimately our understanding of metal-poor, hot massive stars remains elusive which propagates to a lack of understanding of the formation of high-ionization lines as HeII. Therefore detailed studies on the origin of nebular HeII at low redshifts are required to better interpret far-away narrow HeII-emitters and hence gaining a deeper understanding of the reionization era. Low metallicity, HeII-emitting local SF galaxies provide useful constraints on the little-known SEDs of metal-poor, hot massive stars and are unique laboratories in which to test stellar population synthesis models at sub-SMC metallicities (see e.g., Kehrig et al., 2008, 2013, 2015; Senchyna et al., 2017).
The goal of this paper is to seek a deeper understanding of the nebular HeII emission in the nearby galaxy SBS 0335-052E. This study is based on Multi-Unit Spectroscopic Explorer (MUSE)/VLT optical integral field spectroscopy and Chandra X-ray observations (see Section 2). SBS 0335-052E, at a distance of 54 Mpc (NED111NASA/IPAC Extragalactic Database), was discovered in the Second Byurakan Survey by Izotov et al. (1990). It presents an extremely low nebular oxygen abundance of 12+log(O/H) 7.2-7.3 ( 3-4 Z⊙222assuming a solar metallicity 12+log(O/H)⊙ = 8.69 (Asplund et al. 2009); e.g., Izotov et al., 1990; Melnick, Heydari-Malayeri, & Leisy, 1992; Izotov et al., 1999; Papaderos et al., 2006), placing it among the most metal-poor SF galaxies with nebular HeII emission known in the local universe. The hard extreme-UV ionizing photons and the very low metallicity gas present in SBS 0335-052E are features prevailing in the early universe, which makes this galaxy an excellent low-redshift analog.
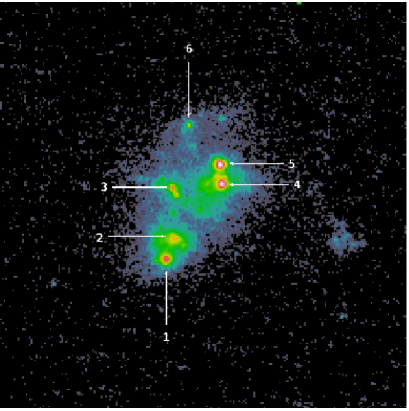
SBS 0335-052E undergoes a vigorous starburst and hosts extremely massive young clusters (see Johnson, Hunt, & Reines, 2009, and references therein). All star formation occurs in six very blue and compact ( 60 pc) super-star clusters (SSCs) with a mean age of 6 Myrs (see Thuan, Izotov, & Lipovetsky, 1997; Reines, Johnson, & Hunt, 2008). In Fig. 1, we show the HST/ACS UV image of SBS 0335-052E. In this image we can see the six brightest SSCs of the galaxy which are found distributed over a region of 2 arcsec ( 520 pc at the distance of 54 Mpc).
The paper is organized as follows: Section 2 details the observations and data reduction; Section 3 describes flux measurements and optical emission line intensity maps, while Section 4 details the spatially resolved HeII4686-emitting region. The discussion on the origin of the nebular HeII4686 emission and comparison of models with observations are covered in Section 5. Finally, Section 6 summarizes the main conclusions derived from this work.
2 Observations
2.1 Optical Integral field spectroscopic data
The Multi-Unit Spectroscopic Explorer (MUSE; Bacon et al., 2014) data of SBS 0335-052E were obtained in 2015 November 16th and 17th under the ESO program ID 096.B-0690A (PI: M.Hayes). The observations were carried out in the wide field mode which provides a field of view of 1 arcmin 1 arcmin with a sampling of 0.2 arcsec 0.2 arcsec in the wavelength range 4600-9366 Å.
We have retrieved the fully reduced data cubes of SBS 0335-052E from the ESO archive. The reduction of the raw data used version 1.6.1 of the MUSE Instrument Pipeline with default parameters, which consists of the standard procedures of bias subtraction, flat fielding, sky subtraction, wavelength calibration, and flux calibration. The cube analysed here is the result of eight exposures of 2840 seconds each, and the data were taken at airmasses 1.0. The spectral resolving power is R = = 2988. The PSF FWHM ranges from 0.6′′ to 0.7′′. We note that these data have already been independently analysed by Herenz et al. (2017).
2.2 X-ray Observations
SBS 0335-052E was observed with the front-illuminated CCD array ACIS-I onboard the Chandra X-Ray Observatory on 2000 September 7 for a total exposure time of 47.6 ks (Observation ID: 796; PI: Thuan). Observations were carried out in the Very Faint mode. We retrieved level 1 and level 2 processed data from the Chandra Data Center, but actually only the level 1 data were used after reprocessing them with the chandra_repro tool of the Chandra X-Ray Center software CIAO v4.9 using CALDB 4.7.3. The data reduction included standard removal of pixel randomization, cleaning of ACIS background for the Very Faint mode, and bad pixels masking.
The event list was further filtered to select good ASCA grades. The data were affected by a few episodes of relatively high background (above the nominal ACIS-I background rate 0.20 cnts s-1 chip-1 in the energy range 0.5-7.0 keV) that were excised for further data analysis. The net exposure time was then reduced to 32.5 ks. The data analysis was performed using HEASARC FTOOLS and XSPEC v12.9.1 routines (Arnaud, 1996). The astrometry of the X-ray data was refined using X-ray sources in the FoV spatially coincident with optical sources in the HST archival WFPC2 F791W image.
3 Optical flux measurements and emission line maps
We derived the emission-line fluxes from the 90,000 spaxels333Individual elements of IFUs are often called ‘spatial pixels’ (commonly shortened to ’spaxel’); the term is used to differentiate between a spatial element on the IFU and a pixel on the detector of the MUSE data cube following the steps described next. First, we fit the continuum level adjacent to every emission line for each spaxel spectrum. This procedure was repeated several times by varying the local continuum position. The final continuum level and its associated uncertainty (or continuum noise) for each line were adopted to be the average and standard deviation of the repeated measurements, assuming these follow a normal distribution. After subtracting the final continuum level from every line, we derive the line flux by fitting a Gaussian profile to each emission line using the IDL-based routine MPFIT (Markwardt, 2009); the peak intensity, the line width and the central wavelength for each line are kept as free parameters. In the case of the H[NII] lines, we fit the three lines simultaneously keeping the same line width and radial velocity for [NII] and H, and a nitrogen [NII]6584/[NII]6548 line ratio of 3.
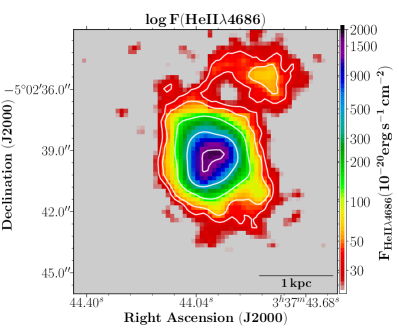
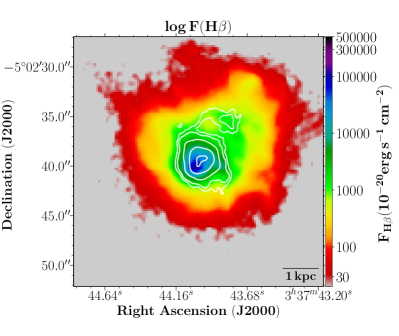
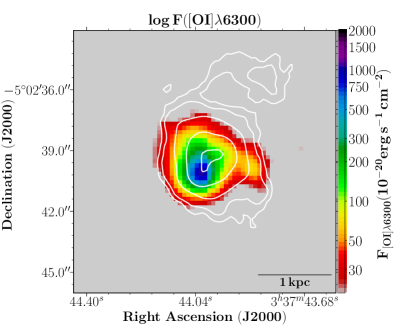
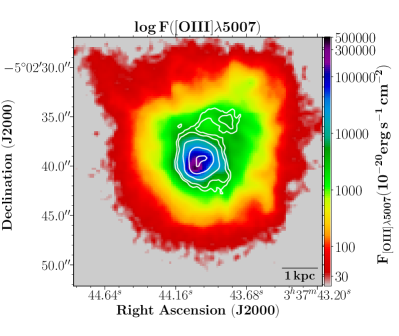
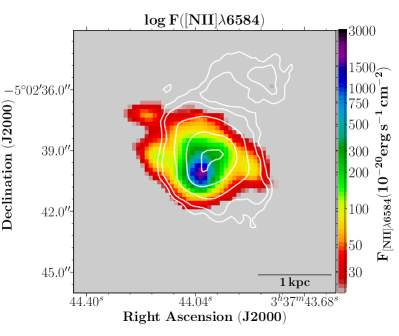
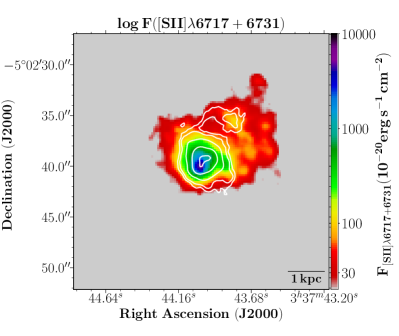
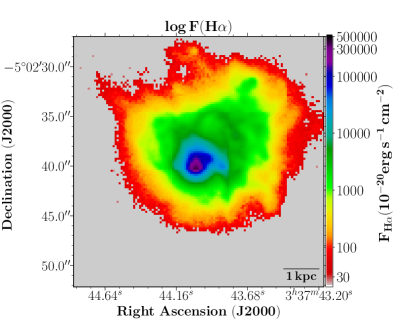
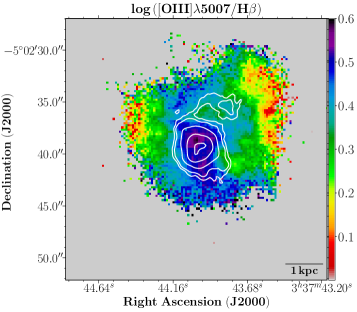
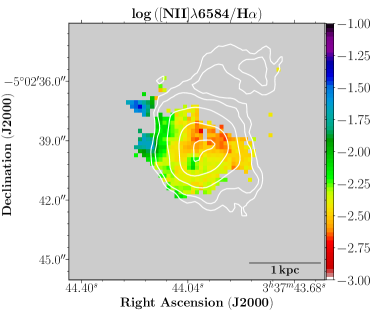
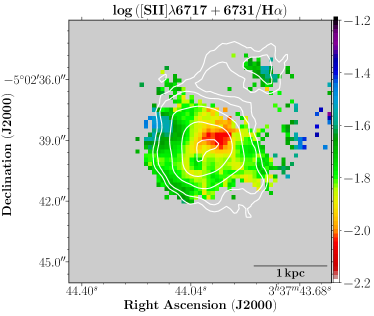
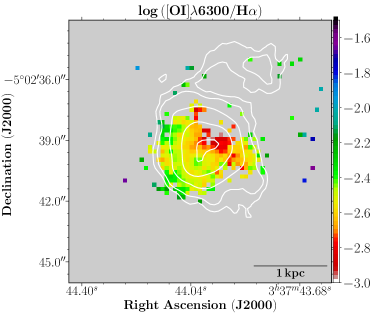
Using our own IDL scripts, we combine the line fluxes with the position of the fibres on the sky to create the maps of emission lines presented in this paper. Fig. 2 displays the HeII4686, [OI]6300, [NII]6584, H, [OIII]5007, [SII]67176731 emission line maps. As a guide to the reader, isocontours of the HeII4686 emission line flux are shown in all maps. The intensity distribution of H and [OIII]5007 are more extended than that of HeII4686, [OI]6300, [NII]6584, and [SII]67176731 because those lines are among the brightest optical emission lines in the SBS 0335-052E spectra. The maps show wisps and/or filaments that surround the central strong emission region depicting the complex morphology of the ionized gas in SBS 0335-052E (see also Herenz et al., 2017).
4 The spatially resolved HeII4686-emitting region
The presence of narrow HeII4686 emission in SBS 0335-052E has been reported before. For instance, Melnick, Heydari-Malayeri, & Leisy (1992), Izotov et al. (1997), and Thuan & Izotov (2005) based on long-slit spectroscopy, show the narrow HeII4686 line in the spectrum of SBS 0335-052E. Izotov et al. (2006) first produced a HeII4686 spectral map of SBS 0335-052E using the VLT/GIRAFFE spectrograph. However, the superior spatial resolution of MUSE provides much more detailed emission-line flux maps, and therefore allows us to perform a broader study on the origin of the HeII ionization in SBS 0335-052E, a subject still under debate not only for this galaxy but for other several local HeII-emitting SF systems (e.g., Garnett et al., 1991; Izotov et al., 2006; Kehrig et al., 2011; Shirazi & Brinchmann, 2012; Kehrig et al., 2013, 2015). We will discuss this point further in Section 5.
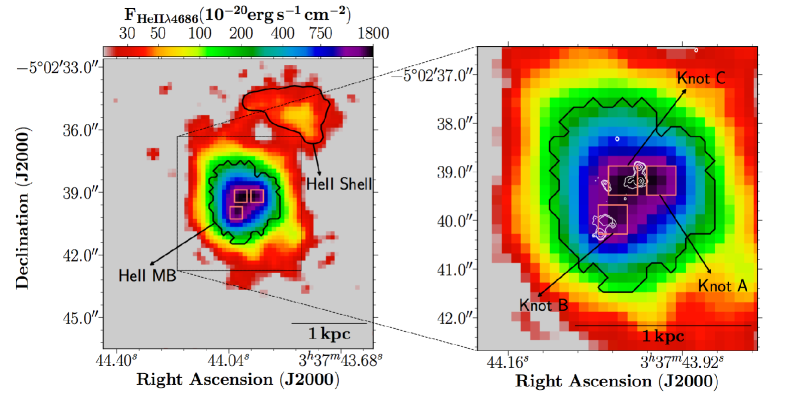
Figures 2 and 3 reveal a highly extended HeII4686-emitting region from our IFS data (see also Herenz et al., 2017). The spatial distribution of HeII is quite different from that of the other emission lines (see Fig.2) The HeII emission consists of a roundish oval shape component with a diameter of 5 arcsec ( 1.3 kpc at the distance of 54 Mpc) over the galaxy core, and a shell-like structure (called here “HeII shell”) which are connected to each other. The HeII-emitting zone extends out to distances 6 arcsec ( 1.5 kpc) from the youngest SSCs (SSCs #1 and #2; see e.g., Reines, Johnson, & Hunt, 2008), and presents three peaks spatially displaced from the brightest stellar clusters (see top-right panel from Fig. 3).
From our data, we checked that the FWHM of the HeII4686 line is comparable to that of the other nebular emission lines (e.g., H, [OIII]5007). The measured values of the mean () and standard deviation () for the FWHM(HeII)/FWHM(H) and FWHM(HeII)/FWHM([OIII]5007 ratios are = 1.13 ( = 0.09) and = 1.10 ( = 0.10), respectively. The narrow line profile for the HeII4686 emission and its spatial extent are evidence of its nebular nature.
Based on the spatial distribution of the emission in HeII we created the 1D spectra for several regions by summing the flux in the spaxels within each of the corresponding areas displayed in Fig. 3. The spectra of the knots centered on the three peaks seen in the HeII line map are named HeII Knots A, B and C; the area of their aperture extraction is 0.36 arcsec2 each. The ’HeII shell’ integrated zone covers 9.7 arcsec2. We have also obtained the 1D spectrum for which we term HeII main body (’HeII-MB’) by adding all HeII-emitting spaxels with HeII S/N 10; thus exclusively the emission of the brighter HeII ionized gas has been integrated in the HeII MB spectrum. Finally, we obtained for the first time the integrated spectrum of SBS 0335-052E. To do so we have integrated the flux in all the spaxels for which H S/N (per spaxel) 10; this corresponds to an area of 340 arcsec2 ( 23 kpc2), enclosing basically all the nebular emission across our MUSE FOV (see the H map in Fig. 3).
Fig.4 presents the 1D spectra for the aforementioned regions of SBS 0335-052E. We measured the emission line fluxes of the 1D spectra with the SPLOT routine in IRAF444IRAF is distributed by the National Optical Astronomical Observatories, which are operated by the Association of Universities for Research in Astronomy, Inc., under cooperative agreement with the National Science Foundation. by integrating all the line flux between two points given by the position of a local continuum. The continuum level is estimated by visually placing the graphics cursor at both sides of each line. This process was repeated several times for each emission line by varying the continuum position. We take the mean and the standard deviation of the repeated measurements as the final flux of each line and its associated uncertainty, respectively. The reddening coefficient, c(H), corresponding to each summed spectra was computed from the ratio of the measured-to-theoretical H/H assuming the reddening law of Cardelli et al. (1989), and case B recombination with electron temperature = 2104 K and electron density = 100 cm-3 (e.g., Papaderos et al., 2006) which give an intrinsic value of H/H= 2.75 (Osterbrock & Ferland, 2006). Reddening-corrected line intensities, normalized to H, along with physical properties obtained from the 1D spectra are shown in Table 1.
The HeII ionizing photon flux, Q(HeII), can be derived from the reddening-corrected LHeIIλ4686, using the relation Q(HeII) = LHeIIλ4686/[j(4686)/(HeII)] (Osterbrock & Ferland 2006). Making use of the integrated spectrum, and assuming case B recombination and an electron temperature = 2104 K (e.g., Papaderos et al., 2006; Izotov et al., 2006), we computed for the first time the total HeII ionizing photon flux, Q(HeII)Int = 3.17 1051 photons s-1, in SBS 0335-052E. Q(HeII)Int is a relevant quantity in order to study the origin of the nebular HeII emission (see Kehrig et al., 2015, and see also Section 5). Using the same methodology, we also computed Q(HeII) for the other selected regions of SBS 0335-052E mentioned above (see Table 1). From Table 1 we can see that the HeII main body and the HeII shell, together, produce a total of 2.38 1051 He+-ionizing photons s-1 which represents 75 of the integrated Q(HeII)Int. This indicates that the contribution to the Q(HeII)Int from the most external and faint HeII emission from the SBS 0335-052E core is not negligible ( 25). This highlights the importance of high-spatial resolution IFS for our analysis, which have allowed us to collect all HeII emission free from aperture effect corrections required in single-fiber or long-slit spectroscopic observations.
| Wavelength | HeII Knot A | HeII Knot B | HeII knot C | HeII “shell” | HeII-MBa | Integratedb |
|---|---|---|---|---|---|---|
| 4658 [Fe III] | 2.4 0.4 | 2.60 0.10 | 3.5 0.4 | 10.5 0.5 | 3.40 0.11 | 4.47 0.26 |
| 4686 He II | 60.8 0.6 | 14.20 0.10 | 46.0 0.7 | 39 1 | 27.14 0.13 | 26.08 0.32 |
| 4714 [Ar IV]+He I | 16.3 0.5 | 16.10 0.20 | 16.8 0.5 | 7 1 | 16.49 0.11 | 14.93 0.29 |
| 4740 [Ar IV] | 9.54 0.36 | 8.70 0.10 | 9.8 0.5 | — | 8.99 0.10 | 7.79 0.18 |
| 4861 H | 1000 1 | 1000 4 | 1000 1 | 1000 1 | 1000 1 | 1000 4 |
| 4959 [O III] | 1052 1 | 1099 3 | 1171 1 | 774 1 | 1094 1 | 1006 4 |
| 5007 [O III] | 3128 2 | 3231 9 | 3487 2 | 2336 2 | 3271 2 | 3002 8 |
| 5876 HeI | 87.29 0.20 | 128.95 0.38 | 93.99 0.28 | 89 1 | 105.75 0.25 | 101.34 0.33 |
| 6300 [O I] | 3.70 0.20 | 8.78 0.06 | 5.15 0.12 | 7.5 0.4 | 7.17 0.04 | 8.04 0.15 |
| 6312 [S III] | 5.20 0.20 | 7.23 0.06 | 5.60 0.13 | 7.3 0.4 | 6.36 0.05 | 6.09 0.23 |
| 6563 H | 2750 3 | 2665 9 | 2750 7 | 2750 3 | 2750 13 | 2750 10 |
| 6584 [N II] | 4.90 0.30 | 12.00 0.30 | 5.90 0.26 | 10 1 | 9.30 0.04 | 10 1 |
| 6678 HeI | 22.50 0.10 | 33.70 0.10 | 23.36 0.21 | 24 1 | 27.02 0.11 | 26.10 0.15 |
| 6717 [S II] | 13.50 0.10 | 23.30 0.10 | 16.43 0.11 | 28.66 0.38 | 20.48 0.11 | 22.79 0.39 |
| 6731 [S II] | 11.20 0.10 | 19.80 0.10 | 13.02 0.13 | 22.2 0.4 | 17.0 0.5 | 17.1 0.6 |
| c(H) | 0.22 | 0.00 | 0.20 | 0.13 | 0.10 | 0.10 |
| -EW(H) (Å) | 656 | 1319 | 600 | 1400 | 1081 | 1030 |
| -EW(H) (Å) | 97 | 300 | 96 | 305 | 187 | 199 |
| F(H)c | 2.85 | 6.98 | 3.76 | 2.20 | 5.42 | 7.95 |
| F(H)c | 1.03 | 2.62 | 1.37 | 8.02 | 1.97 | 2.89 |
| F(He II)c | 6.29 | 3.73 | 6.30 | 3.14 | 5.35 | 7.54 |
| L(H)(erg s-1) | 3.61 | 9.13 | 4.77 | 2.04 | 6.88 | 1.01 |
| L(He II)(erg s-1) | 2.19 | 1.30 | 2.20 | 8.94 | 1.87 | 2.63 |
| Q(He II)(photon s-1)d | 2.64 | 1.56 | 2.65 | 1.32 | 2.25 | 3.17 |
| Q(H)(photon s-1)e | 1.38 | 3.39 | 1.83 | 1.07 | 2.63 | 3.86 |
| log ([O I]6300/H) | -2.88 | -2.48 | -2.73 | -2.57 | -2.59 | -2.53 |
| log ([N II]6584/H) | -2.74 | -2.35 | -2.67 | -2.43 | -2.47 | -2.44 |
| log ([S II]6717+31/H) | -2.05 | -1.79 | -1.97 | -1.73 | -1.86 | -1.84 |
| log ([O III]5007/H) | 0.49 | 0.51 | 0.54 | 0.37 | 0.51 | 0.48 |
| ([S II])(cm-3) | 264 | 318 | 168 | 121 | 267 | 60 |
(a) “HeII main body” (HeII-MB) spectrum obtained by summing all HeII-emitting spaxels with He II S/N 10.
(b) SBS 0335-052E integrated spectrum created by adding all spaxels with H S/N 10.
(c) H, H and He II extinction-corrected fluxes in units of erg s-1 cm-2.
(d) Number of ionizing photons shortward of the He+ edge.
(e) Number of ionizing photons shortward of the H0 edge.


5 On the origin of the HeII4686 emission and ionizing sources
Despite numerous attempts to explain the origin of nebular HeII emission in nearby and distant SF systems, there are many cases that are currently inconclusive (e.g., Guseva, Izotov, & Thuan, 2000; Kehrig et al., 2011; Cassata et al., 2013; Gräfener & Vink, 2015; Kehrig et al., 2015; Senchyna et al., 2017). The most popular scenarios for producing nebular HeII emission involve X-ray sources, shocks and hot stellar ionizing continua (e.g., Garnett et al., 1991; Dopita & Sutherland, 1996; Cerviño, Mas-Hesse, & Kunth, 2002; Schaerer, 2003; Thuan & Izotov, 2005; Shirazi & Brinchmann, 2012; Kehrig et al., 2015). In the following we discuss each of these possible HeII ionizing sources in SBS 0335-052E.
5.1 X-ray emission
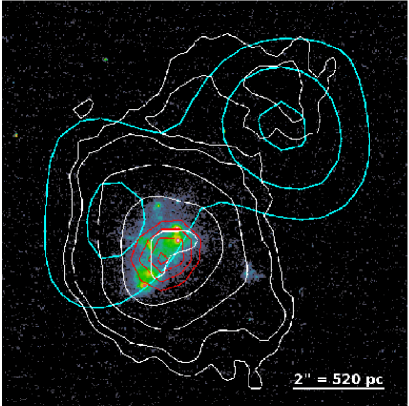
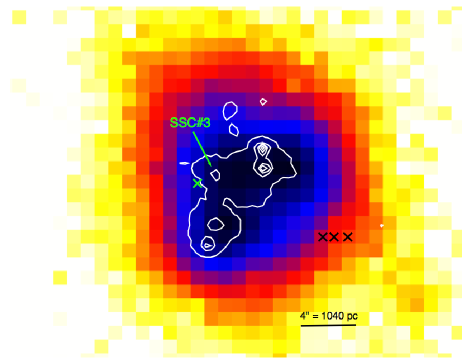
A preliminary inspection of the Chandra observations of SBS 0335-052E confirms the detection of faint X-ray emission as reported by Thuan et al. (2004). To investigate the correspondence between the spatial distribution of the X-ray, UV, and optical emissions in SBS 0335-052E, we made adaptively smoothed X-ray images in soft (0.6–1.4 keV) and hard (1.4–5.0 keV) bands with spatial resolution from 12 for bright point sources up to 18 for weak diffuse emission. These X-ray images are compared to the HST ACS/F220W and HeII images in Fig. 5.
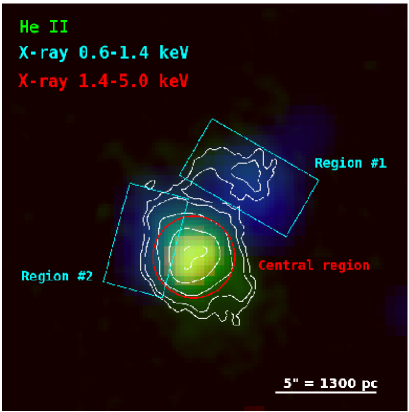
The comparison between the X-ray emission and the UV image reveals a source of hard X-ray emission (red contours in Fig. 5-left) spatially coincident with the brightest SSCs at the core of SBS 0335-052E. At the spatial resolution of the X-ray images, the source is basically unresolved, but for a slight ellongation along the Southeast-Northwest direction. Thuan et al. (2004) associated this source with SSC #2, although some additional emission was associated with SSCs #3, #4, and #5 (the SSCs are labeled in Fig. 1). Our analysis cannot provide a definitive association between this X-ray source and any of the SSCs; although at lower resolution, we can see that its peak is indeed closer to SSC #2 (see red contours in Fig. 5-left). However, the distribution of the soft X-ray emission is utterly different from that of the hard X-ray emission, with one faint blob of diffuse emission towards the Northeast of the core of SBS 0335-052E and another one brighter towards the Northwest (cyan contours in Fig. 5-left). The comparison of the soft X-ray and HeII images reveals that the latter source of soft X-ray emission is confined by the HeII Northwest shell (see Fig. 5-left and right).
According to the X-ray images presented above, we have extracted X-ray spectra from the apertures labeled “central region”, “region #1”, and “region #2”, as shown in Fig. 5-right, corresponding to the central hard point source, and to the Northwest and Northeast sources of soft diffuse emission, respectively. The count numbers of these spectra are too low to allow detailed spectral fits. Indeed, the spectral analysis of the X-ray emission from the hard source presented by Thuan et al. (2004) could constrain neither the emission model (power-law or optically-thin plasma), nor its parameters. Assuming a hydrogen column density cm-2, consistent with that used by Thuan et al. (2004), and a metallicity 3 (e.g., Izotov et al., 1999; Papaderos et al., 2006; Izotov et al., 2006), we find that the emission in this hard source is consistent with an optically-thin plasma emission model with a temperature of 3 keV. For comparison, Thuan et al. (2004) suggested plasma temperatures 3 keV, and certainly in excess of 1.2 keV. As for the diffuse X-ray emission, the same metallicity of 3 was assumed, but the hydrogen column density was reduced to cm-2 to be consistent with the optical extinction derived for “region #1” and “region #2” from the MUSE data. With these assumptions, the (even fainter) X-ray spectrum of the diffuse X-ray emission is found to be consistent with an optically-thin plasma emission model at a temperature of 1 keV.
The intrinsic X-ray luminosities of the central hard point-like source and the Northwest soft diffuse emission in the 0.3-5.0 keV band are 41039 and 31038 erg s-1, respectively. These X-ray models (spectral shapes, luminosities, absorptions) have been convolved with the energy-dependent cross section of He+ to estimate the effective X-ray ionizing power. We find Q(HeII) to be 36.2 for the central hard source and 35.4 for the Northwest source confined within the HeII shell. Clearly, these numbers show that the X-ray emission from the different sources found in SBS 0335-052E cannot provide the ionizing flux responsible for its HeII emission (see Table 1). Moreover, the different models to describe the X-ray emission from SBS 0335-052E (for instance, a power-law) also result in similarly low values of Q(HeII) that are well below the required value to ionize HeII at the level observed in this galaxy.
5.2 A 2D view of the gas excitation from MUSE
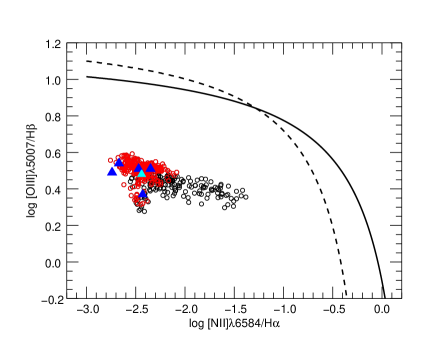
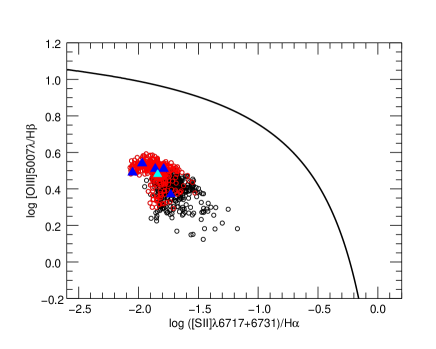
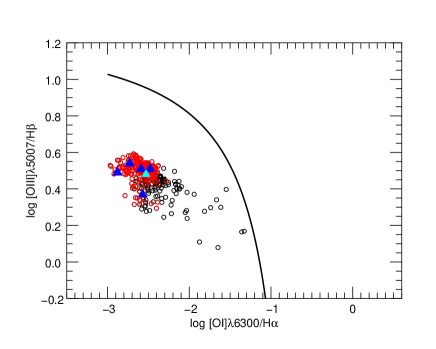
The contributions of different ionization mechanisms to the line emission across a galaxy can be probed quantitatively using diagnostic line ratios (e.g., Baldwin, Phillips, & Terlevich, 1981; Veilleux & Osterbrock, 1987; Kewley et al., 2015). The three panels of Fig. 6 show the spatially resolved [Nii]6584/H, [Sii]6717,6731/H, and [Oi]6300/H versus [Oiii]5007/H diagrams for SBS 0335-052E, while Fig. 7 displays the maps for such line ratios. These line ratios are not corrected for reddening, but their reddening dependence is negligible since they are calculated from lines which are close in wavelength. These optical diagnostic diagrams are commonly used to separate gas excitation dominated by massive star photoionization from other ionizing sources, including AGNs, post-AGB stars and shocks (e.g., Kewley et al., 2001, 2006; Kehrig et al., 2012; Gomes et al., 2016; Davies et al., 2017). In Fig. 6 each circle represents the line ratios calculated from the emission line fluxes of an individual spaxel, where the red circles indicate the HeII-emitting spaxels. The line ratios obtained from the one-dimensional (1D) spectra of selected regions across our FOV (see Section 4 and Table 1) are overplotted on the diagrams as triangles. The solid black curves on the three plots define the Kewley et al. (2001) theoretical upper bound to pure star formation. The dashed black curve on the [Nii]6584/H-diagram traces the Kauffmann et al. (2003) empirical classification line, which marks out the upper boundary of the Sloan Digital Sky Survey star formation sequence. All spectra lying below these curves are dominated by star formation. As indicated in Fig. 6, for all positions in SBS 0335-052E our emission-line ratios fall in the general locus of star-forming objects according to the spectral classification scheme proposed by Kewley et al. (2001) and Kauffmann et al. (2003). Accordingly, photoionization from hot massive stars seems to be the dominant excitation mechanism within SBS 0335-052E, regardless of the locus in the galaxy.
Of course, in starburst systems, supernovae remnants (SNRs) and massive star winds might be present and produce shock-heated gas. The extension and complex morphology of the ionized gas in SBS 0335-052E indeed suggest that the gas excitation and hard ionization may be partially due to shocks. However, besides the BPT diagram results, our spatially resolved observations give other reasons why shocks are unlikely to be the main source of He+-ionizing photons in SBS 0335-052E. We find no sign of significant [SII]/H and/or [OI]6300/H enhancement (a frequent indication of shock-excited gas; e.g., Skillman, 1985; Dopita & Sutherland, 1996; Allen et al., 2008) associated with the HeII-emitting region (see Fig.7). In particular, there is no [OI]6300 emission with S/N 5 at the location of the HeII shell whose filamentary structure could, in principle, suggest an important shock excitation (see Fig.2); the HeII shell also shows low values of [SII]/H associated with (see Fig.7). Our measured values of [SII]6717,6731/H ratio ( 0.03) in the HeII-emitting spaxels (see Fig.6) are lower than the ones observed in SNRs ([SII]6717,6731/H 0.5 - 1.0; e.g., Smith et al. 1993) which points against HeII shock ionization as well. Moreover, the characteristic [OIII] temperature ( 20,000 K; e.g., Izotov et al. 2006; Papaderos et al. 2006) in SBS 0335-052E is not as high as seen in classical SNRs (e.g., Blair, Kirshner, & Chevalier, 1981). These observational facts reinforce that notion that the formation of nebular HeII in SBS 0335-052E is mainly due to stellar sources, as mentioned previously. Next, we explore the hot massive star scenario.
5.3 Hot stars ionizing continua
5.3.1 Models on a star-by-star basis
For many years, hot Wolf-Rayet stars (WRs) have been proposed to be a reasonable explanation for HeII excitation, given the good correlation between the presence of narrow HeII4686 emission and WR features in SF systems mostly with metallicities 12+log(O/H) 8 (e.g., Schaerer, 1996; Schaerer & Vacca, 1998; Brinchmann, Kunth, & Durret, 2008). However, this correlation does not hold in all cases (e.g., Hadfield & Crowther, 2007; Kehrig et al., 2011; Neugent & Massey, 2011). Various studies have shown that nebular HeII4686 emission does not appear to be always associated with WRs, especially in metal-deficient objects (e.g., Guseva, Izotov, & Thuan, 2000; Thuan & Izotov, 2005; Shirazi & Brinchmann, 2012). In principle, one could envisage that the lack of WR features in the spectrum of metal-poor galaxies with nebular HeII4686 emission is likely because of the reduced WR line luminosities expected at low metallicities (e.g., Crowther & Hadfield, 2006). Of course, this interpretation might be valid in some cases, but not at all times; there are examples showing that the non-detection of WR signatures in some metal-deficient HeII4686-emitting regions is not an effect of the weakness of WR bumps, confirming so the lack of connection of HeII4686 emission with the hard radiation from WRs (see Kehrig et al., 2008, 2013; Shirazi & Brinchmann, 2012; Kehrig et al., 2015). Thus, the role played by WRs in ionizing He+ at low metallicities is still uncertain.
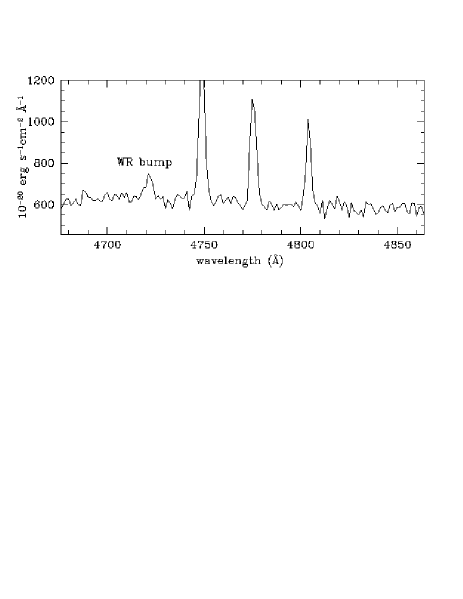
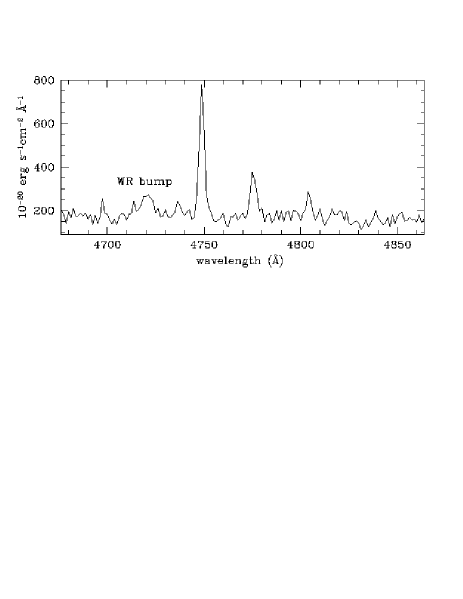
The existence of a WR stellar population in SBS 0335-052E, despite its low Z, was first reported by Izotov et al. (1999). Later, Papaderos et al. (2006) and Izotov et al. (2006) showed the detection of WRs associated with SSC #3. We searched for WR features in all 0.2” 0.2” HeII-emitting spaxels from MUSE. Our data set show indications of a WR bump centered at 4656 Å in one spaxel nearby SSC #3, in agreement with Papaderos et al. (2006) and Izotov et al. (2006). In comparison with these works, the spatially resolved spectroscopy with high spatial resolution of MUSE allows us to give a more precise location of such WR feature which is found to be 0.3 arcsec ( 78 pc at the distance of SBS 0335-052E) southeast of SSC #3. Moreover, by adding the emission from three spaxels, we find a new WR detection, also at 4656 . This new WR knot is located at 1.4 arsec ( 360 pc at the distance of SBS 0335-052E) toward the west of the center of the SSCs complex555According to Eldridge, Langer, & Tout (2011), for type Ib/c SN progenitors, 10 to 20 of WRs could travel hundreds of pc from their birth places. This could be the case of the new WR knot detected here, but this discussion is beyond the framework of this paper. (see Fig.8).
The 4656 broad bump observed in the spectra of the two WR knots (see Fig. 8) can be read as a signature of early carbon WRs (WCE; e.g., Crowther & Hadfield, 2006; Papaderos et al., 2006). In IZw18, a nearby galaxy with extremely low metallicity ( 1/40 solar metallicity; e.g., Vílchez & Iglesias-Páramo 1998; Kehrig et al. 2016), isolated clusters with WC stars have been detected as well (e.g., Brown et al., 2002). Detecting WRs in very metal-deficient objects is always an important observational constraint because it challenges current stellar evolutionary models for massive stars, which predict very few, if any, WRs in extremely metal-poor environments (e.g., Leitherer et al., 2014; Eldridge et al., 2017). Here, the total flux of the WCE bump measured from each WR knot spectrum provides a similar reddening-corrected luminosity of LWCE 2.4 1036 erg s-1. Crowther & Hadfield (2006) computed WCE (WC4) models at the LMC and IZw18 metallicities, i.e., 12+log(O/H) 8.36 (e.g., Russell & Dopita, 1990) and 7.11 (e.g., Kehrig et al., 2016), respectively.
As the metallicity of SBS 0335-052E [12+log(O/H) 7.3] is closer to that of IZw18, we compared our observations with the IZw18-like WCE models to derive the number of WRs in SBS 0335-052E. Taking the luminosity of 3.5 1035 erg s-1 for a single IZw18-like WC4 star (Crowther & Hadfield, 2006), this corresponds to an equivalent number of 7 WCEs in each WR knot, i.e., a total of 14 WCEs in SBS 0335-052E. From these 14 WCEs, a total flux of Q(HeII) = 4.4 1048 photon s-1 is expected (assuming Q(HeII) = 1047.5 photon s-1 for one IZw18-like WCE; Crowther & Hadfield 2006). This is about 500 times lower than the Q(HeII)HeII-MB = 2.25 1051 for the HeII main body region, and a factor of 700 lower than the Q(HeII)Int = 3.17 1051 derived from our data.
Based on the WCE models by Crowther & Hadfield (2006), therefore, more than 7000 WRs are required to explain the HeII-ionization budget measured. Such a very large WR population is not supported by state-of-the-art stellar evolutionary models for (single and binary) massive stars in metal-poor environments (see e.g., Leitherer et al., 2014; Eldridge et al., 2017, and references therein), and it is not compatible with the total stellar mass of the six SSCs (M⋆,SSCs 5.6 106 M⊙; Reines, Johnson, & Hunt, 2008) where the star formation in SBS 0335-052E is mostly concentrated; assuming a Salpeter initial mass function (IMF; Salpeter, 1955) with Mup = 150 M⊙ (Mup = 300 M⊙), a cluster with 7 (5) times the SSCs total mass would be needed to produce 7000 WRs in SBS 0335-052E. Moreover, the nebular HeII4686 emission is by far more extended than the places occupied by the WR knots (see Fig.8). Based on IFS studies, we have observed similar cases of spatial offset between WRs and HeII4686-emitting regions for other nearby, metal-poor SF galaxies (see Kehrig et al., 2008, 2013, 2015). All this indicates that, although the contribution from WRs to HeII-ionization cannot be disregarded, they are not exclusively responsible for the HeII4686 emission in SBS 0335-052E, in line with other metal-deficient galaxies as mentioned above. The evolution of massive stars into WR stars is not well understood, and the number of WRs derived here is limited to the current available models for metal-poor WRs which suffer from still unresolved uncertainties (see e.g., Smith, Norris, & Crowther, 2002; Vink & de Koter, 2005; Crowther & Hadfield, 2006; Crowther, 2007; Maeder & Meynet, 2012).
Considering hot massive stars to be the primary source of He+-ionizing photons in SBS 0335-052E, as our IFS observations indicate, we need to investigate other types of stars besides WRs. Although classical nebulae ionized by O stars having Teff 55,000 K are not expected to produce strong He++, certain O stars are predicted to be hot enough to ionize HeII (Kudritzki, 2002). According to the hottest models (Te = 60,000K) of massive O stars at Z 3 (i.e, the SBS 0335-052E metallicity) by Kudritzki (2002), we infer that 16,000 stars with 150 M⊙ (with predicted Q(HeII) 1.9 1047 photon s-1 each; see Fig.12 from Kudritzki 2002) are required to explain the derived Q(HeII)Int budget. Alternatively, if we take the 300 M⊙ star hottest models (with Q(HeII) 9 1048 photon s-1 each), 360 of these stars would be needed to produce the observed Q(HeII)Int. For a Salpeter IMF, 16,000 stars with 145 M⋆/M⊙ 155 would imply a cluster with 270 M⋆,SSCs; on the other hand, 360 stars with 290 M⋆/M⊙ 310 requires a cluster mass of 16 M⋆,SSCs. A Kroupa IMF (Kroupa, 2001) does not solve the cluster mass issue neither.
Work in recent years has shown that rotation is a key ingredient in shaping the evolution of massive stars with very low metallicities (Z SMC metallicity down to Population III stars; see Meynet & Maeder, 2017, and references therein). Fast rotators (with initial vrot 300 km s-1) are expected to lead to chemically homogeneous evolution (CHE) in which the star becomes brighter and hotter, and thus more ionizing photons, specially in the extreme UV, are emitted than in the corresponding non-rotating case (e.g., Brott et al., 2011; Levesque et al., 2012; Yoon, Dierks, & Langer, 2012). Presently, although we still know little about rotation velocities of massive stars and their variation with environment, observations seem to favor fast rotators at low Z (e.g., Martayan et al., 2007; Hunter et al., 2008). Model predictions suggest that the effects of rotation, like CHE, should be enhanced at lower metallicities. There is an increase of theoretical and observational evidence which supports the significant role of rotation among the generations of first stars, with Z=0 or extremely low metallicities, and fast rotating massive stars were likely common phenomena in the early universe (e..g, Leitherer, 2008; Chiappini et al., 2008; Maeder & Meynet, 2012; Yoon, Dierks, & Langer, 2012). Modern models for low-metallicity massive fast-rotating single stars which undergo CHE have been published by Szécsi et al. (2015); the authors called them transparent wind ultraviolet intense stars (or TWUIN stars). Considering all this and the extremely low-Z of SBS 0335-052E, we compare our observations with the TWUINs predictions666We note that the TWUIN models by Szécsi et al. (2015) are predicted at the IZw18 metallicity, i.e., slightly lower than the SBS 0335-052E metallicity., following the same approach that we used previously for non-rotating WCE and massive O stellar models. Taking the computed Q(HeII) = 7.37 1048 photon s-1 for the most massive 294 M⊙ TWUIN, we require that 430 ( 300) such stars are necessary to explain the Q(HeII)Int (Q(HeII)HeII-MB). Again, hundreds of these super-massive TWUINs do not match the M⋆,SSCs of SBS 0335-052E. If we instead, apply the same approach using lower mass TWUIN models, it makes even harder to account for the observations. Besides the Q(HeII) budget, we have measured values of HeII4686/H as high as 0.06 within the HeII4686 main body region. Under ionization-bounded conditions, even the most massive TWUIN models cannot reproduce these values of HeII4686/H (see Table B.1 from Szécsi et al. (2015)).
As mentioned in Section 1, searches for very metal-poor starbursts and PopIII-hosting galaxies at high-z using HeII lines have been performed, and is among the main JWST science drivers (e.g., Schaerer, 2008; Cassata et al., 2013; Visbal, Haiman, & Bryan, 2015). This search is based on the predicted high effective temperature for PopIII stars which will emit a large number of photons with energy 54eV, and also on the expected and observed increase of the nebular HeII line with decreasing Z (e.g., Guseva, Izotov, & Thuan, 2000; Schaerer, 2003, 2008; Brinchmann, Kunth, & Durret, 2008). So a speculative possibility to explain the derived Q(HeII) in SBS 0335-052E could be based on nearly metal-free ionizing stars. We have used recent models for fast-rotating Z=0 stars (Yoon, Dierks, & Langer, 2012) as an approximation for the HeII ionizing output of nearly metal-free stars. According to these Z=0 models, we found that a significantly smaller number of such stars, in comparison with the models considered previously, could explain the observed HeII budget; 160 (230) stars with mass Mini = 150 M⊙ (with Q(HeII) 1.42 1049 photon s-1 each) would be sufficient to account for the Q(HeII)HeII-MB (Q(HeII)Int). Additionally, the ionizing spectra produced by these star models are hard enough to explain the highest He II4686/H values observed, assuming that ionization-bounded conditions are met. Further speculation on the Z=0 stars hypothesis is beyond the scope of this paper.
Despite its nature as an entirely hypothetical scenario, it might suggest that stars with metallicity considerably lower than that of the HII regions in SBS 0335-052E are required to produce the total HeII ionizing photon flux (see next Section).
5.3.2 Stellar Population Synthesis Models
The effects of stellar multiplicity have been recognized to play a key role when modelling young stellar populations (see Eldridge et al., 2017, and references therein). Recently, it has been suggested that most massive stars evolve as part of binary systems (e.g., Langer, 2012; Sana et al., 2012, 2014). At low metallicities, different stellar evolution pathways, including those resulting from interacting binaries, are expected to become more and more important (e.g., Zhang et al., 2013; Stanway et al., 2014; Stanway, Eldridge, & Becker, 2016). According to population synthesis codes incorporating binary interactions, binarity leads to a bluer stellar population, and extends the lifetime of the WR stars up to ages later than 10 Myrs. This allows harder ionizing photons to exist at later times than expected from a single star population (e.g., Belkus et al., 2003; Zhang et al., 2015; Eldridge et al., 2017).
Here we considered a suite of models from the most recent data release of Binary Population and Spectral Synthesis (BPASSv2.1; Eldridge et al., 2017). By integrating the predicted BPASS SEDs over the wavelength range 1 Å 228 Å, we computed Q(HeII) for all IMFs available on the BPASSv2.1 data release. For each IMF we took into account the three lowest metallicity models : Z=10-3, 10-4, 10-5. The models at Z=10-3 correspond to the metallicity closest to that of SBS 0335-052E. A fundamental benefit of the new BPASSv2.1 is that now they have spectra at the lowest metallicities Z = 10-5 and 10-4. We took advantage of this since the influence of massive stars on the synthetic spectrum is believed to be strongest at these low metallicities. Finally, for every set of models, we also considered the BPASS predictions which do not include binary evolution, i.e., the BPASS single-star models. Thus this set of models allows us to check the impact on the HeII ionizing flux output by varying the IMF, metallicity and binarity. Our estimates assume an instantaneous burst at 106.8 yr because that model age matches the SSCs mean age of 6 Myr (Thuan, Izotov, & Lipovetsky, 1997; Reines, Johnson, & Hunt, 2008). The results obtained from the BPASSv2.1 models considered here are summarized in Table 2.
From Table 2, we see that, at a given IMF, the predicted Q(HeII) always increases with decreasing metallicity, both for single-star and binary models. This effect is expected since stars at lower metallicity have hotter effective temperatures which boost the ionizing photon flux. We also found that the Q(HeII) output of a binary population exceeds that of the single star population at all metallicities, regardless the IMF adopted. This outcome agrees with Eldridge et al. (2017) which predict a longer ionizing photon production lifetime of the binary stars overtaking the single stars at late ages for any ongoing or evolving starburst. Scaling the Q(HeII) values from Table 2 to the M⋆,SSCs of 5.6 106 M⊙ we infer that none of the models with Z=10-3 (the Z that better match the SBS 0335-052E metallicity of 3-4 solar) can reproduce the observed integrated Q(HeII)Int = 3.17 1051 photon s-1. At Z=10-3, predicted Q(HeII) reaches its maximum for the binary star model with IMF “imf100-300”; this value is 1.3 1050 photon s-1 (= 2.39 1049 photon s-1 scaled to the M⋆,SSCs; see Table 2), i.e., 24 times lower than the derived Q(HeII)Int.
The only two models that can explain the derived Q(HeII)Int budget are the binary ones at Z=10-5 for a shallower ’top-heavy’ IMF with either Mup=100 M⊙ (“imf100-100”) or Mup=300 M⊙ (“imf100-300”); both predict a similar Q(HeII) of 4.4 1051 photon s-1 or 4.1 1051 photon s-1 (after scaling to the M⋆,SSCs; see Table 2), respectively. These predictions exceed the observed Q(HeII)Int which could suggest that some fraction of the He+-ionizing photons may be able to escape the galaxy. Previous work claim that up to 50 of the hydrogen ionizing flux could be leaking out the HII regions of SBS 0335-052E, possibly due to clumping and filaments in its ISM (see e.g., Reines, Johnson, & Hunt, 2008; Johnson, Hunt, & Reines, 2009; Herenz et al., 2017). These structures in the ionized gas might be acting as escape pipes for the HeII Lyman continuum as well.
Thus, the outcomes from the BPASSv2.1 code indicate that while calling upon super-massive stars (M 100 M⊙) is not essential, a binary population distributed over a ’top-heavy’ IMF seem to be required to clear up the observed HeII flux budget. More interestingly, according to these modern models, stars with metallicity (Z = 0.05 solar) much lower than that of the ionized gas (Z 3-4 solar) of SBS 0335-052E are to be invoked to explain the HeII ionization in this galaxy. We highlight that similar results have been found to account for by the HeII ionization in other nearby, metal-poor SF galaxies (see Kehrig et al., 2015; Senchyna et al., 2017). Certainly, in this hypothetical scenario, such very metal-poor stars cannot belong to the same SSCs which host more chemically evolved objects. Further investigation is needed to understand the origin of this apparent inconsistency. Nevertheless, we should bear in mind the uncertainties yet unsolved in the BPASS code; the reader is referred to Section 7 from Eldridge et al. (2017) for details. Also, caution should be exercised when evaluating the Z = 10-5 and 10-4 models; empirical data for stellar atmospheres at these low Z are not available, and thus consist of theoretical extrapolation from higher-Z atmospheres which are better tested.
Although a detailed comparison between atmosphere and wind models is beyond the scope of this work, intermediate-mass stripped stars could be an important source of hard ionizing radiation. Such stars, thought to be very hot objects emitting the majority of their photons in the extreme UV, have been stripped of their envelope through interaction with a binary companion (Götberg, de Mink, & Groh, 2017). Götberg et al. (2018) computed atmosphere models for these stars, but they are not yet considered in BPASS, and thus we have not considered them here. Although models suggest that their importance decreases with decreasing metallicity and thus should not be relevant for extremely metal-poor objects, the Q(HeII) photon flux predictions of such stars are still uncertain (Götberg et al., 2018), and any conclusion about their role in galaxies like SBS0335-052 would be premature.
| IMF 777IMFs are labelled following the BPASSv2.1 designation (Eldridge et al., 2017) | Z (Z/Z⊙) 888BPASS models assume Z⊙=0.02 for consistency with their empirical mass-loss rates which were scaled from this value. | Q(HeII) photon s-1 | |
| Single | Binary | ||
| imf100-100999imf100-100: =-1.30 (0.1-0.5 M⊙), =-2.00 (0.5-100 M⊙); imf100-300: as imf100-100 but with Mup=300 M⊙ | 10-5 (0.05 ) | 1.40 1049 | 7.89 1050 |
| 10-4 (0.5 ) | 6.45 1048 | 3.40 1050 | |
| 0.001 (5 ) | 5.05 1046 | 2.18 1049 | |
| imf100-300c | 10-5 (0.05 ) | 1.20 1049 | 7.37 1050 |
| 10-4 (0.5 ) | 6.16 1048 | 3.48 1050 | |
| 0.001 (5 ) | 4.30 1046 | 2.39 1049 | |
| imf135all-100101010Salpeter IMF with Mup=100 M⊙ | 10-5 (0.05 ) | 5.01 1048 | 2.09 1050 |
| 10-4 (0.5 ) | 2.29 1048 | 8.97 1049 | |
| 0.001 (5 ) | 1.77 1046 | 5.94 1048 | |
| imf135-100111111These are the default IMFs recommended by Eldridge et al. (2017); imf135-100: =-1.30 (0.1-0.5 M⊙), =-2.35 (0.5-100 M⊙); imf135-300: as imf135-100 but with Mup=300 M⊙ | 10-5 (0.05 ) | 6.87 1048 | 2.71 1050 |
| 10-4 (0.5 ) | 3.10 1048 | 1.16 1050 | |
| 0.001 (5 ) | 2.40 1046 | 7.68 1048 | |
| imf135-300e | 10-5 (0.05 ) | 6.59 1048 | 2.79 1050 |
| 10-4 (0.5 ) | 2.98 1048 | 1.27 1050 | |
| 0.001 (5 ) | 2.30 1046 | 8.99 1048 | |
| imf170-100121212imf170-100: =-1.30 (0.1-0.5 M⊙), =-2.70 (0.5-100 M⊙); imf170-300: as imf170-100 but withMup=300 M⊙ | 10-5 (0.05 ) | 2.60 1048 | 7.22 1049 |
| 10-4 (0.5 ) | 1.16 1048 | 3.07 1049 | |
| 0.001 (5 ) | 8.77 1045 | 2.13 1048 | |
| imf170-300f | 10-5 (0.05 ) | 2.58 1048 | 7.62 1049 |
| 10-4 (0.5 ) | 1.15 1048 | 3.43 1049 | |
| 0.001 (5 ) | 8.70 1045 | 2.46 1048 | |
6 Summary and concluding remarks
Observational data of high-ionization lines, like HeII, in the reionization era have been recently accumulated, and there is a growing body of evidence that HeII-emitters are more frequent among high-z galaxies. Narrow HeII emission has been claimed to be a good tracer of the elusive PopIII-stars. The HeII line is in comfortable reach of next generation telescopes, like JWST and ELT, which will detect the rest-frame UV of thousands of galaxies during the epoch of reionization. In light of these new and upcoming observations, a more sophisticated understanding of the high-ionization phenomenon at z 0 is pivotal to interpret the data in a physically meaningful manner, and to possibly constrain sources responsible for the H and HeII reionization epochs. Optical MUSE-IFU and X-ray Chandra observations of the nearby, extremely metal-poor bursty-galaxy SBS 0335-052E with nebular HeII emission are presented in this work. Such objects are excellent primordial analogues that can provide clues to the physical properties of galaxies in the early universe.
Based on the MUSE data we created spectral maps of relevant emission lines in the optical range. These data provide us with a new 2D view of the ionized ISM in SBS 0335-052E, in particular the high-ionization nebular HeII4686 line (see also Herenz et al., 2017). We find a highly extended HeII4686-emitting region reaching distances 1.5 Kpc from the youngest SSCs. The HeII4686 map shows three maxima which are offset from the brightest UV SSCs. We took benefit of our IFU data to create 1D spectra of several regions based on the spatial distribution of the HeII4686 emission. For the first time, using the derived SBS 0335-052E integrated spectrum, we recovered the entire nebular HeII emission and compute the corresponding total HeII-ionization budget, Q(HeII)int 3.17 1051 photon s-1. As we showed in Kehrig et al. (2015), this observational quantity is essential to perform a free-aperture investigation on the formation of narrow HeII line.
From our analysis of the combined MUSE and Chandra data, we infer that the Q(HeII) provided by the X-ray emission from SBS 0335-052E is well below the needed value to ionize He+ at the level measured in this galaxy. Although we cannot discard some contribution to the HeII excitation from shocks, our spaxel-by-spaxel study from MUSE favors hot massive stars as the main agent of the HeII ionization in SBS 0335-052E.
Using the MUSE observations we located two WR knots from which one is identified for the first time here. The WR knot spectra reveal the presence of carbon-type WR stars in SBS 0335-052E. In comparison with long-slit or single-fiber spectroscopy, the IFS technique can enhance the contrast of the WR bump emission against the galaxy continuum. This minimizes the WR bump dilution, also allowing the identification of WR stars where they were not detected before (see also Kehrig et al., 2008, 2013). To investigate the stellar source scenario we compare observations with stellar models applying two approaches; a more simple one which makes use of models of (rotating and non-rotating) single massive stars on a star-by-star basis, and a second one based on the new release of stellar population synthesis BPASSv2.1. We demonstrated that both approaches have merits, and taken together, they can provide guidance to interpret the observations. The star-by-star study points out that WRs solely cannot explain the HeII-ionizing energy budget derived for SBS 0335-052E. From the BPASSv2.1 code we show that only the binary models with a ’top-heavy’ IMF (i.e. non-standard IMF) at Z=10-5 (i.e., Z 70 times lower than the Z of the ionized gas in SBS 0335-052E) ) provide sufficient He+-ionizing photons to explain the observed Q(HeII)Int. The approach on a star-by-star basis also suggests that stars more metal-deficient than the galaxy main body are required. Investigating such metallicity discrepancy at z 0 feels the necessity for additional research, and it is fundamental to interpret high-ionization emission in the distant universe.
This paper shows the need to identify nearby, metal-poor HeII-emitters, like SBS 0335-052E. IFS studies of such galaxies enable extended insight into their “realistic” ISM and massive stars, therefore providing constraints on high-redshift galaxy evolution, and on metal-poor stellar models. The work presented here can guide through the preparation of forthcoming searches for primeval objects, one of the main science drivers for next-generation telescopes.
Acknowledgements
We are very grateful to our referee for providing constructive comments and help in improving the manuscript. This work has been partially funded by research project AYA2017-79724-C4-4-P from the Spanish PNAYA. CK, JVM, SD and JIP acknowledge financial support from Junta de Andalucia Excellence Project PEX2011-FQM705. MAG acknowledges support of the grant AYA 2014-57280-P, co-funded with FEDER funds. LKH thanks the IAA-CSIC for warm hospitality in the visit during which the work for this paper was initiated. This work made use of the v2.1 of the Binary Population and Spectral Synthesis (BPASS) models as last described in Eldridge et al. (2017).
References
- Allen et al. (2008) Allen M. G., Groves B. A., Dopita M. A., Sutherland R. S., Kewley L. J., 2008, ApJS, 178, 20-55
- Arnaud (1996) Arnaud K. A., 1996, ASPC, 101, 17
- Asplund et al. (2009) Asplund M., Grevesse N., Sauval A. J., Scott P., 2009, ARA&A, 47, 481
- Bacon et al. (2014) Bacon R., et al., 2014, Msngr, 157, 13
- Baldwin, Phillips, & Terlevich (1981) Baldwin J. A., Phillips M. M., Terlevich R., 1981, PASP, 93, 5
- Belkus et al. (2003) Belkus H., Van Bever J., Vanbeveren D., van Rensbergen W., 2003, A&A, 400, 429
- Berg et al. (2018) Berg D. A., Erb D. K., Auger M. W., Pettini M., Brammer G. B., 2018, arXiv, arXiv:1803.02340
- Blair, Kirshner, & Chevalier (1981) Blair W. P., Kirshner R. P., Chevalier R. A., 1981, ApJ, 247, 879
- Bouwens et al. (2015) Bouwens R. J., Illingworth G. D., Oesch P. A., Caruana J., Holwerda B., Smit R., Wilkins S., 2015, ApJ, 811, 140
- Brinchmann, Kunth, & Durret (2008) Brinchmann J., Kunth D., Durret F., 2008, A&A, 485, 657
- Bromm (2013) Bromm V., 2013, RPPh, 76, 112901
- Brott et al. (2011) Brott I., et al., 2011, A&A, 530, A115
- Brown et al. (2002) Brown T. M., Heap S. R., Hubeny I., Lanz T., Lindler D., 2002, ApJ, 579, L75
- Cassata et al. (2013) Cassata P., et al., 2013, A&A, 556, A68
- Cardelli et al. (1989) Cardelli J. A., Clayton G. C., Mathis J. S., 1989, ApJ, 345, 245
- Cerviño, Mas-Hesse, & Kunth (2002) Cerviño M., Mas-Hesse J. M., Kunth D., 2002, A&A, 392, 19
- Chiappini et al. (2008) Chiappini C., Ekström S., Meynet G., Hirschi R., Maeder A., Charbonnel C., 2008, A&A, 479, L9
- Crowther & Hadfield (2006) Crowther P. A., Hadfield L. J., 2006, A&A, 449, 711
- Crowther (2007) Crowther P. A., 2007, ARA&A, 45, 177
- Davies et al. (2017) Davies R. L., et al., 2017, MNRAS, 470, 4974
- Dijkstra, Mesinger, & Wyithe (2011) Dijkstra M., Mesinger A., Wyithe J. S. B., 2011, MNRAS, 414, 2139
- Dopita & Sutherland (1996) Dopita M. A., Sutherland R. S., 1996, ApJS, 102, 161
- Eldridge, Langer, & Tout (2011) Eldridge J. J., Langer N., Tout C. A., 2011, MNRAS, 414, 3501
- Eldridge et al. (2017) Eldridge J. J., Stanway E. R., Xiao L., McClelland L. A. S., Taylor G., Ng M., Greis S. M. L., Bray J. C., 2017, PASA, 34, e058
- Fialkov, Barkana, & Visbal (2014) Fialkov A., Barkana R., Visbal E., 2014, Natur, 506, 197
- Garcia et al. (2014) Garcia M., Herrero A., Najarro F., Lennon D. J., Alejandro Urbaneja M., 2014, ApJ, 788, 64
- Götberg et al. (2018) Götberg Y., de Mink S. E., Groh J. H., Kupfer T., Crowther P. A., Zapartas E., Renzo M., 2018, arXiv, arXiv:1802.03018
- Götberg, de Mink, & Groh (2017) Götberg Y., de Mink S. E., Groh J. H., 2017, A&A, 608, A11
- Herrero et al. (2012) Herrero A., Garcia M., Puls J., Uytterhoeven K., Najarro F., Lennon D. J., Rivero-González J. G., 2012, A&A, 543, A85
- Garnett et al. (1991) Garnett D. R., Kennicutt R. C., Jr., Chu Y.-H., Skillman E. D., 1991, ApJ, 373, 458
- Georgy, Hirschi, & Ekström (2016) Georgy C., Hirschi R., Ekström S., 2016, arXiv, arXiv:1612.05451
- Gomes et al. (2016) Gomes J. M., et al., 2016, A&A, 588, A68
- Gräfener & Vink (2015) Gräfener G., Vink J. S., 2015, A&A, 578, L2
- Guseva, Izotov, & Thuan (2000) Guseva N. G., Izotov Y. I., Thuan T. X., 2000, ApJ, 531, 776
- Hadfield & Crowther (2007) Hadfield L. J., Crowther P. A., 2007, MNRAS, 381, 418
- Herenz et al. (2017) Herenz E. C., Hayes M., Papaderos P., Cannon J. M., Bik A., Melinder J., Östlin G., 2017, A&A, 606, L11
- Hunter et al. (2008) Hunter I., Lennon D. J., Dufton P. L., Trundle C., Simón-Díaz S., Smartt S. J., Ryans R. S. I., Evans C. J., 2008, A&A, 479, 541
- Izotov et al. (1990) Izotov I. I., Guseva N. G., Lipovetskii V. A., Kniazev A. I., Stepanian J. A., 1990, Natur, 343, 238
- Izotov et al. (1997) Izotov Y. I., Lipovetsky V. A., Chaffee F. H., Foltz C. B., Guseva N. G., Kniazev A. Y., 1997, ApJ, 476, 698
- Izotov et al. (1999) Izotov Y. I., Chaffee F. H., Foltz C. B., Green R. F., Guseva N. G., Thuan T. X., 1999, ApJ, 527, 757
- Izotov et al. (2006) Izotov Y. I., Schaerer D., Blecha A., Royer F., Guseva N. G., North P., 2006, A&A, 459, 71
- Johnson, Hunt, & Reines (2009) Johnson K. E., Hunt L. K., Reines A. E., 2009, AJ, 137, 3788
- Kauffmann et al. (2003) Kauffmann G., et al., 2003, MNRAS, 346,1055
- Kehrig et al. (2008) Kehrig C., Vílchez J. M., Sánchez S. F., Telles E., Pérez-Montero E., Martín-Gordón D., 2008, A&A, 477, 813
- Kehrig et al. (2011) Kehrig C.,Oey M. S., Crowther P. A. et al., 2011, A&A, 526, A128
- Kehrig et al. (2012) Kehrig C.,Monreal-Ibero A., Papaderos P. et al., 2012, A&A, 540, A11
- Kehrig et al. (2013) Kehrig C.,Pérez-Montero E., Vílchez J.M., et al., 2013, MNRAS, 432, 2731
- Kehrig et al. (2015) Kehrig C., Vílchez J. M., Pérez-Montero E., Iglesias-Páramo J., Brinchmann J., Kunth D., Durret F., Bayo F. M., 2015, ApJ, 801, L28
- Kehrig et al. (2016) Kehrig C., et al., 2016, MNRAS, 459, 2992
- Kewley et al. (2001) Kewley L.J., Dopita M.A., Sutherland R.S., Heisler C. A., Trevena J., 2001, ApJ, 556, 121
- Kewley et al. (2006) Kewley L. J., Groves B., Kauffmann G., Heckman T., 2006, MNRAS, 372, 961
- Kewley et al. (2015) Kewley L. J., Zahid H. J., Geller M. J., Dopita M. A., Hwang H. S., Fabricant D., 2015, ApJ, 812, L20
- Kroupa (2001) Kroupa P., 2001, MNRAS, 322, 231
- Kudritzki (2002) Kudritzki R. P., 2002, ApJ, 577, 389
- Langer (2012) Langer N., 2012, ARA&A, 50, 107
- Leitherer (2008) Leitherer C., 2008, IAUS, 255, 305
- Leitherer et al. (2014) Leitherer C., Ekström S., Meynet G., Schaerer D., Agienko K. B., Levesque E. M., 2014, ApJS, 212, 14
- Levesque et al. (2012) Levesque E. M., Leitherer C., Ekstrom S., Meynet G., Schaerer D., 2012, ApJ, 751, 67
- Maeder & Meynet (2012) Maeder A., Meynet G., 2012, RvMP, 84, 25
- Mainali et al. (2017) Mainali R., Kollmeier J. A., Stark D. P., Simcoe R. A., Walth G., Newman A. B., Miller D. R., 2017, ApJ, 836, L14
- Martayan et al. (2007) Martayan C., Frémat Y., Hubert A.-M., Floquet M., Zorec J., Neiner C., 2007, A&A, 462, 683
- Massey (2013) Massey P., 2013, NewAR, 57, 14
- Massey et al. (2014) Massey P., Neugent K. F., Morrell N., Hillier D. J., 2014, ApJ, 788, 83
- Markwardt (2009) Markwardt, C. B., 2009, Astronomical Data Analysis Software and Systems XVIII, 411, 251
- Melnick, Heydari-Malayeri, & Leisy (1992) Melnick J., Heydari-Malayeri M., Leisy P., 1992, A&A, 253, 16
- Meynet & Maeder (2017) Meynet G., Maeder A., 2017, arXiv, arXiv:1711.07740
- Muijres et al. (2012) Muijres L., Vink J. S., de Koter A., Hirschi R., Langer N., Yoon S.-C., 2012, A&A, 546, A42
- Neugent & Massey (2011) Neugent K. F., Massey P., 2011, ApJ, 733, 123
- Osterbrock & Ferland (2006) Osterbrock D. E., Ferland G. J., 2006, Astrophysics of Gaseous Nebulae and Active Galactic Nuclei (CA: University Science Books)
- Papaderos et al. (1998) Papaderos P., Izotov Y. I., Fricke K. J., Thuan T. X., Guseva N. G., 1998, A&A, 338, 43
- Papaderos et al. (2006) Papaderos P., Izotov Y. I., Guseva N. G., Thuan T. X., Fricke K. J., 2006, A&A, 454, 119
- Puls, Vink, & Najarro (2008) Puls J., Vink J. S., Najarro F., 2008, A&ARv, 16, 209
- Reines, Johnson, & Hunt (2008) Reines A. E., Johnson K. E., Hunt L. K., 2008, AJ, 136, 1415
- Russell & Dopita (1990) Russell S. C., Dopita M. A., 1990, ApJS, 74, 93
- Salpeter (1955) Salpeter E. E., 1955, ApJ, 121, 161
- Sana et al. (2012) Sana H., et al., 2012, Sci, 337, 444
- Sana et al. (2014) Sana H., et al., 2014, ApJS, 215, 15
- Sander et al. (2017) Sander A. A. C., Hamann W.-R., Todt H., Hainich R., Shenar T., 2017, A&A, 603, A86
- Schaerer (1996) Schaerer D., 1996, ApJ, 467, L17
- Schaerer & Vacca (1998) Schaerer D., Vacca W. D., 1998, ApJ, 497, 618
- Schaerer (2003) Schaerer D., 2003, A&A, 397, 527
- Schaerer (2008) Schaerer D., 2008, IAUS, 255, 66
- Senchyna et al. (2017) Senchyna P., et al., 2017, MNRAS, 472, 2608
- Shirazi & Brinchmann (2012) Shirazi M., Brinchmann J., 2012, MNRAS, 421, 1043
- Skillman (1985) Skillman E. D., 1985, ApJ, 290, 449
- Smith et al. (1993) Smith R. C., Kirshner R. P., Blair W. P., Long K. S., Winkler P. F., 1993, ApJ, 407, 564
- Smith, Norris, & Crowther (2002) Smith L. J., Norris R. P. F., Crowther P. A., 2002, MNRAS, 337, 1309
- Smith (2014) Smith N., 2014, ARA&A, 52, 487
- Stanway et al. (2014) StanwayE. R., Eldridge J. J., Greis S. M. L., Davies L. J. M.,Wilkins S. M., Bremer M. N., 2014, MNRAS, 444, 3466
- Stanway, Eldridge, & Becker (2016) Stanway E. R., Eldridge J. J., Becker G. D., 2016, MNRAS, 456, 485
- Stark (2016) Stark D. P., 2016, ARA&A, 54, 761
- Szécsi et al. (2015) Szécsi D., Langer N., Yoon S.-C., Sanyal D., de Mink S., Evans C. J., Dermine T., 2015, A&A, 581, A15
- Tramper et al. (2011) Tramper F., Sana H., de Koter A., Kaper L., 2011, ApJ, 741, L8
- Thuan, Izotov, & Lipovetsky (1997) Thuan T. X., Izotov Y. I., Lipovetsky V. A., 1997, ApJ, 477, 661
- Thuan et al. (2004) Thuan T. X., Bauer F. E., Papaderos P., Izotov Y. I., 2004, ApJ, 606, 213
- Thuan & Izotov (2005) Thuan T. X., Izotov Y. I., 2005, ApJS, 161, 240
- Tumlinson & Shull (2000) Tumlinson J., Shull J. M., 2000, ApJ, 528, L65
- Veilleux & Osterbrock (1987) Veilleux S., Osterbrock D. E., 1987, ApJS, 63, 295
- Vílchez & Iglesias-Páramo (1998) Vílchez J.M. & Iglesias-Páramo J., 1998, ApJ, 508, 248
- Vink & de Koter (2005) Vink J. S., de Koter A., 2005, A&A, 442, 587
- Visbal, Haiman, & Bryan (2015) Visbal E., Haiman Z., Bryan G. L., 2015, MNRAS, 450, 2506
- Visbal, Haiman, & Bryan (2016) Visbal E., Haiman Z., Bryan G. L., 2016, MNRAS, 460, L59
- Visbal, Bryan, & Haiman (2017) Visbal E., Bryan G. L., Haiman Z., 2017, MNRAS, 469, 1456
- Windhorst et al. (2006) Windhorst R. A., Cohen S. H., Jansen R. A., Conselice C., Yan H., 2006, NewAR, 50, 113
- Yoon, Dierks, & Langer (2012) Yoon S.-C., Dierks A., Langer N., 2012, A&A, 542, A113
- Zhang et al. (2013) Zhang Y.,Liu J., Zhang F., Han Z., 2013, A&A, 554, A136
- Zhang et al. (2015) Zhang F.,Li L., Cheng L., Wang L., Kang X., Zhuang Y., Han Z., 2015, MNRAS, 447, L21