Impact of magnetic moment and anisotropy of CoFe thin films on the magnetic proximity effect of Pt
Abstract
We present a systematic study of the magnetic proximity effect in Pt, depending on the magnetic moment and anisotropy of adjacent metallic ferromagnets. Element-selective x-ray resonant magnetic reflectivity measurements at the Pt absorption edge (11565 eV) are carried out to investigate the spin polarization of Pt in Pt/CoFe bilayers. We observe the largest magnetic moment of (0.720.03) per spin polarized Pt atom in Pt/CoFe, following the Slater-Pauling curve of magnetic moments in Co-Fe alloys. In general, a clear linear dependence is observed between the Pt moment and the moment of the adjacent ferromagnet. Further, we study the magnetic anisotropy of the magnetized Pt which clearly adopts the magnetic anisotropy of the ferromagnet below. This is depicted for Pt on Fe(001) and on CoFe(001), which have a 45∘ relative rotation of the fourfold magnetocrystalline anisotropy.
The spin polarization of a nominally paramagnetic material generated by the exchange interaction of an adjacent ferro- or ferrimagnetic material, is called magnetic proximity effect (MPE). It is most famous in Pt, which is almost ferromagnetic following the Stoner criterion description Stoner (1938). The MPE is a key element in spintronics Hoffmann and Bader (2015) and spin caloritronics Bauer et al. (2012), since additional effects can contribute when Pt is employed as a spin current detector. For example, an additional proximity-induced anomalous Nernst effect can occur in spin Seebeck effect experiments Huang et al. (2012); Kikkawa et al. (2013); Bougiatioti et al. (2017a). Furthermore, the proximity-induced anisotropic magnetoresistance can hamper spin Hall magnetoresistance studies Althammer et al. (2013).
In normal metal (NM)/ferromagnet (FM) bilayer systems, the conductivity of the FM affects the MPE in the NM, as recently systematically investigated by examining the transition from FM metal (FMM) to FM insulator (FMI), using various oxygen content in Pt/NiFeO bilayers Bougiatioti et al. (2017a). No MPE in Pt could be found except for the metallic Pt/NiFe case without any oxygen. Although the MPE varies for different material combinations (e.g. FMIs vs. FMMs), general systematic studies of the MPE dependence on material parameters within one class of material are quite rare. The two most important properties of magnetic materials are the magnetic moment and the magnetic anisotropy. Therefore, in this work we systematically investigate the MPE dependence on the FM moment and FM anisotropy in NM/FMM systems.
One way to investigate the MPE is to use x-ray magnetic circular dichroism (XMCD), allowing to extract the absolute magnetic moment per atom of each element Schütz et al. (1989, 1990); Maruyama et al. (1993); Antel et al. (1999); Wilhelm et al. (2000); Poulopoulos et al. (2001); Wilhelm et al. (2003); Suzuki et al. (2005); Lu et al. (2013); Geprägs et al. (2012, 2013); Valvidares et al. (2016); Collet et al. (2017); Kikkawa et al. (2017). A much younger technique to investigate the magnetic properties of layer systems with element- and depth-sensitivity, is x-ray resonant magnetic reflectivity (XRMR) that is based on the spin-dependent interference of light reflected from the interfaces in the system Macke and Goering (2014). This method even detects magnetic moments at buried interfaces for thicker layers Kuschel et al. (2015), when XMCD is not sensitive anymore. In previous studies, we investigated the spin polarization in Pt of Pt/NiFeOx () bilayers Kuschel et al. (2015, 2016); Bougiatioti et al. (2017a), in order to evaluate the proximity-induced contributions to the inverse spin Hall and anomalous Nernst voltages, while studying the transport phenomena on the samples Bougiatioti et al. (2017a, b). In addition, we examined Pt/FMM bilayers providing information about the spatial distribution of the spin polarization of Pt, across the interface to a FMM Kuschel et al. (2015, 2016); Klewe et al. (2016).
In this work, we investigate the induced spin polarization in Pt on top of a class of material that changes the magnetic moment and anisotropy systematically with its content. This material is CoFe with a maximum magnetic moment for CoFe and differently oriented magnetic anisotropy depending on the Fe content. We use XRMR to extract the Pt magnetic moments and compare the results with the magnetic moment for the CoFe layers. In addition, we detect XRMR magnetic field loops to study the magnetic anisotropy solely in the spin-polarized Pt and to compare to magnetic field loops of the CoFe layer, collected via magnetooptic Kerr effect (MOKE). For both strength of magnetic moment and magnetic anisotropy, we find a clear correlation between the spin polarized Pt and the FMM below.
We fabricated Pt/CoFe bilayers with x =, by dc magnetron sputter deposition on top of (001)-oriented MgO substrates at room temperature (RT). The FMM layers were prepared with and without Pt in-situ deposited on top, by covering one FMM layer with a mask. The Ar pressure during the deposition for both CoFe and Pt layers was equal to mbar and the base pressure of the chamber was mbar. The appropriate sputter parameters were adjusted after evaluating the x-ray fluorescence spectra to achieve the desired composition.
The XRMR and XMCD measurements were carried out at the resonant scattering and diffraction beamline P09 of the third generation synchrotron PETRA III at DESY (Hamburg, Germany) Strempfer et al. (2013). A fundamental theoretical background behind XRMR includes the determination of the magnetooptic parameters and which correspond to the magnetic change of the dispersion and absorption coefficients, respectively, of the investigated material exposed to x-rays of the element’s absorption energy. In our case, the x-ray reflectivity (XRR) I± for left and right circularly polarized light, respectively, was detected off resonance (11465 eV) and at resonance at the L absorption edge of Pt (11565 eV), switching fast the helicity of incident circular polarization Strempfer et al. (2013). Afterwards, the XRMR asymmetry ratio = was calculated and the magnetic moment per Pt atom extracted using a spin depth profile model that results in a simulated asymmetry ratio fitting the experimental data. Further details of the XRMR technique, experiment, data processing, and fitting can be found in the Supplemental Material SM (Chap. I). The XMCD spectrum was collected using an energy dispersive silicon drift detector synchronized with the piezo-actuators underneath the phase plates, allowing for the fluorescent photons for left and right circular polarized incident light to be counted separately at every point of the scan.
In order to investigate the magnetic anisotropy of the spin polarized Pt layer, we collected XRMR magnetic field loops for different in-plane sample orientations and a fixed scattering vector that corresponds to a maximum asymmetry ratio ( is wavelength and is angle of incidence).
Figure 1(a) presents the XRMR asymmetry ratio for the Pt/CoFe bilayer plotted against the scattering vector . The effect changes sign when the magnetic field direction is reversed which confirms its magnetic origin. Figure 1(b) depicts the experimental energy dependant x-ray absorption spectrum (XAS, green line) at the Pt L edge normalized to the edge jump, after the subtraction of a linear background. The XMCD intensity ()/2 is also displayed in the figure and was extracted to identify the energy with the largest dichroism. The magnetic dichroism of the spin polarized Pt has its maximum slightly below the absorption maximum (dashed line) which is in agreement with previous findings Geissler et al. (2001); Kuschel et al. (2015); Klewe et al. (2016); Kuschel et al. (2016) and, thus, the chosen energy to collect the XRMR data was at 11565 eV.
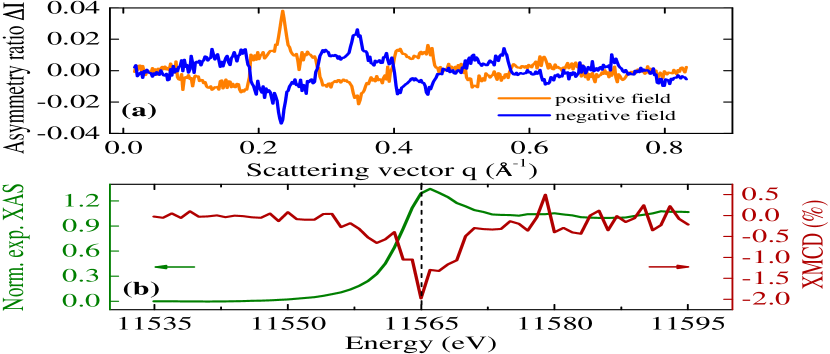
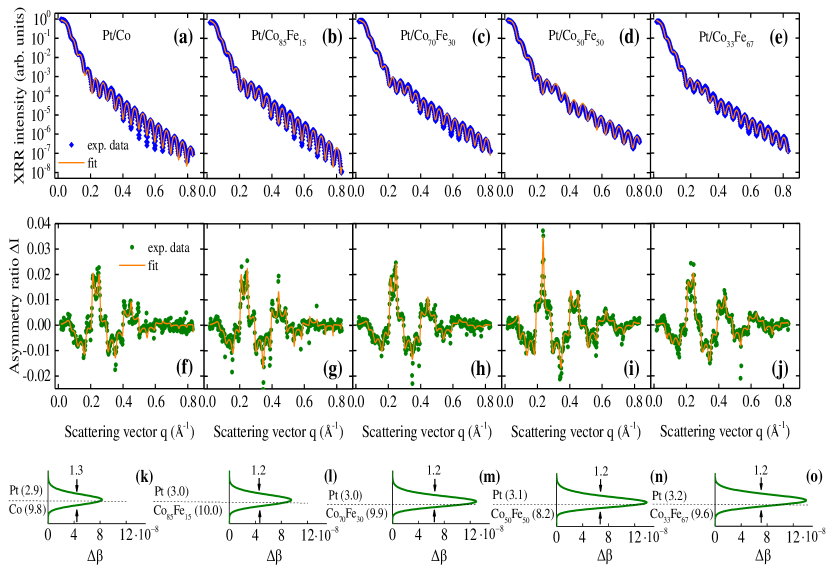
Figure 2 presents the XRR and XRMR data as well as the resulting magnetooptic depth profiles for all Pt/CoFe bilayers. Figures 2(a)-(e) show the averaged resonant magnetic XRR scans, collected at a photon energy of 11565 eV, plotted against the scattering vector and accompanied by their fittings. Kiessig fringes appear in all scans due to the interference of the reflected light from the Pt/CoFe and CoFe/MgO interfaces. By fitting the off-resonant (11465 eV) XRR curves we obtain the thickness (indicated in Figs. 2(k)-(o)) and roughness (typical values for the NM/FMM interfaces are between 0.20 nm and 0.38 nm), using literature and values for the individual layers. In a second step, we kept the structural parameters fixed for fitting the averaged resonant (11565 eV) XRR curves following the description of Klewe et al. Klewe et al. (2016), thus, obtaining the resonant and values. When fitting the XRMR asymmetry ratios the structural parameters from the off-resonant XRR fit and the optical values from the resonant XRR fit have been kept fixed and just the depth profile has been varied.
The derived XRMR asymmetry ratios () are illustrated in Figs. 2(f)-(j), plotted together with the corresponding fittings. In all cases, pronounced oscillations are visible with an amplitude of about 2 comparable to our prior studies Kuschel et al. (2015); Klewe et al. (2016); Kuschel et al. (2016); Bougiatioti et al. (2017a) and additional maxima that can reach up to 4, unveiling an induced spin polarization in Pt.
Figures 2(k)-(o) display the magnetooptic depth profiles of , which were used to fit the XRMR asymmetry ratios in Figs. 2(f)-(j). The magnetooptic profiles were generated by a Gaussian function at the Pt/CoFe interface, convoluted with the roughness profile of the corresponding layer Klewe et al. (2016). For all magnetooptic profiles, we extracted the full width at half maximum (FWHM) which represents the effective thickness of the spin polarized Pt layer at the Pt/CoFe interface. This effective spin polarized Pt thickness is between 1.2 nm and 1.3 nm for all samples, as indicated in Figs. 2(k)-(o). By comparing the experimental fit values of with the ab initio calculations of Ref. Kuschel et al. (2015), we extracted the magnetic moment per spin polarized Pt atom at the maximum of the magnetooptic profile, as summarized in Table I of the Supplemental Materials SM (Chap. II) for all FMM compositions.
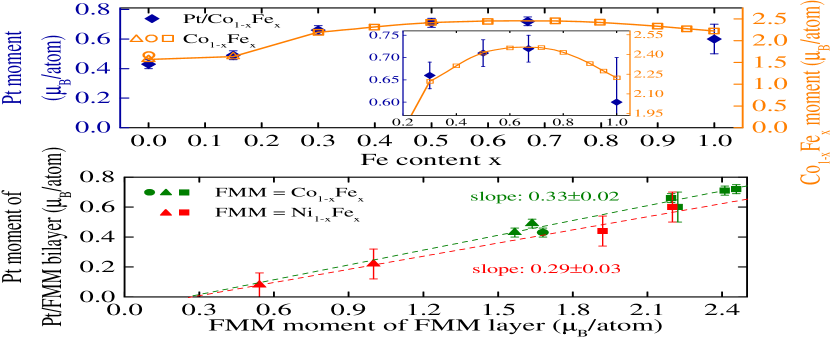
Figure 3(a) presents the Pt magnetic moment for all samples (blue points), plotted against the Fe content x together with the magnetic moment values of the CoFe alloys (orange data), taken from Ref. Bonnenberg et al. (1986). The error bars are estimated by changing the values until the goodness of fit value increases up to 20. In our prior studies Kuschel et al. (2015); Klewe et al. (2016); Kuschel et al. (2016); Bougiatioti et al. (2017a) we just roughly estimated the uncertainty, therefore, the previous error values have been slightly larger. The inset depicts a close-up plot of the graph. As visible, the magnetic moments in Pt clearly exhibit a similar progress as the magnetic moments in the CoFe alloys, which follow the Slater-Pauling curve Bozorth (1951). Both Pt and FMM moments increase with increasing x, peaking at a certain content ratio which is the CoFe alloy for the literature values and the Pt/CoFe bilayer for our experimental data. For further increase of Fe content, both Pt and FMM moments decrease. Consequently, we conclude that the strength of the magnetic coupling between the two layers depends on the magnitude of the magnetic moment in the FMM, as indicated by Klewe et al. for Pt/NiFe bilayers Klewe et al. (2016) and by Poulopoulos et al. Poulopoulos et al. (2001) for Ni/Pt multilayers. This is valid as long as Pt is deposited on FMMs. If Pt is grown on magnetic semiconductors or insulators, the dependence of Pt moment on FM moment can be different or nonexistent due to a vanishing MPE Geprägs et al. (2012, 2013); Kuschel et al. (2015, 2016); Valvidares et al. (2016); Collet et al. (2017); Bougiatioti et al. (2017a).
Figure 3(b) exhibits the dependence of Pt magnetic moment on the FMM magnetic moment for both Pt/CoFe (green points) and Pt/NiFe (red points, taken from Refs. Klewe et al. (2016); Kuschel et al. (2015)) bilayers. The dashed lines are linear fits of the data and indicate the linear dependence between the Pt and FMM magnetic moments in such bilayer systems. In addition, the slopes of both curves, as depicted in the graph, are comparable to each other considering the errors. The slope of the Pt moment linear dependence on the FMM moment might be interpreted as the distance to the Stoner criterion. The systematic behaviour for Pt on top of other classes of materials (such as semiconductors or slightly oxygen-reduced ferrites Bougiatioti et al. (2017a)) or for other NM materials (such as Pd) on FMMs, will be part of future work.
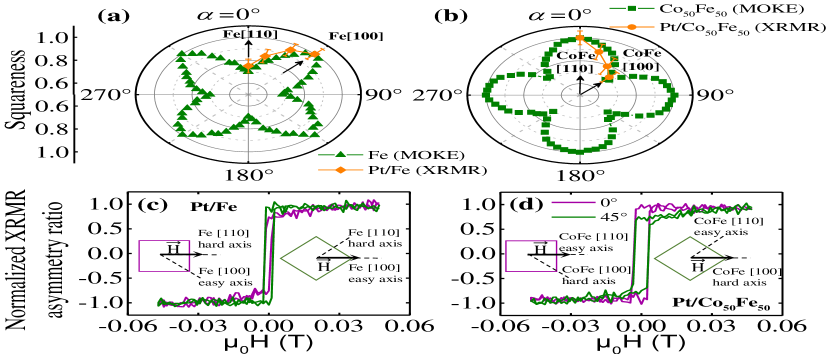
As a next step, we investigated the magnetic anisotropy of Fe and CoFe samples by performing MOKE rotational measurements with different in-plane crystal orientation directions ( in steps of ), in the presence of an in-plane magnetic field. The azimuthal angle corresponds to the angle between the direction of the applied magnetic field and the [110] direction of the corresponding alloy, as sketched in the inset of Figs. 4(c) and (d). In order to examine the magnetic anisotropy of the spin polarized Pt layer, we collected XRMR field loop measurements, for different sample orientations ( in steps of ).
Figures 4(a) and (b) present the squareness which is the ratio between the magnetic remanence and the saturation magnetization, extracted from the MOKE loops (not shown) for the Fe and CoFe samples and from XRMR field loops for the Pt/Fe and Pt/CoFe samples. For the Fe film (cf. Fig. 4(a)), the MOKE measurements reveal magnetic easy axes along the Fe100 directions, which correspond to the MgO110 directions () with high remanence values and magnetic hard axes along the the Fe110 directions corresponding to the MgO100 directions () with low remanence values J.L Costa-Krämer and J.L Menéndez and A
Cebollada and F Briones and D Garciá and A
Hernando (2000); T Kuschel and H Bardenhagen and H Wilkens and R
Schubert and J Hamrle and J Pištora and J
Wollschläger (2011). On the other hand, for the CoFe sample (cf. Fig. 4(b)) the four-fold magnetic anisotropy is 45∘ rotated compared to Fe. Therefore, the magnetic easy axes for the CoFe sample are aligned along the CoFe110 directions which are the MgO100 directions with high remanence values, whereas the magnetic hard axes are aligned along the CoFe100 directions corresponding to the MgO110 directions with low remanence values Shikada et al. (2009); T Kuschel and J Hamrle and J Pištora and K Saito
and S Bosu and Y Sakuraba and K Takanashi and J
Wollschläger (2012).
In Figs. 4(c) and (d) two normalized XRMR field loops for Pt/Fe and Pt/CoFe samples are illustrated for and , respectively. For the Pt/Fe bilayer (Fig. 4(c)), the spin polarized Pt layer showed the magnetic easy axis for (green curve) and the magnetic hard axis for (purple curve), which is consistent with the results extracted from the previously analyzed MOKE measurements of the pure Fe layer. In addition, for the Pt/CoFe sample (Fig. 4(d)) the magnetic easy axis appeared for (purple curve) and the magnetic hard axis was found at (green curve), which also coincides with the MOKE results of the pure CoFe film. Moreover, the extracted squareness values from the XRMR field loops for the Pt/Fe and Pt/CoFe samples are included in Figs. 4(a) and (b), respectively. The obtained results clearly show that the magnetic anisotropy of the spin polarized Pt layer on top of the FMM (where FMM is Fe or CoFe) adopts the magnetic anisotropy of the FMM.
In conclusion, we investigated the dependence of the MPE of Pt on the magnetic moment and anisotropy of different FMMs below, performing XRMR and MOKE measurements. We fabricated Pt/CoFe bilayers by dc magnetron sputter deposition on top of (001)-oriented MgO substrates. The XRMR asymmetry ratios were quantitatively analyzed and the largest spin polarization was found in Pt/CoFe with a magnetic moment equal to per spin polarized Pt atom. We also found that the magnetic moment in Pt follows the Slater-Pauling curve of magnetic moments in CoFe alloys. In addition, the Pt moment is increasing linearly with the FMM moment and the slope of this linear dependence is quite similar when we compare the Pt/NiFe and Pt/CoFe bilayers. Furthermore, we examined the correlation between the magnetic anisotropy in the FMM layers (Fe and CoFe extracted via MOKE measurements) and the magnetic anisotropy of the spin polarized Pt layer (extracted via magnetic reflectivity measurements at the Pt L3 absorption edge) of the Pt/Fe and Pt/CoFe bilayers. The magnetic anisotropy of the spin polarized Pt layer reflects the magnetic anisotropy of the FMM in the corresponding alloy. Thus, we can conclude, that the Pt nicely follows the FMM magnetization strength and orientation. For Pt on FMIs this is still an open question beside the general question of MPE in Pt/FMIs and will be explored in future research. Moreover, additional research should be conducted in such bilayer systems to create a full FM moment and conductivity mapping of the MPE in various NMs, to further elucidate the details of the MPE mechanism.
The authors gratefully acknowledge financial support by the Deutsche Forschungsgemeinschaft (DFG) within the Priority Program Spin Caloric Transport (SPP 1538, KU 3271/1–1) and the Deutsche Elektronen Synchrotron (DESY). Further they are grateful for the opportunity to work at beamline P09, PETRA III at the Deutsche Elektronen Synchrotron, a member of the Helmholtz Association (HGF) and for technical support by David Reuther and Jörg Strempfer. They also thank Günter Reiss from Bielefeld University, Germany, for making available the laboratory equipment needed for sample preparation and characterization.
References
- Stoner (1938) E. C. Stoner, Proc. R. Soc. 165, 372 (1938).
- Hoffmann and Bader (2015) A. Hoffmann and S. D. Bader, Phys. Rev. Applied 4, 047001 (2015).
- Bauer et al. (2012) G. E. W. Bauer, E. Saitoh, and B. J. van Wees, Nat. Mater. 11, 391 (2012).
- Huang et al. (2012) S. Y. Huang, X. Fan, D. Qu, Y. P. Chen, W. G. Wang, J. Wu, T. Y. Chen, J. Q. Xiao, and C. L. Chien, Phys. Rev. Lett. 109, 107204 (2012).
- Kikkawa et al. (2013) T. Kikkawa, K. Uchida, Y. Shiomi, Z. Qiu, D. Hou, D. Tian, H. Nakayama, X.-F. Jin, and E. Saitoh, Phys. Rev. Lett. 110, 067207 (2013).
- Bougiatioti et al. (2017a) P. Bougiatioti, C. Klewe, D. Meier, O. Manos, O. Kuschel, J. Wollschläger, L. Bouchenoire, S. D. Brown, J.-M. Schmalhorst, G. Reiss, and T. Kuschel, Phys. Rev. Lett. 119, 227205 (2017a).
- Althammer et al. (2013) M. Althammer, S. Meyer, H. Nakayama, M. Schreier, S. Altmannshofer, M. Weiler, H. Huebl, S. Geprägs, M. Opel, R. Gross, D. Meier, C. Klewe, T. Kuschel, J.-M. Schmalhorst, G. Reiss, L. Shen, A. Gupta, Y.-T. Chen, G. E. W. Bauer, E. Saitoh, and S. T. B. Goennenwein, Phys. Rev. B 87, 224401 (2013).
- Schütz et al. (1989) G. Schütz, R. Wienke, W. Wilhelm, W. Wagner, R. Frahm, and P. Kienle, Physica B 158, 284 (1989).
- Schütz et al. (1990) G. Schütz, R. Wienke, W. Wilhelm, W. B. Zeper, H. Ebert, and K. Spörl, J. Appl. Phys. 67, 4456 (1990).
- Maruyama et al. (1993) H. Maruyama, A. Koizumi, K. Kobayashi, and H. Yamazaki, Jpn. J. Appl. Phys. 32, 290 (1993).
- Antel et al. (1999) W. J. Antel, M. M. Schwickert, T. Lin, W. L. O’Brien, and G. R. Harp, Phys. Rev. B 60, 12933 (1999).
- Wilhelm et al. (2000) F. Wilhelm, P. Poulopoulos, G. Ceballos, H. Wende, K. Baberschke, P. Srivastava, D. Benea, H. Ebert, M. Angelakeris, N. K. Flevaris, D. Niarchos, A. Rogalev, and N. B. Brookes, Phys. Rev. Lett. 85, 413 (2000).
- Poulopoulos et al. (2001) P. Poulopoulos, F. Wilhelm, H. Wende, G. Ceballos, K. Baberschke, D. Benea, H. Ebert, M. Angelakeris, N. K. Flevaris, A. Rogalev, and N. B. Brookes, J. Appl. Phys. 89, 3874 (2001).
- Wilhelm et al. (2003) F. Wilhelm, P. Poulopoulos, A. Scherz, H. Wende, K. Baberschke, M. Angelakeris, N. K. Flevaris, J. Goulon, and A. Rogalev, Phys. Status Solidi A 196, 33 (2003).
- Suzuki et al. (2005) M. Suzuki, H. Muraoka, Y. Inaba, H. Miyagawa, N. Kawamura, T. Shimatsu, H. Maruyama, N. Ishimatsu, Y. Isohama, and Y. Sonobe, Phys. Rev. B 72, 054430 (2005).
- Lu et al. (2013) Y. M. Lu, Y. Choi, C. M. Ortega, X. M. Cheng, J. W. Cai, S. Y. Huang, L. Sun, and C. L. Chien, Phys. Rev. Lett. 110, 147207 (2013).
- Geprägs et al. (2012) S. Geprägs, S. Meyer, S. Altmannshofer, M. Opel, F. Wilhelm, A. Rogalev, R. Gross, and S. T. B. Goennenwein, Appl. Phys. Lett. 101, 262407 (2012).
- Geprägs et al. (2013) S. Geprägs, S. T. B. Goennenwein, M. Schneider, F. Wilhelm, K. Ollefs, A. Rogalev, M. Opel, and R. Gross, arXiv:1307.4869 (2013).
- Valvidares et al. (2016) M. Valvidares, N. Dix, M. Isasa, K. Ollefs, F. Wilhelm, A. Rogalev, F. Sánchez, E. Pellegrin, A. Bedoya-Pinto, P. Gargiani, L. E. Hueso, F. Casanova, and J. Fontcuberta, Phys. Rev. B 93, 214415 (2016).
- Collet et al. (2017) M. Collet, R. Mattana, J.-B. Moussy, K. Ollefs, S. Collin, C. Deranlot, A. Anane, V. Cros, F. Petroff, F. Wilhelm, and A. Rogalev, Appl. Phys. Lett. 111, 202401 (2017).
- Kikkawa et al. (2017) T. Kikkawa, M. Suzuki, J. Okabayashi, K.-i. Uchida, D. Kikuchi, Z. Qiu, and E. Saitoh, Phys. Rev. B 95, 214416 (2017).
- Macke and Goering (2014) S. Macke and E. Goering, J. Phys.: Condens. Matter 26, 363201 (2014).
- Kuschel et al. (2015) T. Kuschel, C. Klewe, J.-M. Schmalhorst, F. Bertram, O. Kuschel, T. Schemme, J. Wollschläger, S. Francoual, J. Strempfer, A. Gupta, M. Meinert, G. Götz, D. Meier, and G. Reiss, Phys. Rev. Lett. 115, 097401 (2015).
- Kuschel et al. (2016) T. Kuschel, C. Klewe, P. Bougiatioti, O. Kuschel, J. Wollschläger, L. Bouchenoire, S. D. Brown, J. M. Schmalhorst, D. Meier, and G. Reiss, IEEE Trans. Magn. 52, 4500104 (2016).
- Bougiatioti et al. (2017b) P. Bougiatioti, O. Manos, C. Klewe, D. Meier, N. Teichert, J.-M. Schmalhorst, T. Kuschel, and G. Reiss, J. Appl. Phys. 122, 225101 (2017b).
- Klewe et al. (2016) C. Klewe, T. Kuschel, J.-M. Schmalhorst, F. Bertram, O. Kuschel, J. Wollschläger, J. Strempfer, M. Meinert, and G. Reiss, Phys. Rev. B 93, 214440 (2016).
- Strempfer et al. (2013) J. Strempfer, S. Francoual, D. Reuther, D. K. Shukla, A. Skaugen, H. Schulte-Schrepping, T. Kracht, and H. Franz, J. Synchrotron Radiat. 20, 541 (2013).
- (28) See Supplemental Material at [URL] for additional information about the XRMR technique and the extracted magnetic moments .
- Geissler et al. (2001) J. Geissler, E. Goering, M. Justen, F. Weigand, G. Schütz, J. Langer, D. Schmitz, H. Maletta, and R. Mattheis, Phys. Rev. B 65, 020405 (2001).
- Bonnenberg et al. (1986) D. Bonnenberg, K. A. Hempel, and H. Wijn, Atomic magnetic moment, magnetic moment density, g and g’ factor (Springer-Verlag Berlin Heidelberg, 1986).
- Bozorth (1951) D. M. Bozorth, Ferromagnetism (Van Nostrand, New York, 1951).
- J.L Costa-Krämer and J.L Menéndez and A Cebollada and F Briones and D Garciá and A Hernando (2000) J.L Costa-Krämer and J.L Menéndez and A Cebollada and F Briones and D Garciá and A Hernando, J. Magn. Magn. Mater. 210, 341 (2000).
- T Kuschel and H Bardenhagen and H Wilkens and R Schubert and J Hamrle and J Pištora and J Wollschläger (2011) T Kuschel and H Bardenhagen and H Wilkens and R Schubert and J Hamrle and J Pištora and J Wollschläger, J. Phys. D: Appl. Phys. 44, 265003 (2011).
- Shikada et al. (2009) K. Shikada, M. Ohtake, F. Kirino, and M. Futamoto, J. Appl. Phys. 105, 07C303 (2009).
- T Kuschel and J Hamrle and J Pištora and K Saito and S Bosu and Y Sakuraba and K Takanashi and J Wollschläger (2012) T Kuschel and J Hamrle and J Pištora and K Saito and S Bosu and Y Sakuraba and K Takanashi and J Wollschläger, J. Phys. D: Appl. Phys. 45, 495002 (2012).