Afterburst thermal relaxation in neutron star crusts
Abstract
We study thermal relaxation in a neutron star after internal heating events (outbursts) in the crust. We consider thin and thick spherically symmetric heaters, superfluid and non-superfluid crusts, stars with open and forbidden direct Urca processes in their cores. In particular, we analyze long-term thermal relaxation after deep crustal heating produced by nuclear transformations in fully or partly accreted crusts of transiently accreting neutron stars. This long-term relaxation has a typical relaxation time and an overall finite duration time for the crust to thermally equilibrate with the core. Neutron superfluidity in the inner crust greatly affects the relaxation if the heater is located in the inner crust. It shortens and unifies the time of emergence of thermal wave from the heater to the surface. This is important for the interpretation of observed outbursts of magnetars and transiently accreting neutron stars in quasi-persistent low-mass X-ray binaries.
1 Introduction
Neutron stars are born hot in supernova explosions but then gradually cool down loosing their internal thermal energy via neutrino emission from their interiors and via the thermal surface radiation, as reviewed, e.g., by Yakovlev and Pethick (2004); Page et al. (2006); Potekhin et al. (2015). A study of cooling neutron stars allows one to explore still poorly known properties of dense matter in neutron star interiors. For instance, investigation of middle-aged isolated ordinary neutron stars may give valuable information on neutrino emission mechanisms and superfluid properties of neutron star cores – bulky internal regions containing about 99 per cent of the neutron star mass (e.g., Haensel et al. 2007). Such stars are isothermal inside because of high internal thermal conduction, with substantial temperature gradients persisting only in the so called heat blanketing envelopes near their surface, not wider than a few hundred meters; e.g., Potekhin et al. (2015). Owing to a high thermal conductivity, the stellar core is thermally coupled to the crust, so that the thermal luminosity reflects physical conditions in the core.
The situation is more complicated if neutron stars are reheated from inside. The reheating mechanisms have been reviewed, e.g., by Yakovlev and Pethick 2004; Page et al. 2006, and in references therein. These mechanisms (for instance, reheating by differential rotation or ohmic decay of magnetic fields) can operate in different places of the star, in its core and/or crust. The deeper the heating, the larger fraction of the heat is emitted by neutrinos, and the weaker the thermal surface luminosity (e.g., Kaminker et al. 2006, 2014 and references therein).
In this paper, we continue to study the effects of the heaters, which produce outbursts in the crust, and subsequent relaxation of the surface thermal emission. The aim is to elaborate the methods of inferring the properties of the heaters from observations of the surface emission. In particular, we expect that our results will be useful for the interpretation of observations of old transiently accreting neutron stars in low-mass X-ray binaries (LMXBs) and warm active magnetars. As suggested by Haensel and Zdunik (1990b); Brown et al. (1998), neutron stars in LMXBs can be reheated by nuclear transformations (deep crustal heating processes) in the accreted crust. This mechanism has been elaborated later (e.g., Shternin et al. 2007; Brown and Cumming 2009; Page and Reddy 2012, 2013; Turlione et al. 2015; Medin and Cumming 2014; Homan et al. 2014; Merritt et al. 2016; Ootes et al. 2018). Magnetars, which are mainly hot, middle-aged and active neutron stars (reviewed, e.g. by Mereghetti 2013; Kaspi and Beloborodov 2017) are most probably reheated by the processes related to strong magnetic fields (e.g. Pons et al. 2009; Pons and Perna 2011; Pons and Rea 2012; Viganò et al. 2013; Beloborodov and Li 2016; Li et al. 2016; Coti Zelati et al. 2018 and references therein).
We have selected the crustal heaters because they are closer to the stellar surface; it is easier for them to affect the thermal surface emission. Such heaters can break isothermality of neutron star interiors and violate then the thermal coupling between the core and the surface but establish the thermal coupling between the heater and the surface. In the latter case, the star becomes a natural laboratory of its heater. In the first part of this paper we do not specify the nature of the heater but treat it in a phenomenological way. For quasi-stationary heaters, we have done it earlier (Kaminker et al., 2006, 2007, 2009, 2014). Recently, we have considered variable heaters in a non-superfluid crust (Chaikin et al., 2017). Now we study stars with neutron superfluidity in the inner crust which is known to be important (e.g. Brown and Cumming 2009). Preliminary results of these studies have been reported by Kaminker et al. (2017).
In Sections 2 and 3 we outline microphysics input and our cooling code. In Section 4 we model the heaters operating in thin spherical layers. In Sections 5 and 6 we apply the theory for the interpretation of the long-term relaxation in neutron stars entering quasi-persistent LMXBs. Conclusions are formulated in Section 7.
2 Numerical simulations
To simulate thermal evolution of a neutron star we use our one-dimensional code written in Python programming language. As in Chaikin et al. (2017); Kaminker et al. (2017), we consider a spherically symmetric neutron star including the effects of General Relativity. We use a mesh of 350 radial spherical cells from the stellar center to the density g cm-3 at the bottom of the heat blanketing envelope (e.g., Gudmundsson et al. 1983; Potekhin et al. 1997; Beznogov et al. 2016); can be varied depending on the problem (e.g., Beznogov et al. 2016). For the densities , we use separately calculated relations, where is the temperature at and is the local effective temperature of the stellar surface. Our code is based on the implicit Euler backward method, which easily handles high temperature gradients and stabilizes simulations under abrupt releases of heater’s energy in the star.
We consider two neutron star models with the BSk21 equation of state of nucleon matter in the core (e.g. Potekhin et al. 2013). The gravitational masses of these stars are and , their circumferential radii are and km, and their surface gravities are and cm s-2, respectively.
For simplicity, we neglect the effects of nucleon superfluidity in the star’s core but include them in the crust where the heaters are located. The star is an example of the standard neutrino candle whose neutrino cooling is mainly provided by the modified Urca process of neutrino emission from the star’s core (e.g., Yakovlev et al. 2001 and references therein). The star has a central kernel where the powerful direct Urca neutrino process is allowed (Lattimer et al., 1991); it undergoes fast neutrino cooling. While studying transient thermal processes in a crust one often considers the effect of ion impurities on the electron thermal conductivity (e.g., Page and Reddy 2012). We neglect the impurities here to avoid introducing largely unknown impurity distribution.
We treat the heater as a spherical layer where a given heat power [erg s-1 cm-3] is released. The total redshifted heat power [erg s-1] is
| (1) |
where d is a proper volume element and is the metric function that determines gravitational redshift (e.g., Haensel et al. 2007). The cooling code calculates the redshifted effective surface temperature and redshifted surface thermal luminosity . The problem is whether the variations are observable.
3 Superfluidity
Earlier we (Chaikin et al., 2017) have studied this problem neglecting superfluidity. However, neutron stars are thought to be superfluid inside. A comprehensive review of superfluidity is given by Page et al. (2014). In our case, free neutrons can be superfluid due to the singlet-state () Cooper pairing in the inner crust (at densities higher than the neutron drip density g cm-3). Also, neutrons can be superfluid owing to the triplet-state pairing, and protons owing to the singlet-state pairing in the star’s core. Each superfluidity is characterized by appropriate critical temperature which depends on pairing particles and pairing type as well as on . A study of is a fundamental problem of neutron star physics. Calculations of are complicated because of many-body (polarization) effects. Various versions of many-body theories lead to vastly different . In this situation, it is instructive to try different theoretical versions. As mentioned above, we assume a non-superfluid core and study the difference in the behavior between superfluid and non-superfluid neutrons in the inner crust.
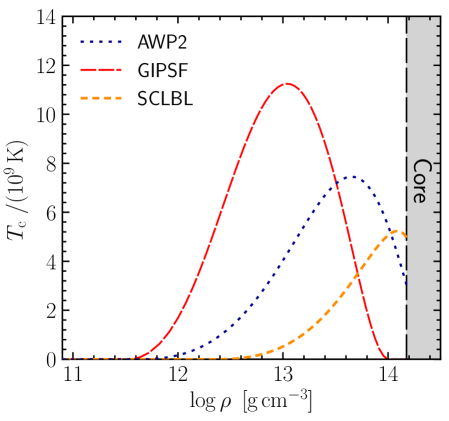
We consider three models of in the crust (Fig. 1). The GIPSF (Gandolfi–Illarionov–Pederiva–Schmidt–Fantoni; Gandolfi et al. 2009) model is close to the pure BCS (Bardeen–Cooper–Schrieffer) model and gives high and broad peak. It can strongly affect . The AWP2 (Ainsworth–Wambach–Pines; Ainsworth et al. 1989) model is stronger affected by the in-medium polarization effects; it weakens the influence of superfluidity on . The SCLBL (Schulze–Cugnon–Lejeune–Baldo–Lombardo; Schulze et al. 1996) model is significant only if the heater is placed deeper in the crust.
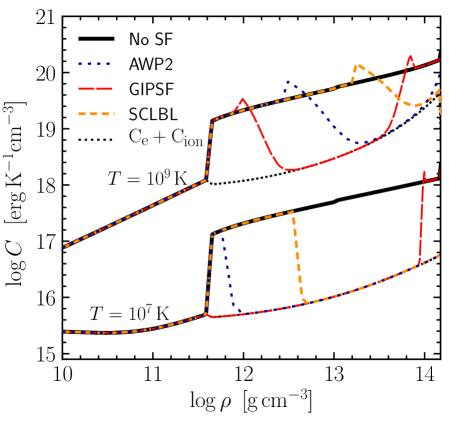
The strongest effect of superfluidity in the crust is the effect on the volumetric heat capacity of the matter, (e.g., Yakovlev et al. 1999; Potekhin et al. 2015). We do not distinguish the heat capacities at constant volume and pressure, because the difference is very small (e.g., Haensel et al. 2007). In the absence of superfluidity, at , the main contribution to the heat capacity of the inner crust comes from free neutrons, but at this contribution is greatly suppressed by a gap in the energy spectra of superfluid neutrons. Then the heat capacity is mostly determined by much smaller contributions of ions (atomic nuclei) and electrons (Fig. 2). The main processes of neutrino emission in the crust are not affected by superfluidity of neutrons (Yakovlev et al., 2001; Potekhin et al., 2015). The thermal conductivity in the crust, that is mainly provided by degenerate electrons, is unaffected by neutron superfluidity as well (e.g., Potekhin et al. 2015).
4 Thin heating layer
Here we follow Chaikin et al. (2017) and treat the heater as a thin spherical shell located at , where and are some boundary values. Simulations are performed in a few steps. First, an initially hot star cools freely until thermal equilibrium is reached within the star. Then we turn on a stationary heater with a time-independent heat power , , and wait until the history of the initial thermal evolution is forgotten and a stationary state within the star is established. After that we generate the heater’s outburst, , and calculate as well as the surface luminosity .
The duration of surface outbursts is mainly determined by a heat diffusion time . According to Henyey and L’Ecuyer (1969), the diffusion time along the radial coordinate in an interval can be estimated as
| (2) |
where and are, respectively, the thermal conductivity and heat capacity per unit volume. Hence, is regulated by the ratio.
In a star with an internal temperature K, mainly increases with growing and with the growth of at . However it may decrease with the growth of at under the effect of crustal superfluidity; e.g., Brown and Cumming (2009); Page and Reddy (2013); Potekhin et al. (2015) and references therein.
The relaxation times and for the heat flows directed outside and inside the star can be estimated by integrating in (2) from the surface to the heater and from the heater to the crust-core interface, respectively. The outburst evolution is determined by and as well as by the duration of the internal outburst. The time regulates direct diffusion to the surface that is most important for . Also, is indirectly affected by that mainly controls the heat flow inside the star.
Note that calculated lightcurves are accurately computed by our code at timescales longer than the scale of heat diffusion through the heat blanketing envelope (, Section 2). This limits the time resolution of the code; depends on the choice of (i.e., on geometrical thickness of the heat blanket), on chemical composition of the blanket and on the value of (see, e.g., Beznogov et al. 2016; Chaikin et al. 2017); can be estimated from the same equation (2).
For an star which has km and a non-redshifted surface temperature K, with the heat blanketing envelope made of iron and extended to , we obtain d. This time resolution of the code may be insufficient. Decreasing to , we obtain a better resolution, d, but calculations can be more time consuming.
In this section, we imply the heat blankets (Beznogov et al., 2016) made of iron and set g cm-3 for the star, to reduce , and g cm-3 for the star, that possesses thinner crust with shorter .
We set the heat power uniform inside the heater and zero outside. Following Chaikin et al. (2017), we vary as
| (3) |
where is the time from the beginning of the variation, is the variation duration and () is the maximum heat power reached at . Then at the total heat power varies as
| (4) |
where is the maximum integrated heat power (1). When exceeds , we return the heater to the stationary state, with and . The star also begins returning to its pre-outburst state.
It is also convenient to introduce the maxima of the surface luminosities, and , calculated with and without crustal superfluidity, respectively, and the ratios
| (5) |
Here, is the ratio of the heat powers in the outburst maximum and the steady state; is the ratio of the maximum surface luminosities for a given superfluid model (SF) and the non-superfluid crust (NoSF).
In this section, we set erg cm-3 s-1, yr, choose in the range from to , and choose in such a way to have one and the same for every heater’s position in a star with fixed . For we always set . At we have ( erg s-1) and ( erg s-1) for the 1.4 and 1.85 stars, respectively.
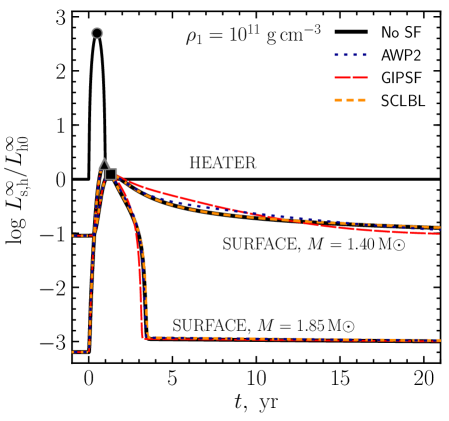
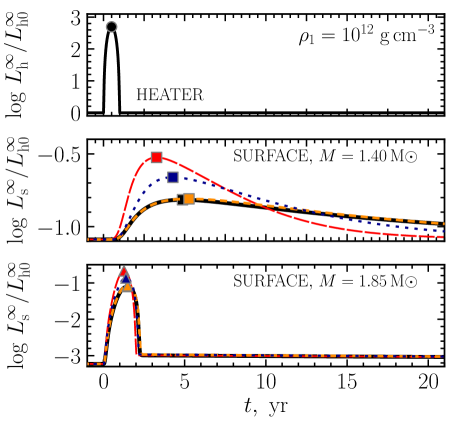
Our results are in line with those in Chaikin et al. (2017). Fig. 3 compares the outbursts of the heat power and the surface luminosity (both in units of with ) for the 1.4 and 1.85 stars. It displays and for a non-superfluid crust (Chaikin et al., 2017) and for the three models of crustal superfluidity (Fig. 1). The left panel is for the outer heater ( ); the right panel is for the deeper one ( g cm-3). The initial luminosity for the 1.85 star is about two orders of magnitude lower than for the 1.4 star, because the massive star undergoes much faster direct Urca neutrino cooling (Section 2).
The propagation of heat from the heater to the surface distorts the profile with respect to . The profile is broader; its peak is reached later. Our assumed profile is symmetric with respect to the peak maximum, but the peak is asymmetric. The surface outburst persists at , when the internal outburst is already over.
First we focus on the 1.4 star. A rapid rise of after the onset of the outburst is regulated by in the crust which is initially not very hot, so that the heat diffusion to the surface is sufficiently fast. As a result of this rise-stage, the heater and its vicinity become much hotter, which noticeably blocks the heat diffusion. That is why the decay of after the peak goes generally slower than the rise producing a strong surface outburst asymmetry.
If (the left panel of Fig. 3), the heater penetrates into the inner crust but only slightly. An example of the deeper heater fully placed in the inner crust is plotted on the right panel of Fig. 3 ( ). Since strong superfluidity reduces the heat capacity of the inner crust, it increases the temperature in the heater’s vicinity after the internal outburst. Therefore, the peaks of become relatively higher (it is easier to heat the crust), and the post-outburst decay of relatively shorter (lower ), but in any case the rise time is much shorter than the decay time. Actually, all superfluidity effects are quite pronounced for the deeper heater but almost invisible for the outer heater. A discussion of similar effects has been given by Brown and Cumming (2009); Page and Reddy (2013).
The case of the 1.85 star in Fig. 3 is basically similar but the parameters are different. The star is more compact than the 1.4 star and the crust is thinner which reduces all diffusion time scales in the crust. In addition, recall that there appears a powerful direct Urca neutrino cooling. All for the 1.85 star in Fig. 3 correspond to the same . The intense neutrino cooling from the core of the 1.85 star lowers the core temperature and creates much stronger temperature gradients between the heater and the core than for the 1.4 star. This greatly intensifies the heat outflow into the core. Regardless of superfluidity, the diffusion time-scale becomes sufficiently short. The time dependence is mainly regulated by heat diffusion through the outer crust.
In the left panel of Fig. 3, the peaks are more pronounced and less retarded from for stars of both masses than in the right panel, since the heater is geometrically closer to the surface. As the 1.85 star has a thinner crust, its peaks are higher. The difference between the luminosity peaks for the cases of superfluid and non-superfluid crusts is significant only in the right panel, where (e.g. Haensel et al. 2007). Accordingly, it is much easier to increase the temperature inside and around the heater. Then more energy is left to heat the surface.
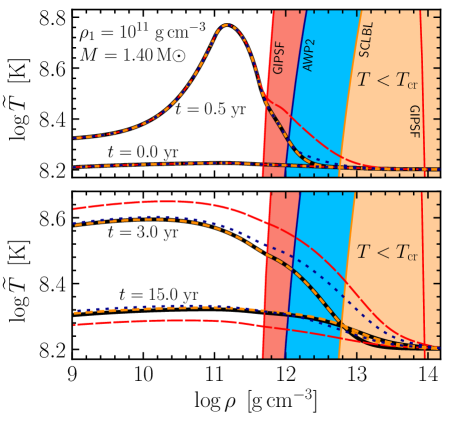
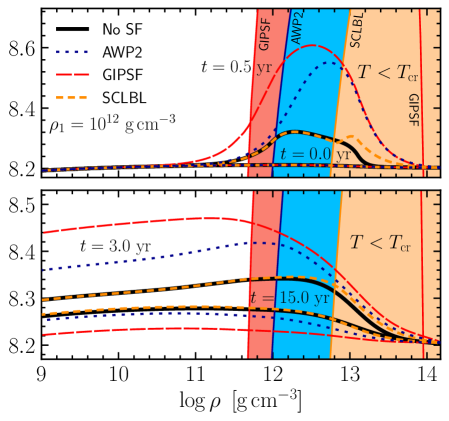
For a better understanding of Fig. 3, we plot additional Fig. 4 for the 1.4 . The figure shows the internal temperature profiles throughout the crust. Here, is the redshifted temperature of the matter. Note that const in isothermal regions of the star at a fixed (e.g., Yakovlev et al. 1999 and references therein). The profiles are presented at four successive moments of time (0, 0.5, 3, and 15 yr), counted from the beginning of the internal outburst. Now the initial steady-state heater () is not strong enough to destroy isothermality. Other profiles are bell-like, with maxima in the heater. Similarly to Fig. 3, there is almost no difference (noticeable only for the GIPSF model at yr) in the left panel between superfluid and non-superfluid cases, because the heater is placed mostly in the non-superfluid outer crust. Small changes in the behavior of do occur, because the heat fluxes within the inner crust are affected by superfluidity. This effect is seen only after the internal outburst, when the surface temperature starts to decline. For in the right panel, the difference in the temperature profiles of superfluid and non-superfluid stars is quite visible. If the neutrons are superfluid, the temperature rise is relatively fast and the peaks are higher. The highest peak and the most rapid temperature growth occur for the GIPSF model.
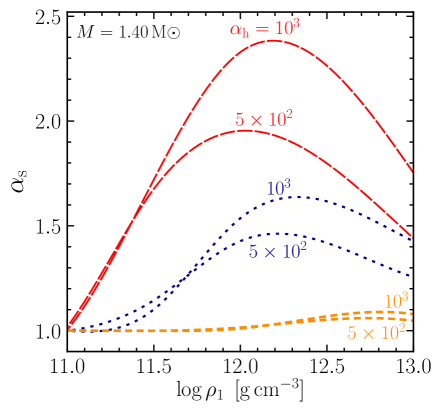
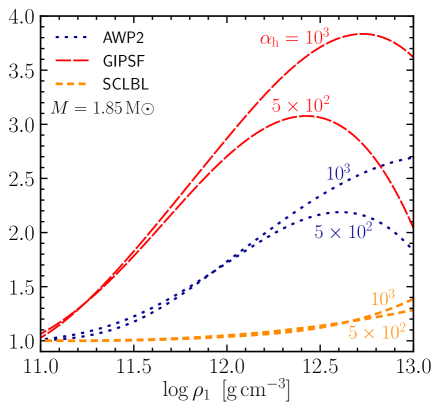
Fig. 5 illustrates the effects of different positions of the heater. It displays the ratios , equation (5), vs. for three models of superfluidity and two values of ; characterizes the enhancement of the peak by neutron superfluidity. The ratios are larger for higher because the contrast between the heat fluxes from the heater, for superfluid and non-superfluid cases, increases as we enhance the heat power. Another observation is that the maximum occurs at higher as we increase . If the heater is placed in the outer crust, the effect of suppressed heat capacity weakens, the difference of maximal luminosities vanishes and all . On the contrary, if the heater is placed in the inner crust, more heat disperses in the stellar interior and less heat reaches the surface, decreasing . The optimal case, with the maximum of , occurs for intensive heaters in the inner crust. Note that all optimal are shifted to higher for the 1.85 star because its crust is thinner.
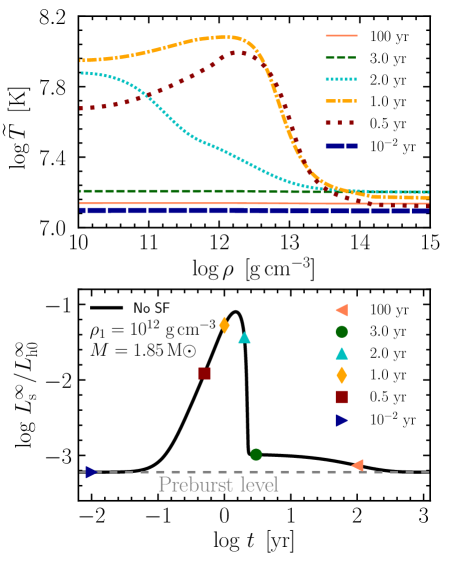
As seen from Fig. 3, the afterburst relaxation of the 1.85 star has finite duration and stops abruptly. In Section 6 we show that the same happens for the 1.4 star but its relaxation lasts longer and its final stage is not reproduced in Fig. 3. The figure shows that the initial luminosity of the 1.85 star at is lower than the luminosity after the relaxation stops. The internal thermal relaxation is achieved, but (or, equivalently, ) does not return to its initial value. The star becomes hotter than before the outburst. To explain this result, in Fig. 6 we display the dynamics of the outburst for the 1.85 fully non-superfluid star with the inner heater ( ) at . The upper panel presents the density dependence of the internal temperature at different moments of time, from to yr. The lower panel shows the observable lightcurve . To guide the eye, the gray dashed line shows without any outburst; it is the same as the preburst level. The time scale is logarithmic and distorts the lightcurve profile but allows us to extend this profile to yr.
One can see the initial, nearly isothermal interior just after the beginning of the outburst. It is violated by the outburst in the crust for about 2.5 yr, longer than the outburst duration yr, while the core stays isothermal and becomes warmer by the heat flowing from the crust. In about 2.5 yr (which is the time-scale of the long-term relaxation to be discussed extensively in Sections 6 and 5) the state of isothermal interior is restored again, although the entire star gets warmer. This star is thermally relaxed inside and cools slowly on much longer time scales of a few hundred years reaching the preburst stage. It is a new epoch of passive cooling at which the star ‘still remembers’ the outburst heating. This epoch mimics the stage of the second, longest-term relaxation. Our additional calculations indicate that the new stage is pronounced only in sufficiently cold and heavy stars with the open direct Urca process in the core and with a powerful internal outburst, capable to warm up the entire star.
5 Deep crustal heating
In this section, we present a schematic analysis of the crust-core relaxation in neutron stars which enter LMXBs. A neutron star in an LMXB transiently accretes matter from its low-mass companion. There are active periods of accretion with a lot of accretion energy released at the star surface. Then the LMXB is observed as a bright X-ray source. After the accretion stops, the surface energy release is off and a quiescent stage begins, with much weaker surface thermal luminosity. Nevertheless, this quiescent emission is observable implying that the neutron stars remain warm and radiate at a lower level until the next accretion episode.
It is widely thought that the quiescent thermal emission of LMXBs is mainly powered by the deep crustal heating mechanism. The mechanism operates in a star’s crust during accretion periods, when the freshly accreted matter compresses the underlying accreted material. The accreted matter is known to be not in full equilibrium; it has a higher energy than the fully equilibrated ground-state (cold-catalyzed) matter. The accretional compression triggers nuclear transformations which drive the matter to full equilibrium, with a modest total energy release of 1–2 MeV per one accreted nucleon when the matter is compressed to the densities . It is important, that this energy is mainly generated at high compressions, deeply in the crust. The energy generation was calculated by Haensel and Zdunik (1990b) and refined later by Haensel and Zdunik (2008); Gupta et al. (2007). The deep crustal heating mechanism was applied to LMXBs by Brown et al. (1998). In principle, the compression of the cold-catalyzed matter can also heat the star but the effect is negligible.
The deep crustal heating creates a heater during accretion outbursts, with the energy generation rate distributed over the accreted crust. In quiescence, the compression due to the fall of newly accreted matter stops and . Initially, when an LMXB started to show the accretion episodes, the star’s crust was likely composed of cold-catalyzed (ground-state) matter (e.g., Haensel et al. 2007). However, later, during many accretion episodes, it is gradually replaced by a non-equilibrium accreted matter (Haensel and Zdunik, 1990b, a), where the deep crustal heating can operate. This replacement starts from the surface layers and moves toward the crust-core interface (to ). Nevertheless, in the deepest crust, , the difference between the accreted and cold-catalyzed matter becomes so small that is almost negligible. After the bottom of the accreted crust reaches the layer of the density , the replacement can be treated as nearly complete. A typical mass of the crust of the 1.4 star at is about 0.05 per cent of the total star’s mass. For a typical time-averaged mass accretion rate yr-1 (e.g., Beznogov and Yakovlev 2015, and references therein) it takes about yr to replace the cold-catalyzed crust by the accreted one. Before that, the accreted crust can be thinner and the deep crustal heating weaker. In principle, one should consider the deep crustal heating with fully accreted or partly accreted (hybrid) crusts. The possibility of hybrid crusts has been studied by Wijnands et al. (2013) to explain the anomalous observational behavior of the IGR J17480–2446 source.
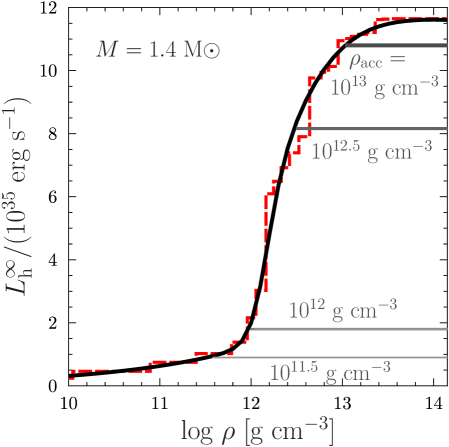
For illustration, Fig. 7 demonstrates the heat power , given by equation (1) and integrated from the surface to a layer with a given in the crust, for a fixed yr-1 during an accretion stage. Since is directly proportional to , one can easily rescale to any . We take the same 1.4 star’s model, as before. The dashed line corresponds to the deep crustal heating for the fully accreted crust, with , and the mass of the accreted crust . The heat distribution within the crust is taken from Haensel and Zdunik (2008). There are many thin shells (steps of the dashed line) where the heat is released; the actual function looks as a sequence of narrow peaks. For simplicity, we replace the stair-step-like heat power by a smooth curve with nearly the same integrated for the fully accreted crust; it is shown by the thick black curve.
However, if the accreted crust extends to lower , our basic smoothed black curve is modified – it becomes constant, , at . These modified parts of the curves are shown by the gray horizontal lines of different thickness for the four bottom densities, , , and g cm-3 of the accreted crust (with the four masses , , and ). If , the crust behaves as almost fully accreted. If were about 3 times lower ( ), the total heat generation would be 1.4 times lower than for the fully accreted crust. A further reduction to or to g cm-3 would reduce , respectively, by a factor of 6.5 or 12, as compared to the fully accreted crust. However, in order to form such a thin accreted crust one needs much less time than to form the fully accreted crust; the chances to observe a star with a thin accreted crust seem small.
All LMXBs whose active and quiescent emission is observed can be divided into two groups. The summary of observations has been recently reviewed by Wijnands et al. (2017).
Group 1 contains the sources where outbursts are relatively short (days–weeks) and/or not intense, with the mass accretion rates during the outbursts well below the Eddington limit. Then the deep crustal heating is not strong enough to destroy the isothermality of stellar interiors supported by a high thermal conductivity. These sources can be called quasi-stationary (e.g., Han and Steiner 2017). When the star transits from an active state to quiescence, the observed surface luminosity drops quickly to the quiescent level. In quiescence, the star undergoes passive cooling on timescales about yr until the next outburst occurs in months or years. The surface is thermally coupled to the stellar core. At this stage, a quasi-stationary LMXB serves as a natural laboratory to probe the physics of neutron star cores (e.g., Yakovlev et al. 2003).
Group 2 consists of the sources demonstrating sufficiently long (months–years) and intense (at about the Eddington level) outbursts. During an outburst, the crustal heater is strong and makes the crust hotter than the core, destroying the isothermality of stellar interiors; such LMXBs were dubbed quasi-persistent (e.g., Page and Reddy 2012; Merritt et al. 2016). There appear large temperature gradients in the crust near the boundaries of the heated layer. When the accretion stops and the star transits to a quiescent state, the transition takes more time (typically, a few years) than in quasi-stationary LMXBs, because it includes an additional crust-core relaxation of the overheated crust with the colder core (e.g., Shternin et al. 2007; Brown and Cumming 2009). At such transition stages, the stellar surface is thermally decoupled from the core but coupled to the heater, so that neutron stars serve as natural laboratories to study the physics of the crust. These transitions have much in common with the initial crust-core relaxation of newly born isolated neutron stars (e.g., Lattimer et al. 1994; Gnedin et al. 2001). After the end of such a long-term crust-core relaxation in a transiently accreting star, the star reaches a quiescent state with isothermal interior and then resembles quiescent neutron stars in quasi-stationary LMXBs; the physics of the crust becomes almost unimportant.
Note that our description of accretion and quiescent states is idealized. In accretion stages, one observes the variability of produced by fluctuations of the accretion rate and by thermonuclear outbursts in the subsurface layers. During quiescent stages, can also vary because of sporadic low-level accretion and thermonuclear outbursts (e.g. Homan et al. 2014 and references therein).
Here we focus on the long-term relaxation from accretion to quiescence in the quasi-persistent LMXBs. They have been observed from several LMXBs (e.g., Homan et al. 2014; Wijnands et al. 2017). There have been many attempts to model long-term cooling in the quasi-persistent sources (see, e.g., Shternin et al. 2007; Brown and Cumming 2009; Page and Reddy 2012, 2013; Turlione et al. 2015; Medin and Cumming 2014; Homan et al. 2014). The main conclusion is that the deep crustal heating reasonably well describes the late stages of the long-term relaxation – a few months–years after an outburst.
However, the deep crustal heating is usually insufficient to explain the early transition stage – a few first hundred days in quiescence. To reproduce such a stage, one assumes an additional heat source in the outer layer of the crust (as was first suggested by Brown and Cumming 2009). The nature of this special thermal evolution of the outer layers is not clear. It is often addressed as shallow heating and treated phenomenologically.
6 Long-term relaxation in quasi-persistent LMXBs
Let us describe our simulations of long-term cooling of neutron stars in quasi-persistent LMXBs. We use the same cooling code as described above for the same 1.4 star model. The heater’s power is now distributed over a thick crustal layer (Fig. 7). Our calculations may be inaccurate at the beginning of the quiescent stage because we neglect the shallow heating. However, they are expected to be adequate to reproduce the later long-term relaxation in quiescence. The surface temperature at this stage is mostly regulated by the heating in the deep crust, being rather insensitive to the shallow heating (e.g. Brown and Cumming 2009).
| Model of | |||
|---|---|---|---|
| outburst | K | yr-1 | yr |
| Weak (WO) | 0.2 | ||
| Strong (SO) | 1.0 |
is the mass accretion rate during an outburst
Note that one should not confuse the models of accreted heat blanketing envelopes ( ) and accreted crust (). A heat blanket is thin and situated just under the stellar surface. Its composition is mostly regulated by thermonuclear burning of freshly accreted material during outbursts (e.g., Brown et al. 2002; Strohmayer and Bildsten 2006). An accreted crust is thicker and extends much deeper than the heat blanket. Its composition is determined by temperature-independent nuclear transformations in the deep layers (e.g., Haensel and Zdunik 1990b, 2008). In quiescence, the heat blanket may contain iron but the crust beneath it can have accreted composition (Haensel and Zdunik, 1990b).
The simulations have been performed in a slightly different manner than in Section 4. First, an initially hot star is cooled freely, with . After the internal thermal relaxation is over and the temperature reaches some predetermined value , we switch on the heater in the accreted crust (Fig. 7) assuming a certain mass accretion rate during an outburst stage. The surface luminosity calculated by the code during this outburst is smaller than the actual luminosity because the calculated does not include a huge surface energy release due to accretion. Nevertheless, the internal temperature in the deep crust and in the core as well as the long-term relaxation can be calculated in this way.
Let us stress that the problem in Section 4 was more “academic.” We studied an inner heater of unknown nature as the only heat source. Here we use the well elaborated deep crustal heating mechanism. It should be accompanied by the accretion heating from the surface, and most probably by the shallow heating but we do not include these two additional mechanisms.
At a certain moment of time after the outburst onset, we abruptly switch off the deep crustal heating to simulate the relaxation. We have in quiescence and a constant during the outburst. Any lightcurve is then specified by , by the heat power and . Of course, our lightcurves depend also on assumed models of the star, heat blanket and crustal superfluidity.
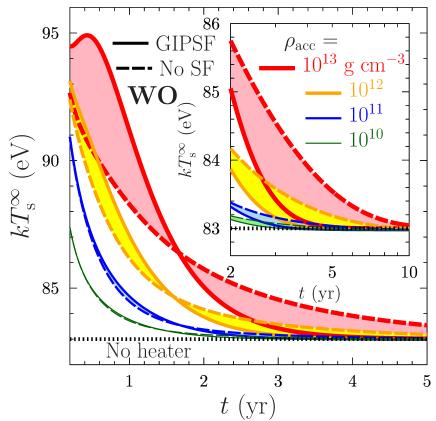
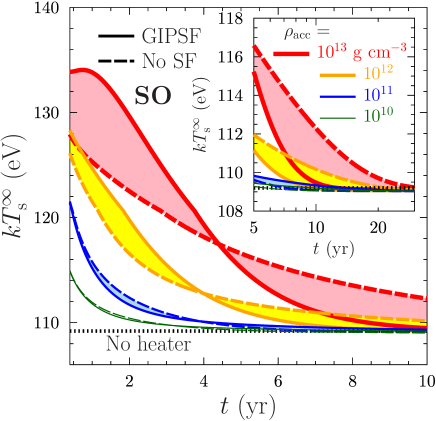
For illustration, we took, rather arbitrarily, two models of the outburst, the weak outburst (WO) and the strong outburst (SO). The parameters of these outbursts are listed in Table 1. The SO lasts 5 times longer and has higher (close to the Eddington limit) than the WO. The total deep crustal energy input during the SO is 8.8 times larger. For each outburst model we consider the cases of the non-superfluid and highly superfluid (GIPSF) crust. The cases of weaker superfluidities are intermediate between these two. We calculate the lightcurves for four densities at the bottom of the accreted crust, and . If or , the heater is fully placed in the outer crust. Otherwise, it extends to the inner crust that can be superfluid. Here we use the model of fully accreted heat blanketing envelope of Potekhin et al. (1997).
The calculated lightcurves (with being time since the end of accretion) are plotted in Fig. 8; is expressed in energy units, , being the Boltzmann constant. The left and right panels refer to the WO and SO, respectively. The insets visualize the final stages of the long-term relaxation. The solid and dashed curves correspond to the GIPSF and non-superfluid scenarios, respectively.
With increasing time after an outburst, the star relaxes to the quasi-stationary state that would take place without heating (with isothermal interior at a certain temperature ). Since we do not consider a massive star, we should obtain the solution with (Section 4). We assume here that the characteristic time-scale of passive cooling ( kyr) is much longer than the time interval between two successive outbursts. For the assumed heat blanketing model after the outburst we have = 83 eV ( MK, Table 1) for the WO, and = 109 eV ( MK) for the SO.
According to Fig. 8, a thinner accreted crust reduces . In any case, the relaxation does not last longer than a few decades. In the absence of the heater (the dotted horizontal line) the passive cooling would be unnoticeable on the relaxation timescales.
For a star with a massive superfluid accreted crust, the crust is especially hot and the curves become non-monotonic reaching a peak at yr. This non-monotonic behavior mainly contradicts observations. It appears because we neglect the shallow heating in our modeling.
However, it is expected (e.g., Brown and Cumming 2009) that the shallow heating manifests itself just after the outburst (when the heat emitted from the surface emerges from the shallow depths) and does not affect the long-term relaxation of our interest (when the emitted heat emerges from the deeper crust). The exclusion concerns the cases of , in which the layers of deep crustal heating and the shallow heating essentially overlap. We include these cases only for completeness of the consideration.
For the conditions in Fig. 8 in the massive superfluid accreted crusts, the long-term relaxation after the WO starts at yr. For a less massive and/or non-superfluid crust it starts earlier. For larger and/or (larger total outburst energy) it starts later. For instance, for the SO it starts at yr.
As seen from Fig. 8, there are two long-term relaxation regimes. As long as the accreted crust does not extend beyond the neutron drip density (; that is for and in our case), the lightcurves are affected by superfluidity rather weakly. This is natural because in such cases the generated heat flows to the surface through the non-superfluid outer crust. In the opposite case (, that is for and ) the heat is mainly generated in the superfluid region, the lightcurves are strongly affected by superfluidity which greatly accelerates the relaxation.
Let us stress that the existence of superfluidity in neutron star crusts in quasi-persistent LMXBs has been studied previously, mostly, for fully accreted crusts (e.g., Shternin et al. 2007; Brown and Cumming 2009). Our results agree with those studies.
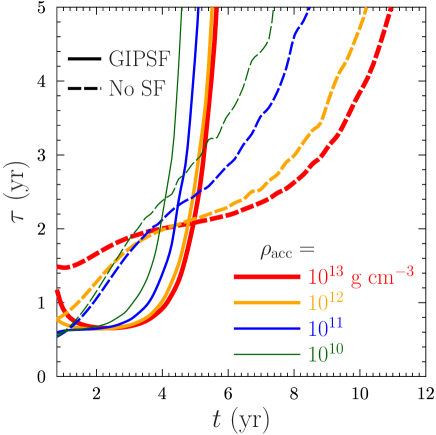
Using the theoretical lightcurves on Fig. 8, we can analyse temporal behavior of during the long-term relaxation in quiescence. It is instructive to write
| (6) |
where is a variable component of , whose behavior is most important. One often describes this behavior (e.g., Homan et al. 2014) as exponential, , or as power-law, , with constant relaxation time or (broken) power-law index .
To check the exponential behavior with our theoretical lightcurves, we have calculated the real local time-dependent as
| (7) |
for the WO lightcurves on the left panel of Fig. 8.
The results are presented in Fig. 9. Evidently, the approximation of constant is inaccurate.
Moreover, the curves do depend on crustal superfluidity. This is natural for but less evident for because in the latter case the long-term lightcurves are weakly affected by superfluidity (Fig. 8). Nevertheless, this is true even in the latter case. This means that curves (determined by the time derivative ) are basically much more sensitive to crustal superfluidity than the lightcurves themselves. This is likely because of complicated character of heat diffusion which “feels” the presence of superfluidity even if the superfluid layer is placed deeper than the heat source. Therefore, contains important information on the physics of the crust, although extracting this information from observations would be a problem.
Note also wave-like features of the curves in Fig. 9. They are especially pronounced for nonsuperfluid crust with . They are possibly associated with low-amplitude thermal waves which travel within the crust in the vicinity of the heater, being supported by weak reflections from the neutron drip zone and from the artificial bottom of the heat blanket (). This is another indication that the curves carry potentially important information on the crust structure.
The properties of curves in Fig. 9 are as follows. There are wide minima of at yr for superfluid crust with any . As long as yr, all curves increase with time. Very roughly, any curve can be specified by a typical relaxation time and a typical relaxation duration . The relaxation time corresponds to the minimum of in Fig. 9. Typical time of the later rapid increase marks the approach of to . It confirms that the relaxation duration is finite. It is seen also in previous computer simulations of the lightcurves ; e.g. Shternin et al. (2007); Brown and Cumming (2009); Page and Reddy (2013); Homan et al. (2014); Merritt et al. (2016). We have already discussed finite in Section 4 for the 1.85 star where the effect is quite pronounced. Evidently, similar effect occurs also in the 1.4 star, although it is less pronounced.
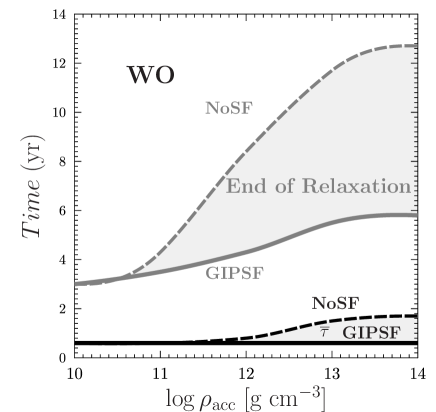
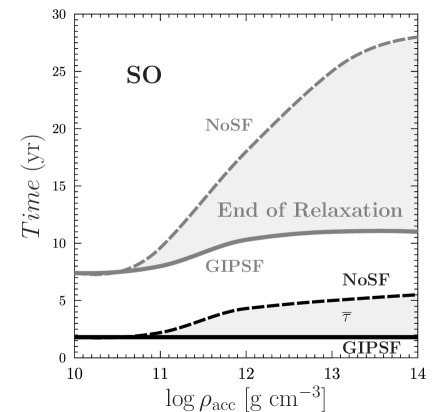
A schematic dependence of and on is shown in Fig. 10 for the same conditions as in Fig. 8. The left and right panels refer, respectively, to the WO and SO models. The black lines show while the grey lines exhibit . The solid curves are for the GIPSF superfluidity, while the dashed curves are for the non-superfluid crust. The shaded regions, again, can be filled by respective curves for intermediate superfluidities.
We estimated as the minimum (fastest decay rate) at the long-term relaxation stage (at yr for the WO and yr for the SO). We have also calculated in another way, by taking theoretical lightcurves and fitting them by the function within a reasonable time interval (). We have varied and within some limits. The choice of these limits does affect the inferred values of but the dependences stay qualitatively the same as in Fig. 10.
The relaxation durations in Fig. 10 are estimated by eye as times at which approaches .
The relaxation time for the WO in the superfluid crust (the solid black curve in the left panel of Fig. 10) with all are about the same, yr. The presence of superfluidity speeds up the heat diffusion through the inner (superfluid) crust, so that the relaxation time is mostly determined by the heat diffusion in the outer (non-superfluid) crust. Accordingly, the diffusion time from the heater to the surface depends on but only slightly. Decreasing from to lowers from to yr, because the heater becomes effectively closer to the surface. The relaxation time for the superfluid crust and the SO in Fig. 10 behaves similarly to the WO curve but is somewhat longer.
For the non-superfluid crust, the situation is different. At , the relaxation time for the WO and SO stays about the same as in the superfluid case. In contrast, for , both times – and – become a few times longer than in the superfluid crust because the absence of superfluidity delays propagation of heat to the surface.
The finite duration of the long-term relaxation can be seen in other numerical simulations of lightcurves in quiescent stages of quasi-persistent LMXBs (e.g., Brown and Cumming 2009). Superfluidity can shorten by a factor of 2–3.
We have not attempted to tune the WO and SO parameters to explain specific quasi-persistent LMXBs. Nevertherless according to the data (e.g., Homan et al. 2014, particularly, their Fig. 5; Wijnands et al. 2017), the WO model can be successful to explain the IGR J17480–2446 source while the SO model seems relevant for explaining XTE J1701–462. For example, our very preliminary analysis indicates that if we apply the WO model for the interpretation of the observations of the IGR J17480–2446 after the 2010 October outburst, it is profitable to assume that the crust is hybrid (partly accreted), with , and the inner crust is highly superfluid. The possibility that the crust of the neutron star in this object is hybrid has been discussed in the literature (Patruno et al., 2012; Wijnands et al., 2013). More work is required to apply our results for a detailed interpretation of various sources.
7 Conclusions
We have modeled thermal evolution of neutron stars with internal spherically symmetric heaters located in the crust. We have assumed a variable heat power and calculated the variations of thermal surface luminosity or, equivalently, of the surface temperature of the star to see if these variations are observable.
Previously, we studied stationary heaters (Kaminker et al., 2006, 2007, 2009, 2014) where and were almost independent of time. Now we focus on variable heaters which produce internal heat outbursts and corresponding surface outbursts . Recently, we have investigated the problem (Chaikin et al., 2017) neglecting superfluidity of neutrons in the inner crust. In this paper, we include the effects of crustal superfluidity; preliminary results have been outlined in Kaminker et al. (2017).
For illustration, we have taken two neutron star models, with 1.4 and 1.85 and with the BSk21 EOS of nucleon matter in the star’s core (Section 2). We have considered three models for singlet-state neutron superfluidity in the crust (Section 3), and varied the heater’s parameters.
In Section 4 we analyze relatively thin heaters. The results resemble those without superfluidity (Chaikin et al., 2017), but there are important differences. The common features are like this. Only a small amount of heat is emitted by photons through the surface. The surface outburst is delayed and broadened with respect to the internal outburst , as a result of a finite heat diffusion time from the heater to the surface. Also, we have confirmed the previous results by other authors (e.g., Shternin et al. 2007; Brown and Cumming 2009; Homan et al. 2014; Ootes et al. 2018) that the crustal superfluidity can greatly affect the surface emission by reducing the heat capacity of free neutrons and shortening in the inner superfluid crust (provided the heater is there); this makes the internal heater’s activity more visible at the surface.
In Sections 5 and 6, we study outbursts produced by the deep crustal heating (Haensel and Zdunik, 2003; Brown et al., 1998) in neutron stars which enter quasi-persistent LMXBs. Such an outburst is generated in a wide crustal layer. It operates during accretion stages and affects subsequent stages of long-term relaxation of neutron stars in quiescence. We mainly focus on the late stages of long-term relaxation. They can be characterized by an effective relaxation time and a longer but finite duration time of the entire relaxation stage.
The long-term relaxation depends on crustal superfluidity and on the maximum density to which the accreted matter sinks in the crust. As long as the accreted matter is placed in the outer crust, the effect of superfluidity on and is weak. If, however, the accreted matter penetrates into the inner crust, superfluidity becomes very important. It reduces and in such a way as if the accreted matter occupies the outer crust alone. Were the inner crust accreted but non-superfluid, and would be a few times larger.
However, our analysis is too far from being completed. It would be desirable to calculate a grid of models, particularly for different , , and different models for crustal superfluidity. While doing so, it would be good to use different models for neutrino emission rates, heat capacities and thermal conductivities in the accreted and non-accreted matter (whereas, for simplicity, we have taken microphysics of the ground-state matter throughout the entire crust, except for the heat energy release, Fig. 7).
These results could be combined with the cooling theories which account for the effects of superfluidity in neutron star cores, for instance, using the technique of Ofengeim et al. (2015); Ofengeim and Yakovlev (2017). In addition, in would be worthwhile to include proper models for heat blanketing envelopes which strongly affect (e.g., Beznogov et al. 2016).
The obtained results can also be used to interpret the observations of afterburst relaxation in magnetars (e.g., Mereghetti 2013; Li et al. 2016; Beloborodov and Li 2016; Kaspi and Beloborodov 2017; Coti Zelati et al. 2018) which may contain variable heaters distributed in their crusts. The afterburst relaxation can have much in common with that in LMXBs (e.g. An et al. 2012). Since the magnetars possess strong magnetic fields of unknown geometry and their heating mechanism is still not clear, it would be a huge job to include the magnetic effects properly in calculations. For simplicity, these effects (discussed, e.g., in Potekhin et al. 2003, 2015) have been neglected in the present study.
In any case, all these unsolved problems are beyond the scope of this paper.
References
- Ainsworth et al. (1989) Ainsworth, T.L., Wambach, J., Pines, D.: Phys. Lett. B 222, 173 (1989)
- An et al. (2012) An, H., Kaspi, V.M., Tomsick, J.A., Cumming, A., Bodaghee, A., Gotthelf, E.V., Rahoui, F.: Astrophys. J. 757, 68 (2012)
- Beloborodov and Li (2016) Beloborodov, A.M., Li, X.: Astrophys. J. 833, 261 (2016)
- Beznogov and Yakovlev (2015) Beznogov, M.V., Yakovlev, D.G.: MNRAS 447, 1598 (2015)
- Beznogov et al. (2016) Beznogov, M.V., Potekhin, A.Y., Yakovlev, D.G.: MNRAS 459, 1569 (2016)
- Brown et al. (2002) Brown, E., Bildsten, L., Chang, P.: In: APS Meeting Abstracts, S11.008, April 2002
- Brown and Cumming (2009) Brown, E.F., Cumming, A.: Astrophys. J. 698, 1020 (2009)
- Brown et al. (1998) Brown, E.F., Bildsten, L., Rutledge, R.E.: Astrophys. J. 504, 95 (1998)
- Chaikin et al. (2017) Chaikin, E.A., Kaminker, A.D., Kaurov, A.A., Yakovlev, D.G.: Europhysics Letters 108, 31002 (2017)
- Coti Zelati et al. (2018) Coti Zelati, F., Rea, N., Pons, J.A., Campana, S., Esposito, P.: MNRAS 474, 961 (2018)
- Gandolfi et al. (2009) Gandolfi, S., Illarionov, A.Y., Pederiva, F., Schmidt, K.E., Fantoni, S.: Phys. Rev. C 80, 045802 (2009)
- Gnedin et al. (2001) Gnedin, O.Y., Yakovlev, D.G., Potekhin, A.Y.: MNRAS 324, 725 (2001)
- Gudmundsson et al. (1983) Gudmundsson, E.H., Pethick, C.J., Epstein, R.I.: Astrophys. J. 272, 286 (1983)
- Gupta et al. (2007) Gupta, S., Brown, E.F., Schatz, H., Möller, P., Kratz, K.-L.: Astrophys. J. 662 (2007)
- Haensel and Zdunik (1990a) Haensel, P., Zdunik, J.L.: Astron. Astrophys. 229, 117 (1990a)
- Haensel and Zdunik (1990b) Haensel, P., Zdunik, J.L.: Astron. Astrophys. 227, 431 (1990b)
- Haensel and Zdunik (2003) Haensel, P., Zdunik, J.L.: Astron. Astrophys. 404, 33 (2003)
- Haensel and Zdunik (2008) Haensel, P., Zdunik, J.L.: Astron. Astrophys. 480, 459 (2008)
- Haensel et al. (2007) Haensel, P., Potekhin, A.Y., Yakovlev, D.G.: Neutron Stars. 1. Equation of State and Structure. Springer, New York, (2007)
- Han and Steiner (2017) Han, S., Steiner, A.W.: Phys. Rev. C 96, 035802 (2017)
- Henyey and L’Ecuyer (1969) Henyey, L., L’Ecuyer, J.: Astrophys. J. 156, 549 (1969)
- Homan et al. (2014) Homan, J., Fridriksson, J.K., Wijnands, R., Cackett, E.M., Degenaar, N., Linares, M., Lin, D., Remillard, R.A.: Astrophys. J. 795 (2014)
- Kaminker et al. (2006) Kaminker, A.D., Yakovlev, D.G., Potekhin, A.Y., Shibazaki, N., Shternin, P.S., Gnedin, O.Y.: MNRAS 371, 477 (2006)
- Kaminker et al. (2007) Kaminker, A.D., Yakovlev, D.G., Potekhin, A.Y., Shibazaki, N., Shternin, P.S., Gnedin, O.Y.: Astrophys. Space Sci. 308, 423 (2007)
- Kaminker et al. (2009) Kaminker, A.D., Potekhin, A.Y., Yakovlev, D.G., Chabrier, G.: MNRAS 395, 2257 (2009)
- Kaminker et al. (2014) Kaminker, A.D., Kaurov, A.A., Potekhin, A.Y., Yakovlev, D.G.: MNRAS 442, 3484 (2014)
- Kaminker et al. (2017) Kaminker, A.D., Chaikin, E.A., Kaurov, A.A., Yakovlev, D.G.: J. Phys. Conf. Ser. 932, 012047 (2017)
- Kaspi and Beloborodov (2017) Kaspi, V.M., Beloborodov, A.M.: Ann. Rev. Astron. Astrophys. 55, 261 (2017)
- Lattimer et al. (1991) Lattimer, J.M., Pethick, C.J., Prakash, M., Haensel, P.: Phys. Rev. Lett. 66, 2701 (1991)
- Lattimer et al. (1994) Lattimer, J.M., van Riper, K.A., Prakash, M., Prakash, M.: Astrophys. J. 425, 802 (1994)
- Li et al. (2016) Li, X., Levin, Y., Beloborodov, A.M.: Astrophys. J. 833, 189 (2016)
- Medin and Cumming (2014) Medin, Z., Cumming, A.: Astrophys. J. Lett. 783, L3 (2014)
- Mereghetti (2013) Mereghetti, S.: Brazil. J. Phys. 43, 356 (2013)
- Merritt et al. (2016) Merritt, R.L., Cackett, E.M., Brown, E.F., Page, D., Cumming, A., Degenaar, N., Deibel, A., Homan, J., Miller, J.M., Wijnands, R.: Astrophys. J. 833, 186 (2016)
- Ofengeim and Yakovlev (2017) Ofengeim, D.D., Yakovlev, D.G.: MNRAS 467, 3598 (2017)
- Ofengeim et al. (2015) Ofengeim, D.D., Kaminker, A.D., Klochkov, D., Suleimanov, V., Yakovlev, D.G.: MNRAS 454, 2668 (2015)
- Ootes et al. (2018) Ootes, L.S., Wijnands, R., Page, D., Degenaar, N.: MNRAS 477, 2900 (2018)
- Page and Reddy (2012) Page, D., Reddy, S.: In: Bertulani, C.A., Piekarewicz, J. (eds.) Neutron Star Crust, p. 282. Hauppauge, NY: Nova Science Publishers (2012)
- Page and Reddy (2013) Page, D., Reddy, S.: Phys. Rev. Lett. 111, 241102 (2013)
- Page et al. (2006) Page, D., Geppert, U., Weber, F.: Nuclear Physics A 777, 497 (2006)
- Page et al. (2014) Page, D., Lattimer, J.M., Prakash, M., Steiner, A.W.: In: Bennemann, K.H., Ketterson, J.B. (eds.) Novel Superfluids, p. 550. Oxford Univ. Press, Oxford (2014)
- Patruno et al. (2012) Patruno, A., Alpar, M.A., van der Klis, M., van den Heuvel, E.P.J.: Astrophys. J. 752, 33 (2012)
- Pons and Perna (2011) Pons, J.A., Perna, R.: Astrophys. J. 741, 123 (2011)
- Pons and Rea (2012) Pons, J.A., Rea, N.: Astrophys. J. 750, 6 (2012)
- Pons et al. (2009) Pons, J.A., Miralles, J.A., Geppert, U.: Astron. Astrophys. 496, 207 (2009)
- Potekhin et al. (1997) Potekhin, A.Y., Chabrier, G., Yakovlev, D.G.: Astron. Astrophys. 323, 415 (1997)
- Potekhin et al. (2015) Potekhin, A.Y., Pons, J.A., Page, D.: Space Sci. Rev. 191, 239 (2015)
- Potekhin et al. (2003) Potekhin, A.Y., Yakovlev, D.G., Chabrier, G., Gnedin, O.Y.: Astrophys. J. 594, 404 (2003)
- Potekhin et al. (2013) Potekhin, A.Y., Fantina, A.F., Chamel, N., Pearson, J.M., Goriely, S.: Astron. Astrophys. 560, 48 (2013)
- Schulze et al. (1996) Schulze, H.-J., Cugnon, J., Lejeune, A., Baldo, M., Lombardo, U.: Phys. Lett. B 375, 1 (1996)
- Shternin et al. (2007) Shternin, P.S., Yakovlev, D.G., Haensel, P., Potekhin, A.Y.: MNRAS 382, 43 (2007)
- Strohmayer and Bildsten (2006) Strohmayer, T., Bildsten, L.: In: Lewin, W.H.G., van der Klis, M. (eds.) Compact stellar X-ray sources, p. 113. Cambridge, Cambridge University Press (2006)
- Turlione et al. (2015) Turlione, A., Aguilera, D.N., Pons, J.A.: Astron. Astrophys. 577, 5 (2015)
- Viganò et al. (2013) Viganò, D., Rea, N., Pons, J.A., Perna, R., Aguilera, D.N., Miralles, J.A.: MNRAS 434, 123 (2013)
- Wijnands et al. (2013) Wijnands, R., Degenaar, N., Page, D.: MNRAS 432, 2366 (2013)
- Wijnands et al. (2017) Wijnands, R., Degenaar, N., Page, D.: J. Astrophys. Astron. 38, 49 (2017)
- Yakovlev and Pethick (2004) Yakovlev, D.G., Pethick, C.J.: Annu. Rev. Astron. Astrophys. 42, 169 (2004)
- Yakovlev et al. (2003) Yakovlev, D.G., Levenfish, K.P., Haensel, P.: Astron. Astrophys. 407, 265 (2003)
- Yakovlev et al. (1999) Yakovlev, D.G., Levenfish, K.P., Shibanov, Y.A.: Physics Uspekhi 42, 737 (1999)
- Yakovlev et al. (2001) Yakovlev, D.G., Kaminker, A.D., Gnedin, O.Y., Haensel, P.: Phys. Rep. 354, 1 (2001)