Filamentary structures and star formation activities in the sites S234, V582, and IRAS 05231+3512
Abstract
To investigate the physical processes, we present observational results of the sites S234, V582, and IRAS 05231+3512 situated toward l = 171.7–174.1. Based on the CO line data, we find that these sites are not physically connected, and contain at least one filament (with length 7 pc). The observed line masses () of the filaments associated with V582 and IRAS 05231+3512 are 37 and 28 M⊙ pc-1, respectively. These filaments are characterized as thermally supercritical, and harbor several clumps. Groups of infrared-excess sources and massive B-type stars are observed toward the filament containing V582, while a very little star formation (SF) activity is found around IRAS 05231+3512. Our results favour radial collapse scenario in the filaments harboring V582 and IRAS 05231+3512. In the site S234, two filaments (i.e. ns1 ( 130 M⊙ pc-1) and ns2 ( 45 M⊙ pc-1)) are identified as thermally supercritical. An extended temperature structure at 27-30 K surrounds a relatively cold (19 K) 8.9 pc long filament ns1. At least four condensations (Mclump 70–300 M⊙) are seen in ns1, and are devoid of the GMRT 610 MHz radio emission. The filament ns2 hosting clumps is devoid of ongoing SF, and could be at an early stage of fragmentation. An intense SF activity, having the SF efficiency 3.3% and SF rate 40–20 M⊙ Myr-1 (for tsf 1–2 Myr), is observed in ns1. The feedback of massive stars in S234 seems to explain the observed SF in the filament ns1.
Subject headings:
dust, extinction – HII regions – ISM: clouds – ISM: individual objects (S234) – stars: formation – stars: pre-main sequence1. Introduction
In recent years, the infrared and sub-millimeter (mm) data have revealed a wealth of bubbles and filamentary structures in star-forming regions (e.g. Churchwell et al., 2006; Myers, 2009; André et al., 2010), which are often associated with star-forming clumps, clusters of young stellar objects (YSOs), and massive OB stars ( 8 M⊙). Understanding the role of filaments in the formation of dense star-forming clumps and the feedback of OB stars in their vicinity are still open research topics in the area of star formation (e.g. Zinnecker & Yorke, 2007; Myers, 2009; André et al., 2010; Deharveng et al., 2010; Schneider et al., 2012; Tan et al., 2014; Baug et al., 2015; Dewangan et al., 2015, 2016a, 2016b, 2017a, 2017b, 2017c, 2017d, 2017e). Furthermore, the processes concerning the filament fragmentation are not well understood.
In this paper, we have chosen promising star-forming sites located toward l = 171.7 – 174.1; b = 0.6 – 0.52 (see Figure 1a), which include some of the major sites such as Sh 2-234 (hereafter S234), V582 Aur (hereafter V582), and Sh 2-237 (hereafter S237). The sub-mm map at 250 m shows extended structures in these sites (see Figure 1a). The sites S234, V582, and S237 are situated at distances of 2.8 kpc (Marco & Negueruela, 2016; Kun et al., 2017), 1.3 kpc (Kun et al., 2017; Ábrahám et al., 2018), and 2.3 kpc (Pandey et al., 2013; Dewangan et al., 2017a), respectively. The CO radial velocities of the sites S234, V582, and S237 were reported to be 13.4 km s-1 (e.g. Blitz et al., 1982), 10.5 km s-1 (e.g. Ábrahám et al., 2018), and 4.5 km s-1 (e.g. Dewangan et al., 2017a).
V582 is characterized as an FU Ori-type young eruptive star (see Kun et al., 2017; Ábrahám et al., 2018, and references therein), and the progenitor of V582 outburst is proposed to be a low-mass T Tauri star (Ábrahám et al., 2018). Kun et al. (2017) studied optical, near-infrared (NIR), and mid-infrared (MIR) data for a wide-field environment of V582, and suggested that V582 might be associated with a dark cloud LDN 1516. They further suggested that star formation in the vicinity of V582 could be triggered by the radiation field of a few hot members of Aur OB1 association.
The site S237 has an almost sphere-like shell morphology, and is powered by a radio spectral type of B0.5V star (Dewangan et al., 2017a). In the site S237, Dewangan et al. (2017a) investigated a cluster of YSOs and a massive clump at the intersection of filamentary features, and explained the star formation through the collisions of the filamentary features (see Figure 14 in Dewangan et al., 2017a).
The site S234 (IC 417) harbors a nebulous stream (or filamentary structure) and a young cluster “Stock 8” (Jose et al., 2008; Marco & Negueruela, 2016). Previous works also reported the presence of a dust shell lying between the nebulous stream and Stock 8 (see Figures 1 and 9 in Marco & Negueruela, 2016), which was also found to be associated with the ionized emission (e.g. Jose et al., 2008). Marco & Negueruela (2016) pointed out that the nebulous stream is not directly linked with Stock 8. They identified about 15 early-type massive stars (B2V) around Stock 8 based on the photometric and spectroscopic observations. These authors also suggested that the site S234 is powered by a star LS V +3423 (HD 35633), with a spectral type of O8 II(f). Jose et al. (2008) and Marco & Negueruela (2016) reported a stream of embedded sources and an obscured cluster (i.e. CC 14) toward the nebulous stream, and suggested the ongoing star formation activity in the site S234. It was pointed out that the YSOs associated with the nebulous stream (timescale 1 Myr; Jose et al., 2008) are younger than Stock 8 (timescale 4–6 Myr; Marco & Negueruela, 2016). It has also been discussed that the star formation activities in the nebulous stream and Stock 8 may be independent (e.g. Jose et al., 2008). Hence, these earlier studies together indicate that the site S234 contains several OB stars, nebulous stream/filamentary feature, dust shell, and clusters of YSOs. However, the molecular velocity structures in these different features have not been investigated yet.
Taken together, the interesting extended features reported toward l = 171.7 – 174.1; b = 0.6 – 0.52 are very suitable for investigating the role of filaments in star formation and the feedback of OB stars, which are yet to be carried out. To our knowledge, there is still lacking a detailed study of the molecular gas, embedded clumps, and ionized gas toward the sites in the direction of l = 171.7 – 174.1. Therefore, new and unexplored sub-mm images, radio continuum maps, and molecular line data are analyzed in this paper to understand the ongoing physical processes in the star-forming sites.
2. Data and analysis
2.1. New Observations
2.1.1 Radio Continuum Observations
We obtained new radio continuum observations at 610 MHz of the site S234. The data were observed with the Giant Metre-wave Radio Telescope (GMRT) facility on 2016 December 08 (Proposal Code: 31_025; PI: L. K. Dewangan). The radio data reduction was carried out using the AIPS software, in a similar manner as given in Mallick et al. (2012, 2013). A synthesized beam size and an rms noise of the final 610 MHz continuum map are 56 46 and 120 Jy/beam, respectively.
It is expected, specifically at low frequencies, that a sufficient amount of background emission will increase the antenna temperature, while observing the source. Hence, we corrected the final GMRT map at 610 MHz for system temperature (see Omar et al., 2002; Mallick et al., 2012, 2013; Baug et al., 2015). More details about the adopted procedure of system temperature corrections can be found in Mallick et al. (2012, 2013).
2.2. Archival data sets
The multi-wavelength data sets are also retrieved from different surveys (e.g. the NRAO VLA Sky Survey (NVSS; = 21 cm; resolution = 45; Condon et al., 1998), the Five College Radio Astronomy Observatory (FCRAO) 12CO (1-0) and 13CO (1-0) line data ( = 2.6, 2.7 mm; resolution 45; Heyer et al., 1998; Brunt, 2004), the Herschel Infrared Galactic Plane Survey (Hi-GAL; = 70, 160, 250, 350, 500 m; resolutions = 5′′.8, 12′′, 18′′, 25′′, 37′′; Molinari et al., 2010), the Wide Field Infrared Survey Explorer (WISE; = 3.4, 4.6, 12, 22 m; resolutions = 6′′.1, 6′′.4, 6′′.5, 12′′; Wright et al., 2010), the Warm-Spitzer IRAC 3.6 and 4.5 m photometric data (GLIMPSE360; = 3.6, 4.5 m; resolution = 2′′; Whitney et al., 2011), the UKIRT NIR Galactic Plane Survey (GPS; = 1.25, 1.65, 2.2 m; resolution 0′′.8; Lawrence et al., 2007), the Two Micron All Sky Survey (2MASS; = 1.25, 1.65, 2.2 m; resolution = 2′′.5; Skrutskie et al., 2006), and Isaac Newton Telescope (INT) Photometric H Survey of the Northern Galactic Plane (IPHAS; = 0.6563 m; resolution 1′′; Drew et al., 2005)). One can learn more details of these data sets and their analysis processes in Dewangan et al. (2017a).
3. Results
3.1. Extended features in the direction of l = 171.7 – 174.1
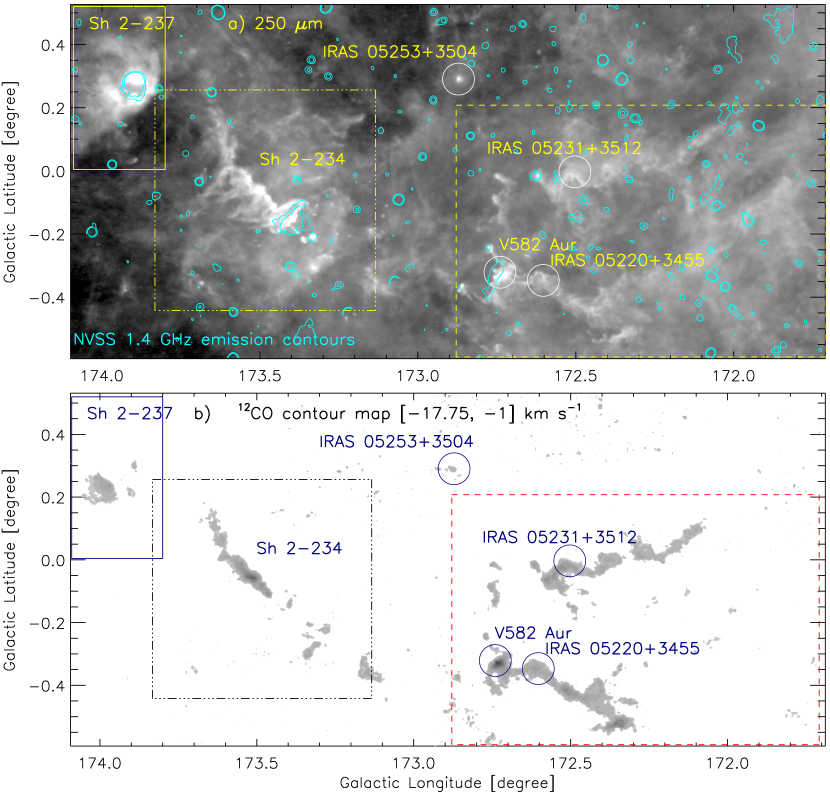
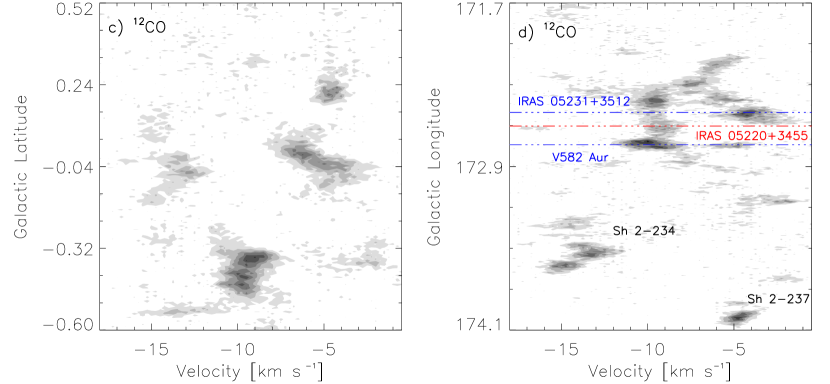
To explore the extended and embedded features toward l = 171.7 – 174.1, we have employed the sub-mm image at 250 m, radio continuum map at 1.4 GHz (having a rms sensitivity of 0.45 mJy/beam; Condon et al., 1998), and 12CO (J=1–0) line data (having a velocity resolution of 0.25 km s-1 and a rms sensitivity of 0.25 K; Heyer et al., 1996, 1998). These data enable us to depict cold dust, ionized gas, and molecular gas in the sites. Figure 1a displays the sub-mm image at 250 m overlaid with the 1.4 GHz continuum emission contours. Figure 1b shows the 12CO emission contour map at [17.75, 1.0] km s-1. We have labeled at least six objects (i.e. S237, S234, IRAS 05253+3504, IRAS 05231+3512, IRAS 05220+3455, and V582) in Figures 1a and 1b. The sub-mm image traces a sphere-like shell morphology of the site S237 and noticeable filamentary structures in the direction of S234, IRAS 05231+3512, IRAS 05220+3455, and V582. The extended ionized emission is observed toward the sites S237, S234, and V582 (see Figures 1a). The filamentary morphologies of the molecular clouds associated with the sites S234, IRAS 05231+3512, IRAS 05220+3455, and V582 are revealed in Figure 1b. To explore the molecular velocity structures, Figures 1c and 1d present the latitude-velocity and longitude-velocity plots of 12CO, respectively. Molecular gas in the sites S237, S234, IRAS 05231+3512, and V582 is traced in the velocity ranges of [7, 2] km s-1, [17.75, 10] km s-1, [8.5, 1] km s-1, and [12.5, 7.5] km s-1, respectively. These are different velocity ranges, indicating that these three sites do not belong to a single system, and are found at different distances (see Section 1). The sites IRAS 05220+3455 and V582 are physically linked and embedded in the same filamentary feature, whereas the site IRAS 05231+3512 is embedded in another filamentary feature which has no physical association with the sites IRAS 05220+3455 and V582. Note that no observational study of the site IRAS 05231+3512 is available in the literature. The paper does not include the results of the site S237, which have been reported by Dewangan et al. (2017a). A detailed study of the embedded filamentary features observed in the sites S234, IRAS 05231+3512, IRAS 05220+3455, and V582 is not available in the literature, and is presented in Sections 3.2 and 3.3.
3.2. Physical environment and star formation in the sites V582 and IRAS 05231+3512
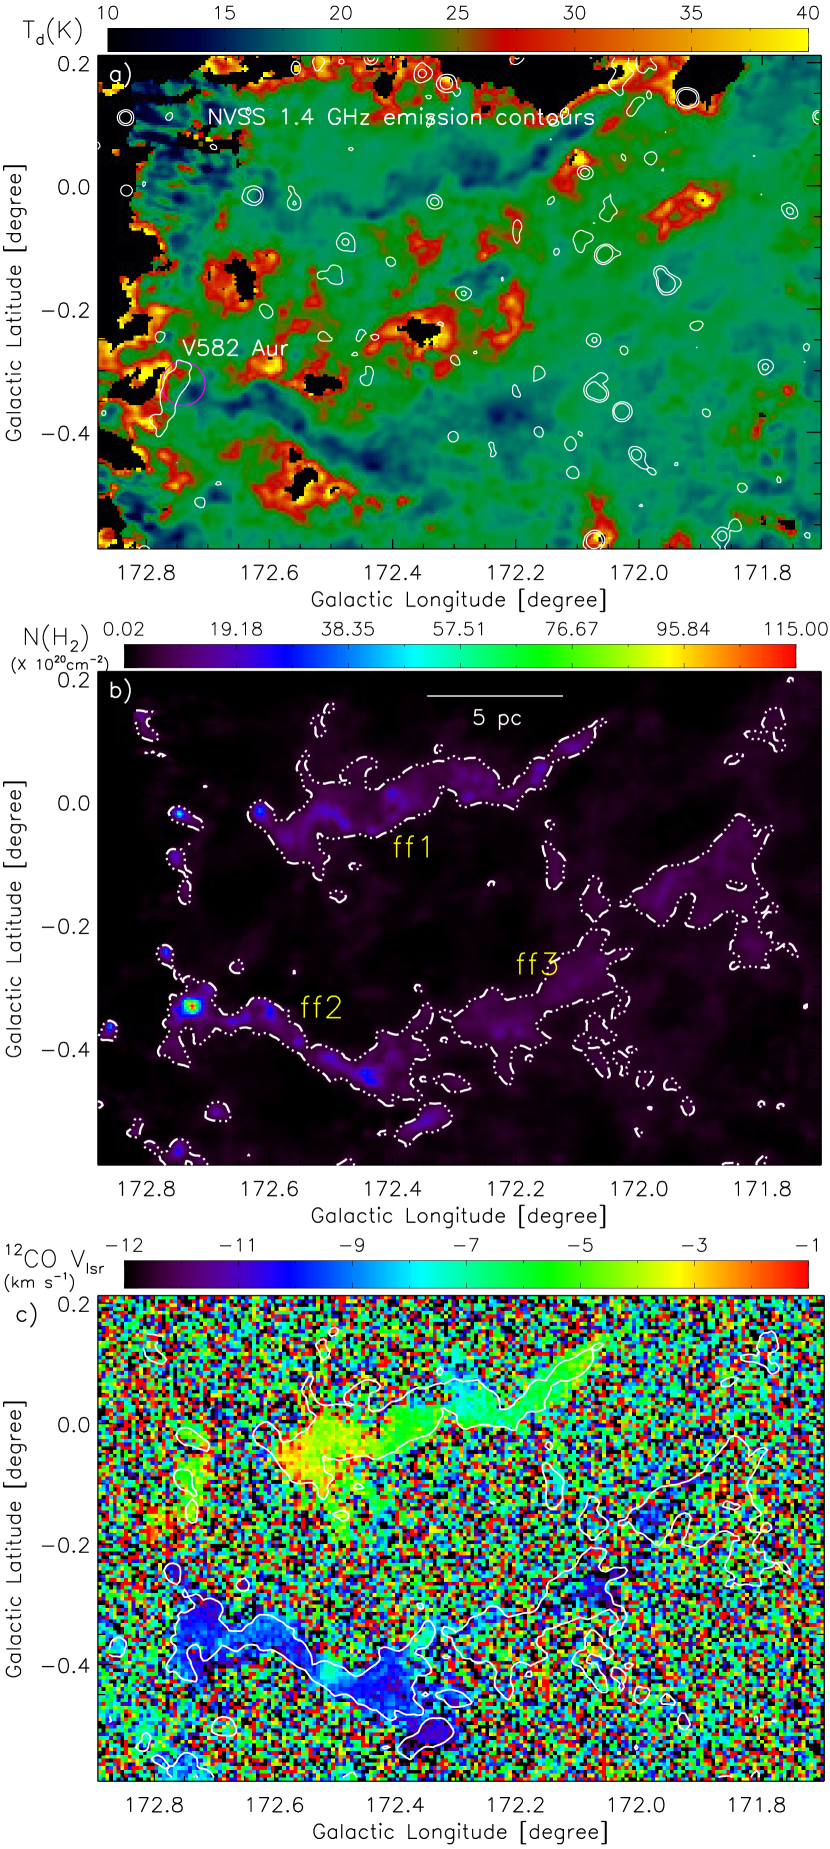
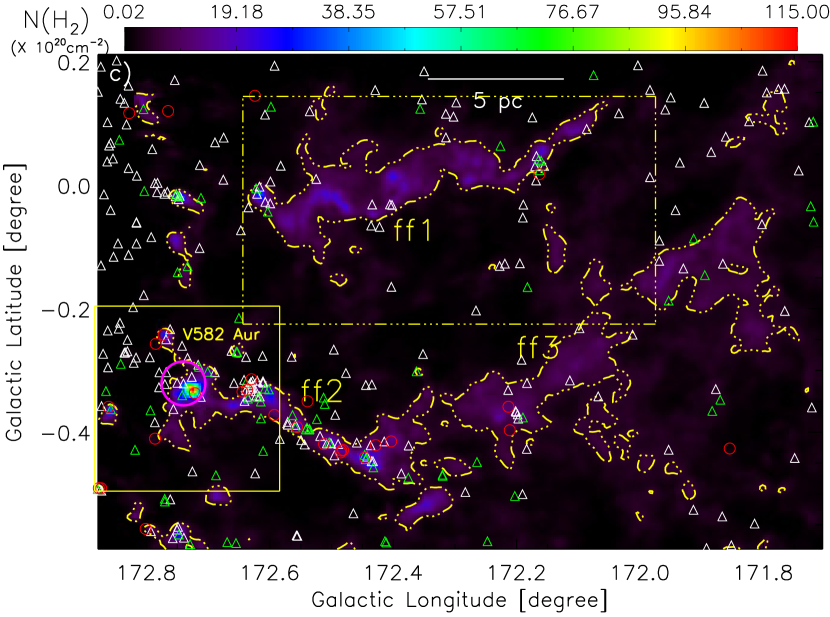
The temperature and column density maps (resolutions 37′′) of the sites V582 and IRAS 05231+3512 are presented in Figures 2a and 2b, respectively (see a dashed box in Figures 1a and 1b). Following the same analysis described in Mallick et al. (2015), these maps are produced using the Herschel 160–500 m images. The NVSS 1.4 GHz emission contours are also overlaid on the Herschel temperature map, tracing the ionized emission toward V582. A column density () contour with a level of 4.5 1020 cm-2 is also drawn in the Herschel column density map, allowing to infer filamentary features. At least three filamentary features are identified in the column density map, and are designated as ff1 (length 9.5 pc at a distance of 1.3 kpc), ff2 (length 12.7 pc at a distance of 1.3 kpc), and ff3 (length 6.9 pc at a distance of 1.3 kpc) (see Figure 2b). The feature ff1 contains IRAS 05231+3512, while the sites IRAS 05220+3455 and V582 are associated with the feature ff2. The features ff1, ff2, and ff3 are well traced in temperatures of 14–18 K (see Figure 2a). Figure 2c shows a first moment map of 12CO, revealing the distribution of mean velocities toward ff1, ff2, and ff3. The features ff2 and ff3 are traced in a velocity range of [12.5, 7.5] km s-1, while ff1 is depicted in velocities of [8.5, 1] km s-1.
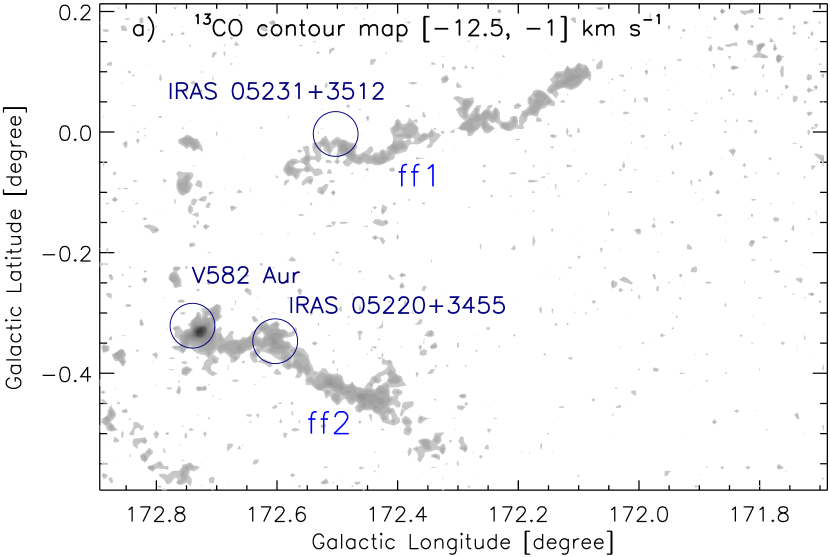
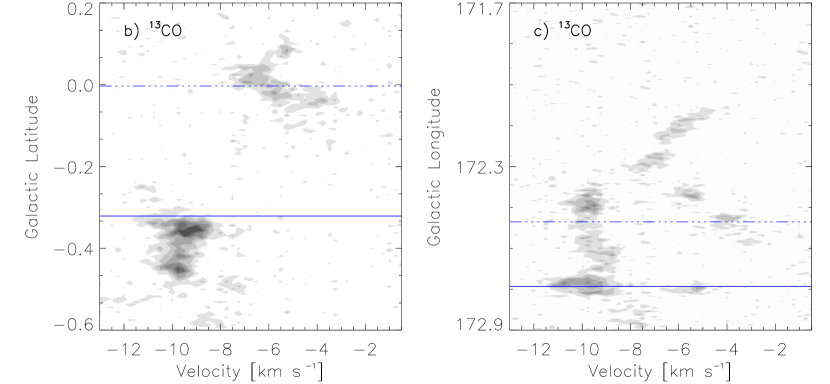
We have computed a total mass of ff1, ff2, and ff3 to be 355, 362, and 182 M⊙, respectively. Here, the same procedures are adopted for computing the masses of Herschel features/clumps as given in Mallick et al. (2015). The line masses or mass per unit lengths (i.e. ) of ff1, ff2, and ff3 are computed to be 37, 28, and 26 M⊙ pc-1, respectively. Due to unknown inclination angles of the filamentary features, the observed line masses show upper limits. A critical line mass is calculated to be 16–24 M⊙ pc-1 at T = 10–15 K. Here, the conversion relation is equal to 16 M⊙ pc-1 (Tgas/10 K) for a gas filament, assuming that the filament is an infinitely extended, self-gravitating, isothermal cylinder without magnetic support (e.g. Ostriker, 1964; Inutsuka & Miyama, 1997; André et al., 2014). If a condition is valid for a filament then it is a thermally supercritical filament, while a thermally subcritical filament is characterized with a condition . Our analysis suggests that the features ff1, ff2, and ff3 are thermally supercritical filaments. The thermally supercritical filaments should be unstable to radial gravitational collapse and fragmentation (e.g. André et al., 2010). In the direction of these filamentary features, several condensations, traced by column density peaks, are seen in the column density map (see Figure 2b). In Figure 3a, we display the integrated 13CO (having a velocity resolution of 0.25 km s-1 and a rms sensitivity of 0.2 K; Heyer et al., 1996, 1998) intensity map, where the molecular emission is integrated over a velocity interval of [12.5, 1] km s-1. Molecular 13CO gas is observed only toward the features ff1 and ff2 in the molecular intensity map. One can keep in mind that the optical depth in 12CO is much higher than that in 13CO. Hence, the 13CO emission can trace relatively denser parts of a star-forming region compared to that of 12CO emission. Figures 3b and 3c show the latitude-velocity and longitude-velocity plots of 13CO, respectively. These position-velocity maps also indicate the molecular gas in the features ff1 and ff2 at different velocity intervals as highlighted earlier.
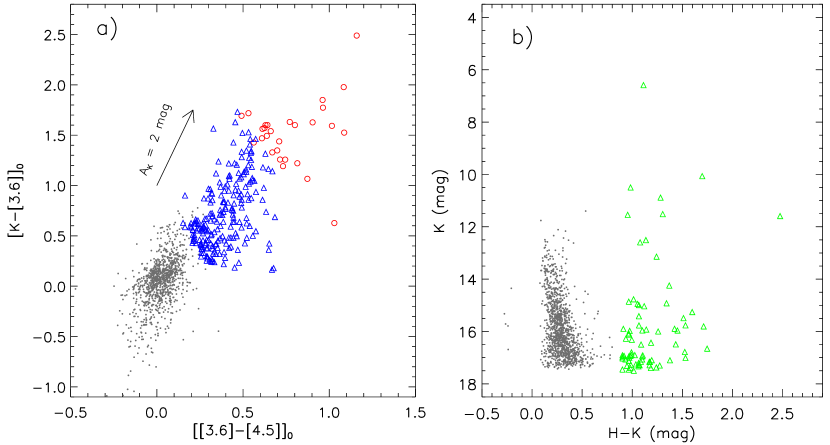
Based on the Spitzer-GLIMPSE360, UKIDSS-GPS, and 2MASS photometric data, the dereddened color-color scheme (i.e. [K[3.6]]0 and [[3.6][4.5]]0; see Figure 4a) and the NIR color-magnitude scheme (i.e. HK/K; see Figure 4b) are utilized to identify the infrared-excess YSOs. More detailed descriptions of these schemes are given in Dewangan et al. (2017a) (see also Gutermuth et al., 2009). In the direction of our selected area around V582, color-color and color-magnitude schemes yield 243 (28 Class I and 215 Class II) YSOs, and 76 YSOs, respectively. Figure 4c shows the spatial distribution of these YSOs overlaid on the column density map. The most of Class I YSOs (mean lifetime 0.44 Myr; Evans et al., 2009) and Class II YSOs (mean lifetime 1–3 Myr; Evans et al., 2009) are seen along the feature ff2 (hosting IRAS 05220+3455 and V582), revealing the noticeable star formation activity. However, there is a very little star formation activity found in the features ff1 and ff3 (see Figure 4c).
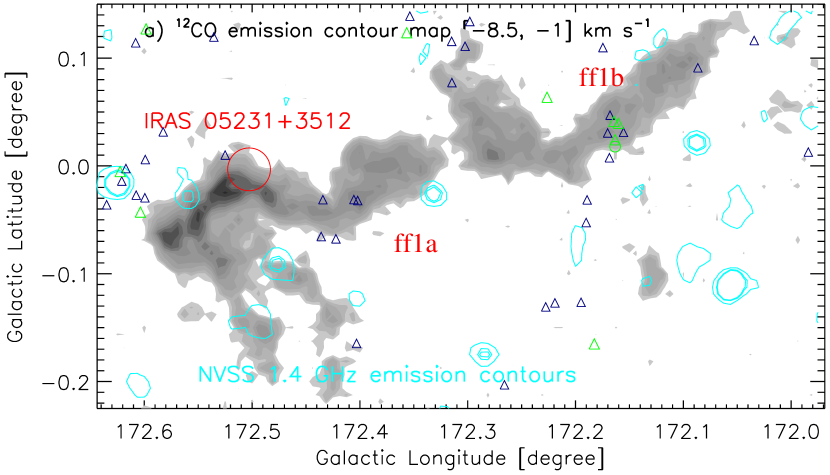
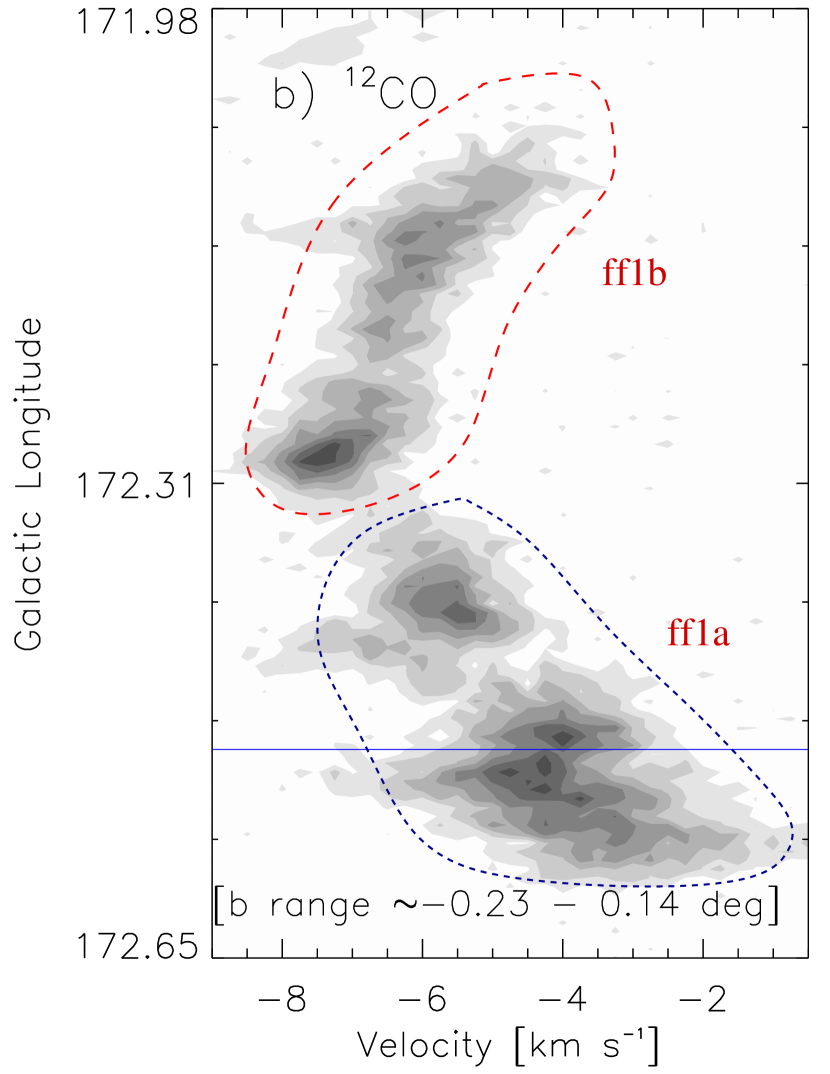
In the direction of the feature ff1 containing IRAS 05231+3512, Figure 5a displays the integrated 12CO intensity map at [8.5, 1] km s-1 overlaid with the NVSS contours. There is no radio continuum emission observed toward IRAS 05231+3512. The selected YSOs are also overlaid on the molecular intensity map, where two distinct subcomponents (i.e. ff1a and ff1b) are highlighted. Figure 5b shows the longitude-velocity plot of 12CO toward the feature ff1, where the subcomponents ff1a and ff1b are indicated by broken curves. Molecular gas in the subcomponents is physically connected in the velocity space, confirming the feature ff1 as a single elongated structure. Furthermore, noticeable velocity gradient along each subcomponent is depicted in the position velocity plot (see Figure 5b). Our analysis suggests the existence of star-less clumps/condensations in the supercritical filament ff1.
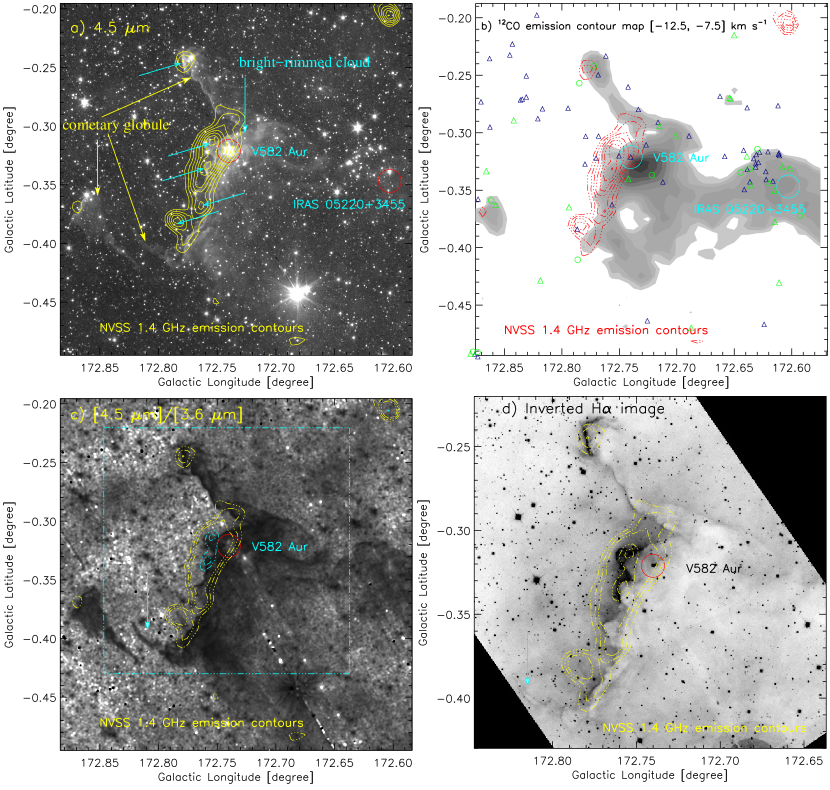
Using the Spitzer 4.5 m image, Figure 6a shows a zoomed-in view of the feature ff2 (hosting IRAS 05220+3455 and V582), and reveals bright-rims and cometary globules in the local environment of V582. V582 is seen around one of the corners of the feature ff2. The image is also overlaid with the NVSS 1.4 GHz continuum emission contours. The ionized emission is mainly seen toward the bright-rims and the tips of the cometary globules. The NVSS 1.4 GHz map also shows at least five radio peaks (see arrows in Figure 6a). Based on the peak flux value of each radio peak, we find that each of the radio peaks is powered by a B3–B2 type star, indicating the presence of massive stars in the local vicinity of V582. However, the observed position of V582 does not coincide with any of the radio continuum peaks. For estimating the Lyman continuum photons and spectral type of each radio peak, we have utilized the same equation and procedures given in Dewangan et al. (2017a). In the calculations, we considered a distance of 1.3 kpc and an electron temperature of 104 K. Here, we used the models of Panagia (1973) to infer the spectral classes from the observed Lyman photons. Figure 6b displays the integrated 12CO intensity map overlaid with the NVSS contours. The 12CO emission is integrated over a velocity interval of [12.5, 7.5] km s-1. The selected YSOs are also marked in the molecular intensity map. In Figure 6b, star formation is evident toward the bright-rims and cometary globules. A group of YSOs is also found around IRAS 05220+3455, where the NVSS 1.4 GHz emission is absent. In Figures 6c and 6d, we display the overlay of the NVSS 1.4 GHz continuum emission on the Spitzer-IRAC ratio map of 4.5 m/3.6 m emission and the IPHAS H inverted gray-scale image. The details of the ratio map can be found in Dewangan et al. (2016a). Figure 6d displays the spatial association between the H extended features and the radio continuum emission. The ratio map shows the extended black or dark gray regions due to the excess of 3.6 m emission, Note that the Spitzer 3.6 m band contains polycyclic aromatic hydrocarbon (PAH) emission at 3.3 m. Hence, the ratio map traces photodissociation regions (or photon-dominated regions, or PDRs) around the bright-rims. It implies that the origin of the bright-rims and the cometary globules appears to be influenced by the feedback process (such as, radiation pressure, pressure-driven H ii region, and stellar wind) of massive B type stars.
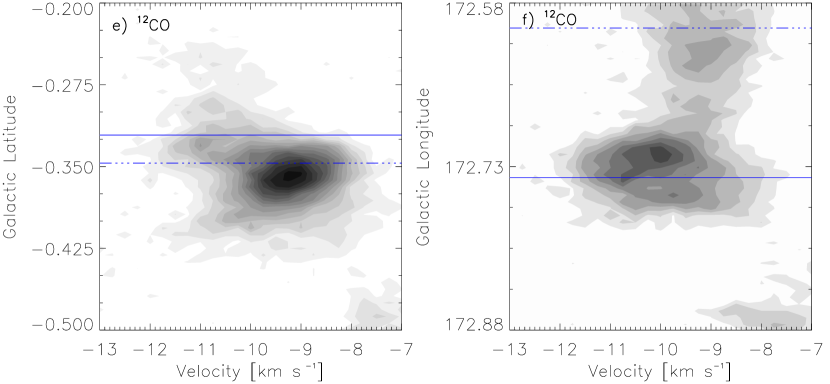
Figures 6e and 6f show the latitude-velocity and longitude-velocity plots of 12CO, respectively. In the velocity space, a velocity spread is found in the direction of V582 (see Figure 6e), and the physical association of IRAS 05220+3455 and V582 is also evident (see Figure 6f). Together, the thermally supercritical filament ff2 is observed with the clusters of YSOs and massive stars.
3.3. Physical environment and star formation in the site S234
3.3.1 Multi-wavelength continuum images of S234
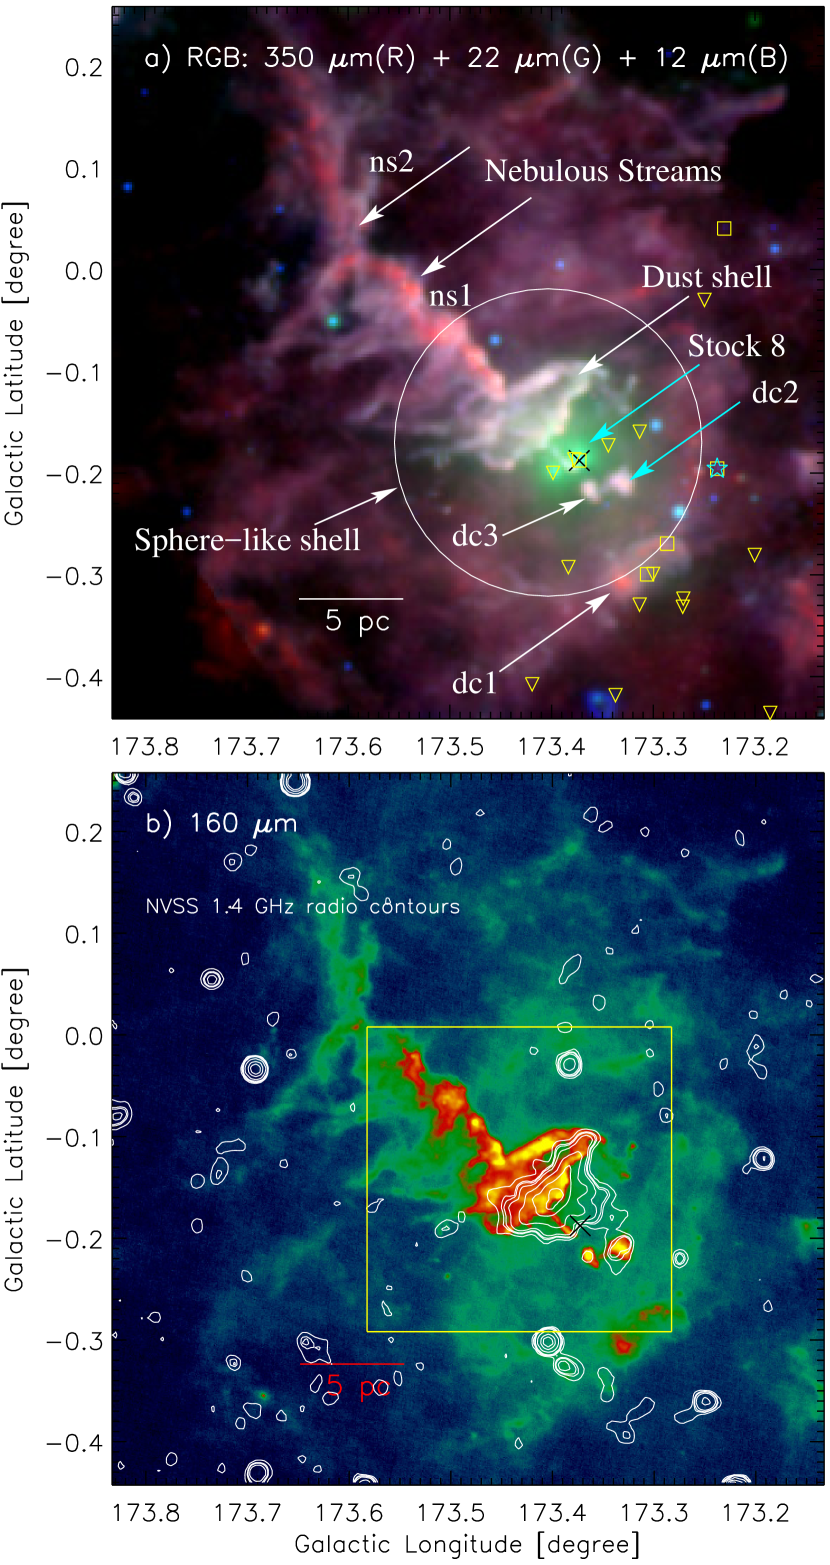
Figure 7a shows a color-composite map (red: 350 m; green: 22 m, and blue: 12 m) of the 0.7 0.7 area of the site (see a dotted-dashed box in Figures 1a and 1b). The positions of several OB stars (from Marco & Negueruela, 2016) are also marked in the composite map. At least two nebulous stream features, designated as ns1 and ns2, are prominently seen in the 350 m image, while Stock 8 is more bright in the 12–22 m images. The composite map also reveals a sphere-like shell structure (see a highlighted circle in Figure 7a). The positions of a star LS V +3423 (spectral type: O8 II(f); Marco & Negueruela, 2016) and a star BD+341054 (LS V +3429; spectral type: O9.7 IV; Marco & Negueruela, 2016) are also highlighted in the composite map. The massive OB stars distributed around Stock 8 (see squares and upside down triangles in Figure 7a) may explain the observed sphere-like shell structure through their feedback mechanism. A false color image at 160 m of the site S234 is shown in Figure 7b, and the map is also overlaid with the NVSS 1.4 GHz emission contours. A dust shell, where the ionized emission is observed, is remarkably seen in the MIR and sub-mm images (see Figures 7a and 7b). Additionally, at least three dust condensations, designated as dc1, dc2, and dc3, are also indicated in Figure 7a. The massive OB stars are also seen toward the condensation dc1 (see squares and upside down triangles in Figure 7a).
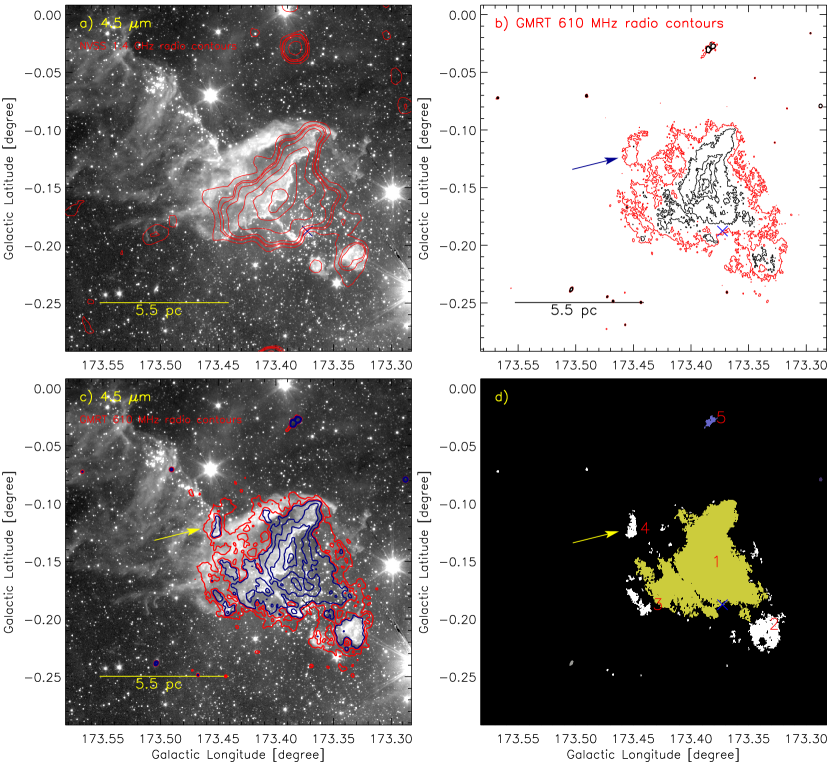
Using the Spitzer 4.5 m image, a zoomed-in view of the dust shell is shown in Figure 8a. The 4.5 m image is also overlaid with the NVSS 1.4 GHz continuum emission. In Figure 8b, we present new high-resolution GMRT radio continuum contours map at 610 MHz (resolution 56 46; rms 120 Jy/beam). The GMRT radio contours are also overlaid on the Spitzer 4.5 m image (see Figure 8c), where the radio map is smoothened using a Gaussian function. Note that the GMRT map has better resolution and sensitivity compared to the NVSS data. Hence, the GMRT map provides more insight into the ionized features. The radio map at 610 MHz shows the distribution of the ionized gas toward the dust shell, Stock 8, and two dust condensations (i.e. dc2 and dc3). Furthermore, the ionized emission appears to be extended toward the nebulous stream ns1 in the GMRT map (see an arrow in Figures 8b, 8c, and 8d), and is not detected in the NVSS map. Table 1 lists physical parameters (i.e. position, radius, total flux, Lyman continuum photons, and spectral type) of five ionized clumps detected in the GMRT 610 continuum map. For estimating the Lyman continuum photons, we have used a distance of 2.8 kpc and an electron temperature of 104 K. The extension of each of the ionized clumps is also shown in Figure 8d. All these ionized clumps are powered by massive B type stars (see Table 1). To obtain the spectral class of each of the ionized clumps, the models of Panagia (1973) are employed.
3.3.2 Molecular maps of S234
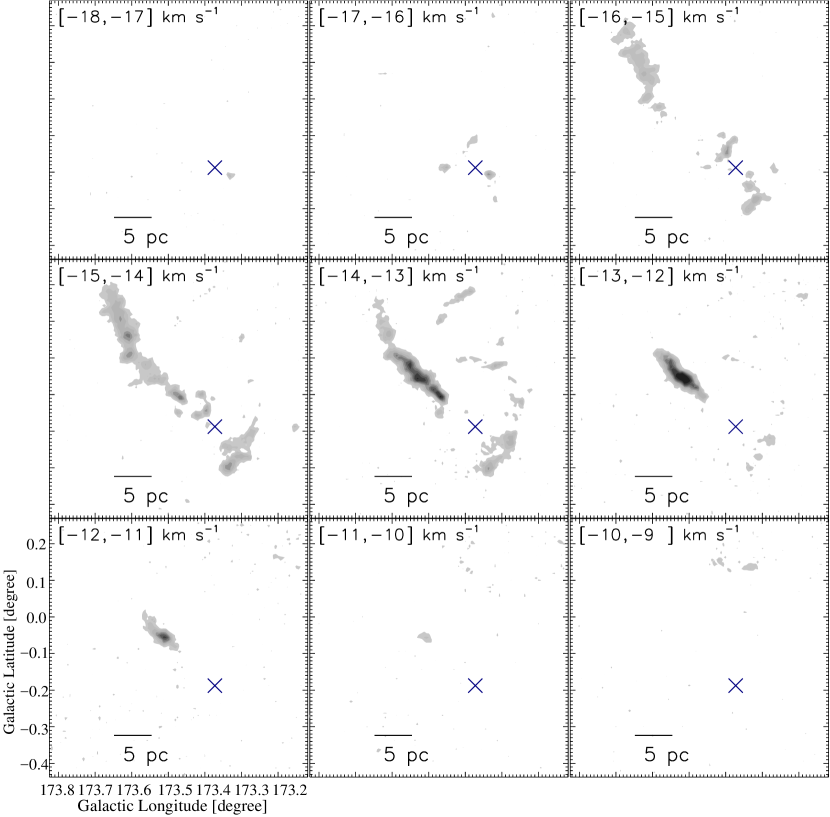
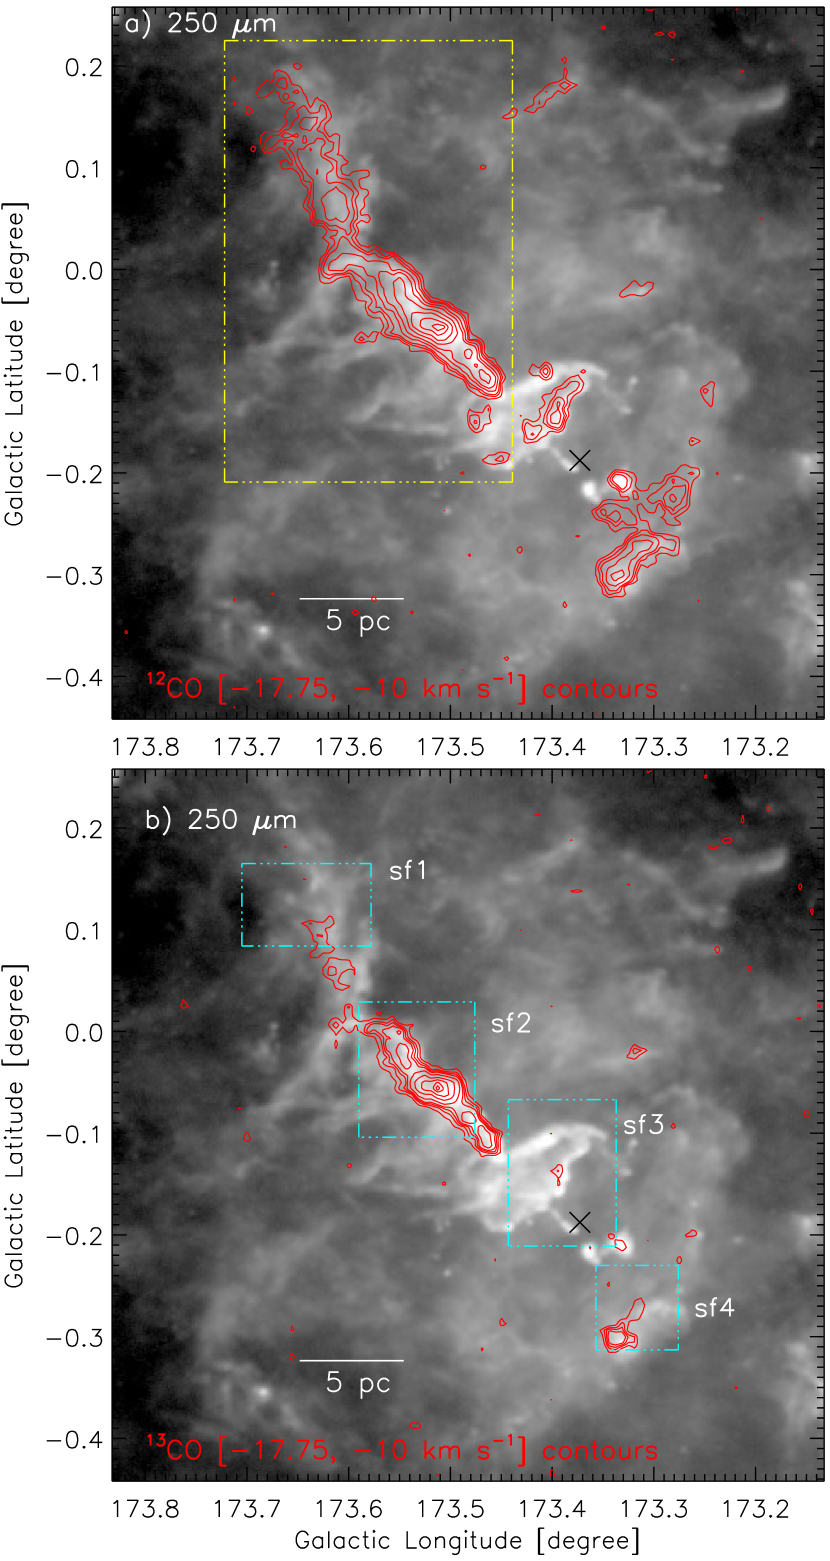
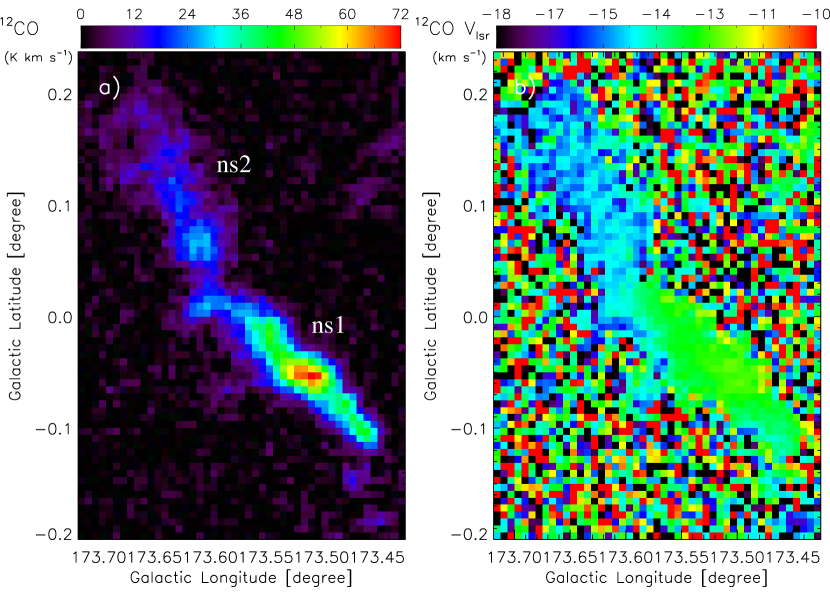
Figure 9 displays the integrated FCRAO 12CO (J=1-0) velocity channel maps (at intervals of 1 km s-1). Based on the gas distribution in different velocities, the maps confirm the existence of two nebulous streams in the site S234. Figures 10a and 10b show the integrated 12CO and 13CO emission contours overlaid on the Herschel 250 m map, respectively. The CO emission is integrated over a velocity interval of [17.75, 10] km s-1. Molecular gas is not observed toward Stock 8. The 12CO emission is detected toward the nebulous streams, dust shell, and dust condensations, as highlighted in Figure 7a, while the 13CO emission is prominently seen toward the features ns1 and dc1. It implies that the features ns1 and dc1 seem to be more denser regions in the site S234. Figure 10c displays the average 12CO profiles toward four small fields (i.e. sf1, sf2, sf3, and sf4). The fields sf1, sf2, sf3, and sf4 are selected in the direction of the features ns2, ns1, dust shell, and dust condensation, respectively. In the profiles, the molecular velocity peaks toward the fields sf1, sf3, and sf4 are almost same (i.e. around 15 km s-1), while the velocity peak in the direction of the field sf2 is seen around 13 km s-1.
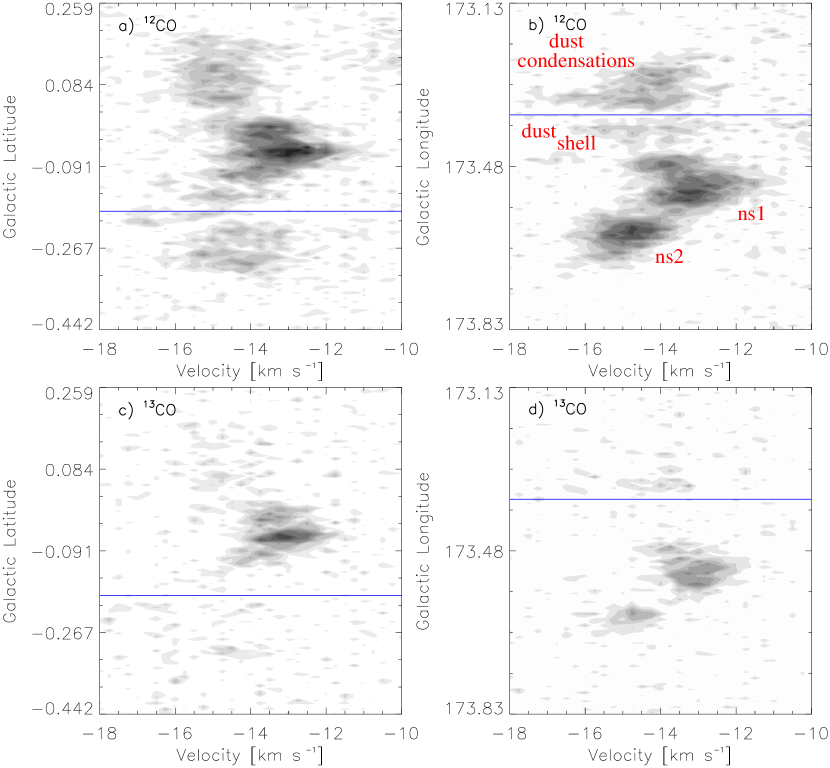
To further study the molecular velocity structures, Figure 11 presents the position-velocity maps in the direction of the site S234. Figures 11a and 11c show the latitude-velocity plots of 12CO and 13CO, respectively. Figures 11b and 11d present the longitude-velocity plots of 12CO and 13CO, respectively. The nebulous streams ns1 and ns2 are depicted at different velocity peaks, but they are linked by noticeable intermediate diffuse emission. These maps confirm the physical association of different features (i.e. ns2, ns1, dust shell, and dust condensation) in the site S234, and the velocity spread is observed toward all these different features. Using the 12CO line data, a zoomed-in view of the nebulous streams is displayed in Figures 12a and 12b. The integrated 12CO emission at [17.75, 10] km s-1 is shown in Figure 12a, while the first moment map of 12CO is presented in Figure 12b. The first moment map clearly displays the boundary of the two nebulous streams. In the direction of nebulous streams, Figures 12c – 12f show the position-velocity plots of 12CO and 13CO. The filaments ns1 and ns2 are interconnected in the velocity space of 12CO and 13CO (see broken boxes in Figure 12a). In the velocity space, a velocity spread is noticeably seen in the direction of ns1.
3.3.3 Herschel column density and temperature maps of S234
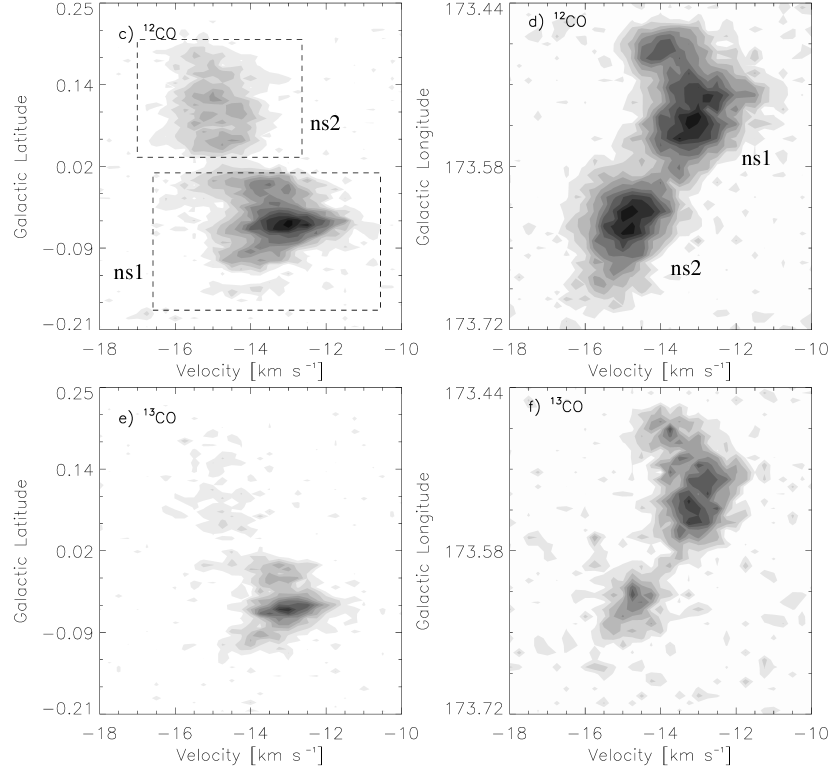
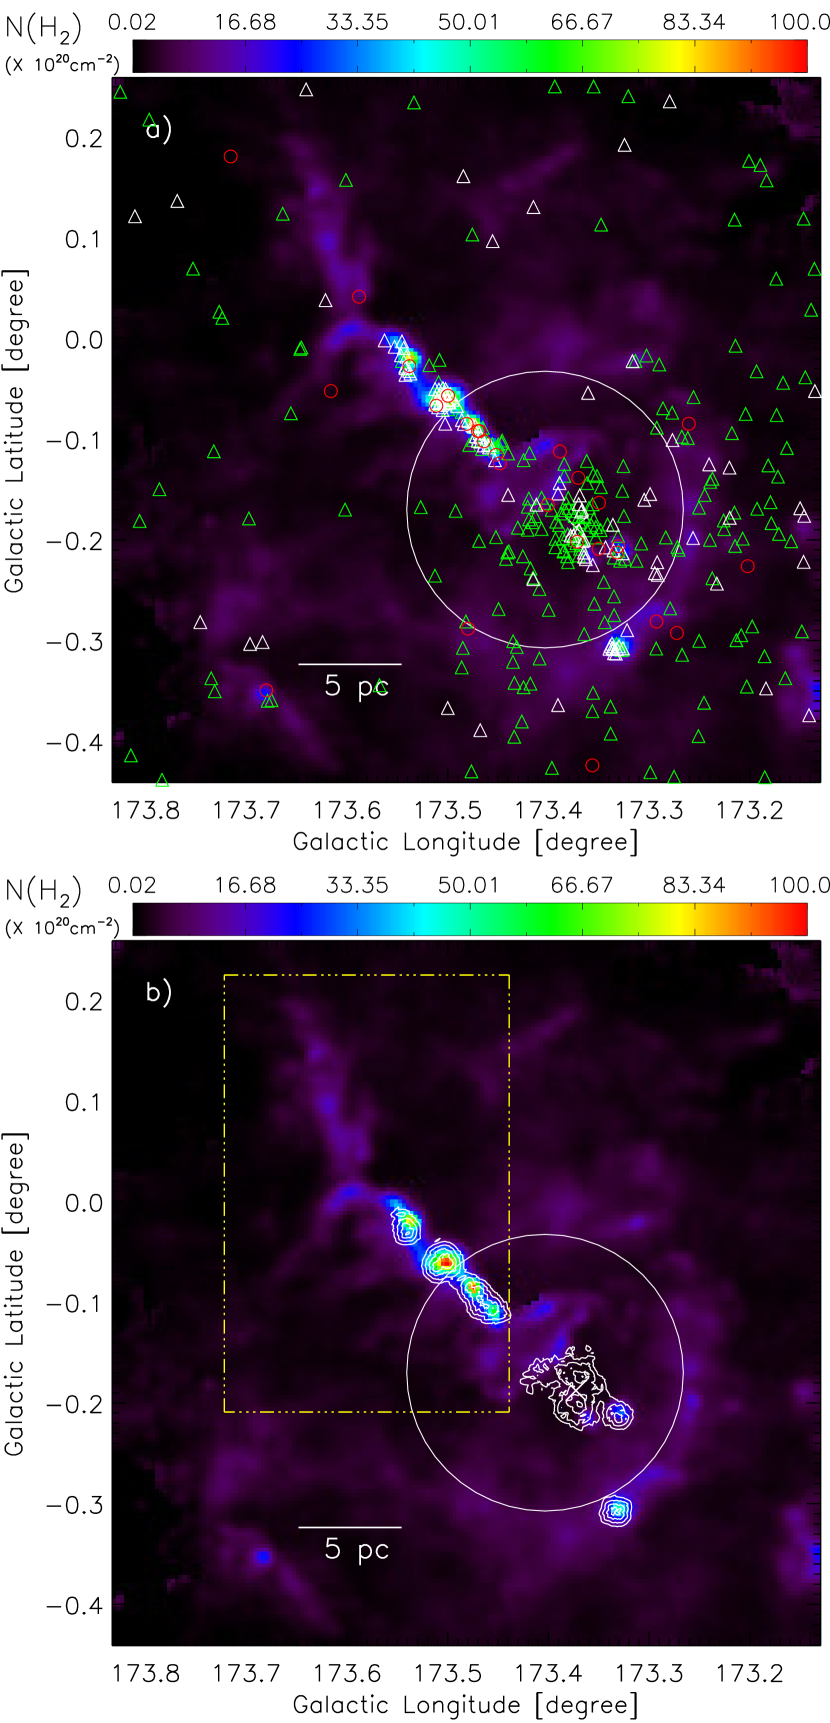
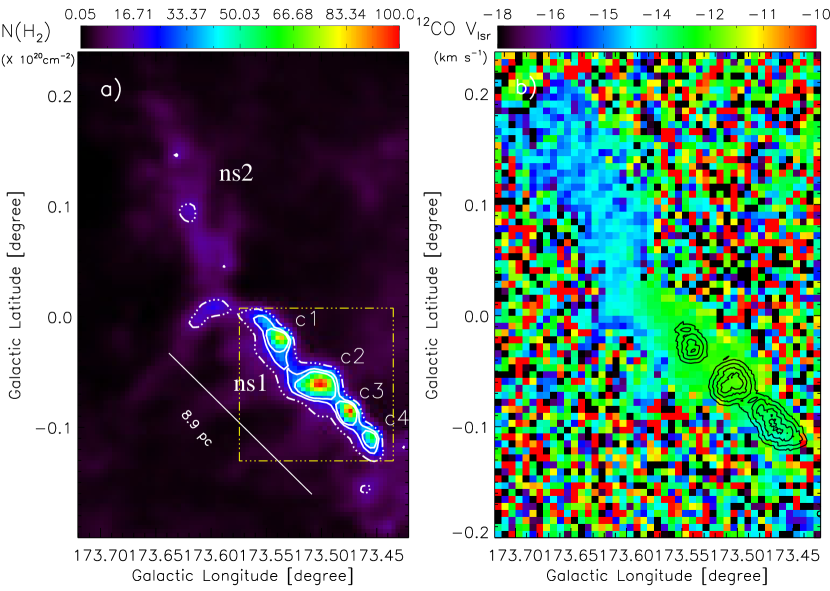
Figures 13a and 13b display the temperature and column density maps (resolutions 37′′) of the site S234. In Figure 13a, the filamentary features are seen with temperatures (Td) of around 19 K, while Stock 8 and dust shell are depicted in a temperature range of 27–30 K (see a big circle in Figure 13a). The column density map reveals the embedded morphology of the S234 complex. The map clearly depicts several condensations (having peak 6–10 1021 cm-2) in a single 8.9 pc long filamentary feature (or nebulous stream ns1), which is indicated by the column density contour of 1.33 1021 cm-2. The nebulous stream ns2, having length 8.7 pc, is also traced in the column density map. Interestingly, in the temperature map, the nebulous stream ns1 (around 19 K) appears to be surrounded by an extended structure with temperatures of 27–30 K (see Figure 13a). We have identified a total of 32 clumps in the column density map, which are labeled in Figure 13c. Table 2 summarizes the properties (i.e. mass and effective radius) of the identified Herschel clumps. Among these clumps, we find that 25 clumps are distributed toward the sphere-like shell structure (including the dust condensations), nebulous streams, and dust shell (see ID nos. 1–25 in Table 2). The masses of these clumps vary between 10–593 M⊙. Figure 13c also displays the extension of each clump. Twelve Clumps (IDs 12-20 and 23–25) are seen toward the sphere-like shell, while the dust shell contains five clumps (IDs 7–11). The condensation dc1 (see clump ID 23) is found to be more massive compared to other condensations (i.e. dc2 (see clump ID 21) and dc3 (see clump ID 22)). Three clumps (IDs 1–3) are associated with the filament ns2 (length 8.7 pc, temperature 19 K), and the total mass of these clumps is 392 M⊙. The filament ns1 (length 8.9 pc, temperature 19 K) contains three clumps (IDs 4–6), and the total mass of these clumps is 1154 M⊙, which we also consider as the mass of the filament ns1 (i.e. Mns1). Note that at least four column density peaks (or condensations) are found within these three clumps.
The values of for the filaments ns1 and ns2 are also computed to be 130 and 45 M⊙ pc-1, respectively. These values are much higher than 32 M⊙ pc-1 (at T = 20 K). Hence, there are two thermally supercritical filaments in the site S234.
3.3.4 Embedded young stellar objects in S234
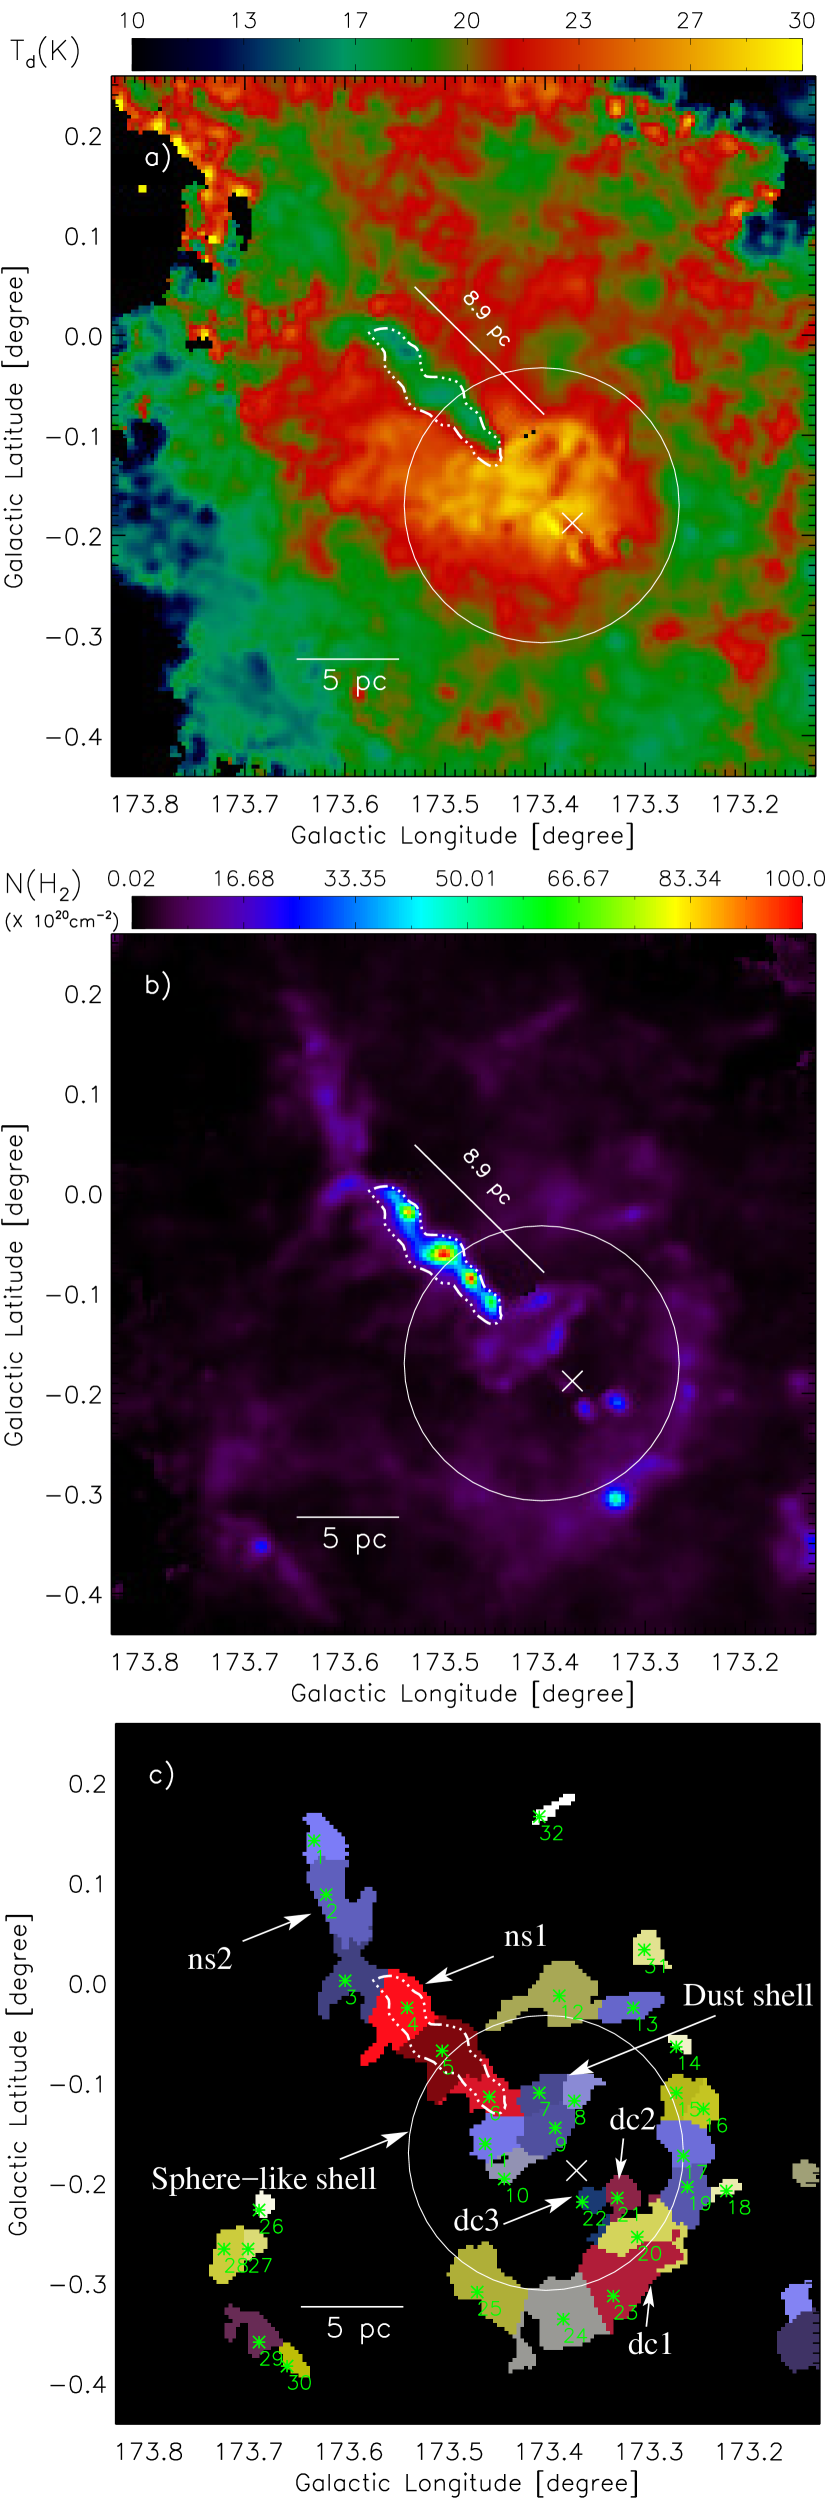
Figures 14a and 14b display the dereddened color-color plot (i.e. [K[3.6]]0 and [[3.6][4.5]]0) and the NIR color-magnitude plot (i.e. HK/K) of point-like objects in the site S234, respectively. Color-color and color-magnitude schemes give 251 (27 Class I and 224 Class II) YSOs, and 122 YSOs, respectively. Figure 15a shows the spatial distribution of the YSOs overlaid on the column density map. Figure 15b presents the overlay of the surface density contours of YSOs on the column density map. The YSO density contour levels are 3, 5, 10, and 25 YSOs pc-2. More detailed descriptions for obtaining the surface density map are given in Dewangan et al. (2017a). The clusters of YSOs are seen toward the filament ns1, Stock 8, and dust condensations (i.e. dc1, dc2, and dc3), revealing ongoing star formation activities toward them. The condensation dc2 contains both the Class I and Class II YSOs, while only Class II YSOs are found toward dc1 and dc3.
3.3.5 Embedded condensations in the filament ns1
Figures 16a and 16b display the column density and first moment maps of the filaments ns1 and ns2. The surface density contours of YSOs are also overlaid on the first moment map. The supercritical filament ns2 is associated with three clumps (nos. 1–3), where YSOs are not found. No radio continuum emission is observed toward the filament ns2. It indicates that the filament ns2 seems to be at an early stage of fragmentation.
On the other hand, the supercritical filament ns1 hosting three clumps (nos. 4–6) is seen with a large number of YSOs. In the column density map (resolutions 37′′ or 0.5 pc at a distance of 2.8 kpc), we find at least four distinct condensations, designated as c1–c4, within three clumps in the direction of the filament ns1. The boundary of each condensation is traced with the column density contour of 28.3 1020 cm-2 (see Figure 16a). The peak column densities of c1, c2, c3, and c4 are found to be 8.6 1021 cm-2 ( = 9.2 mag), 10 1021 cm-2 ( = 10.7 mag), 10 1021 cm-2 ( = 10.7 mag), and 6 1021 cm-2 ( = 6.4 mag), respectively. Here, we use a conversion relation, i.e. (Bohlin et al., 1978). The masses (radii) of c1, c2, c3, and c4 are computed to be 130 (0.6 pc), 170 (0.75 pc), 300 (0.9 pc), and 70 (0.5 pc), respectively.
Based on the 13CO line data, Mach numbers are derived for the condensations c1, c2, c3, and c4 to be 2.4, 3.1, 2.7, and 2.2, respectively, indicating that all the condensations are supersonic. Mach number is defined by the ratio of non-thermal velocity dispersion () to sound speed (). We have also computed the ratio of thermal to non-thermal pressure (; Lada et al., 2003). The values of for c1, c2, c3, and c4 are estimated to be 0.17, 0.11, 0.14, and 0.20, respectively. It suggests that the non-thermal pressure is higher than the thermal pressure in all the condensations. One can estimate the sound speed (= ) using the value of gas kinetic temperature (Tkin) and mean molecular weight (=2.37; approximately 70% H and 28% He by mass). The non-thermal velocity dispersion is given by:
| (1) |
where is the measured Full Width Half Maximum (FWHM) linewidth of the observed 13CO spectra, (= ) is the thermal broadening for 13CO at Tkin, and is the mass of hydrogen atom. The measured values for c1, c2, c3, and c4 are 1.5, 1.8, 1.6, and 1.4 km s-1, respectively. In the calculation, we have used the value of Tkin to be 19 K (see Section 3.3.3). The estimated values of for c1, c2, c3, and c4 are 0.62, 0.78, 0.69, and 0.57 km s-1, respectively. The ratio of / (i.e. Mach number) is also calculated for the filament ns1 to be 3, indicating that the thermally supercritical filament ns1 is supersonic. One can also consider the contribution of the non-thermal gas motions in the estimate of the critical line mass (), which is known as the virial line mass (i.e. ; André et al., 2014; Kainulainen et al., 2016). One can write the expression of = [1 + (/)2] [16 M⊙ pc-1 (Tgas/10 K)]. In the case of the filament ns1, the value of (320 M⊙ pc-1) is more than 10 times higher than (32 M⊙ pc-1 at T = 20 K), and is also larger than (130 M⊙ pc-1). The significance of these estimates is discussed in Section 4.4.
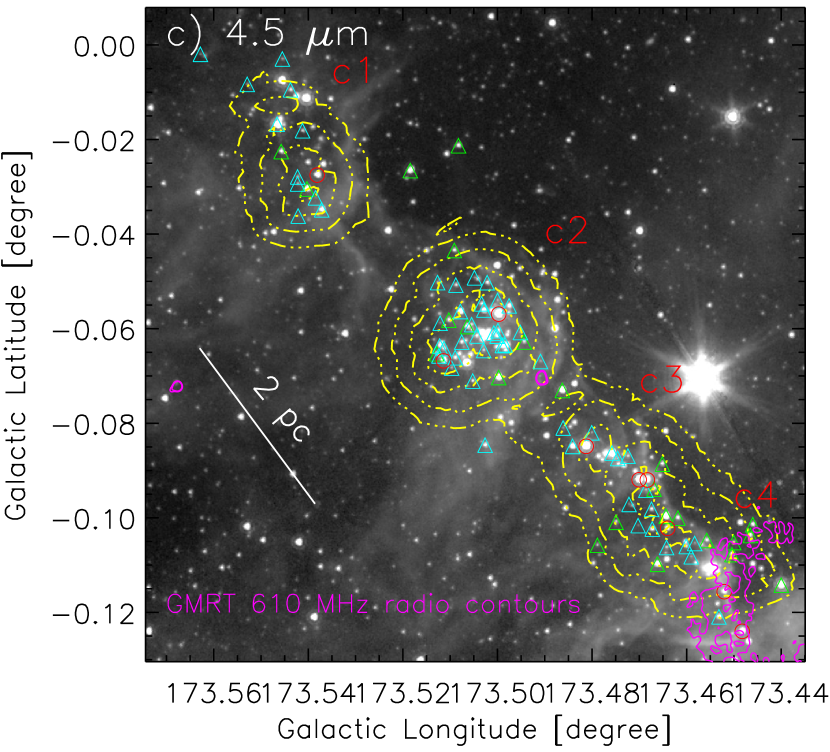
Using the Spitzer 4.5 m image, a zoomed-in view of the ns1 is shown in Figure 16c. The image is also overlaid with the YSO surface density contours, the positions of 88 YSOs (9 Class I and 79 Class II), and the GMRT radio contours. The radio continuum emission is absent toward all the four condensations. Considering the detections of both the Class I and Class II YSOs, we use star formation timescale to be 1-2 Myrs in the filament ns1 (e.g. Jose et al., 2008; Evans et al., 2009). We have also determined the star formation efficiency (SFE) and the star formation rate (SFR) in the filament ns1. In general, the low-mass star-forming regions follow a log-normal Initial Mass Function (IMF) with a characteristic mass of 0.5 (e.g. Chabrier, 2003). Hence, we assume a mean mass of 0.5 for each YSO in the filament ns1. About five Class II YSOs appear away from the condensations or surface density contours (see Figure 16c). Hence, we compute a total mass of 80 YSOs in the filament ns1 (i.e. Mysos = 80 0.5 = 40 ). Adopting the values of Mysos and a total mass of the filament ns1 (i.e. Mns1 = 1154 ), we have obtained the SFE (i.e. Mysos/(Mysos + Mns1)) to be 0.033 (or 3.3%). Following the work of Evans et al. (2009), the SFR (i.e. Mysos/tsf) is estimated to be 40–20 Myr-1, where tsf is the star formation timescale (i.e. 1–2 Myr). This quantitative analysis indicates the intense star formation activity in the thermally supercritical filament ns1.
4. Discussion
4.1. Large-scale structure in the direction of l = 172.8; b = 1.5
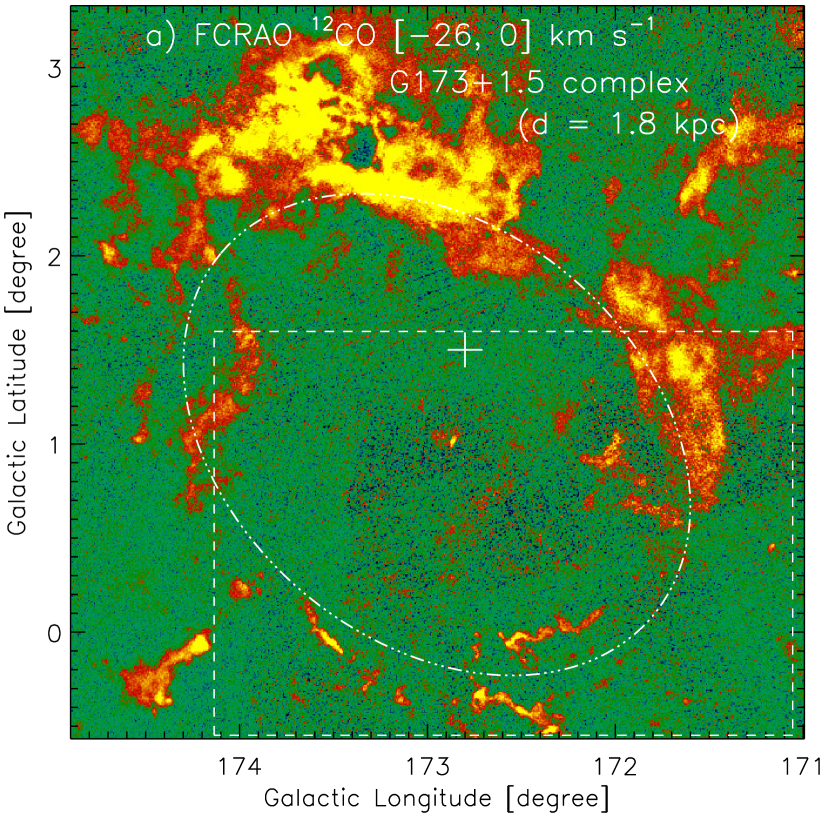
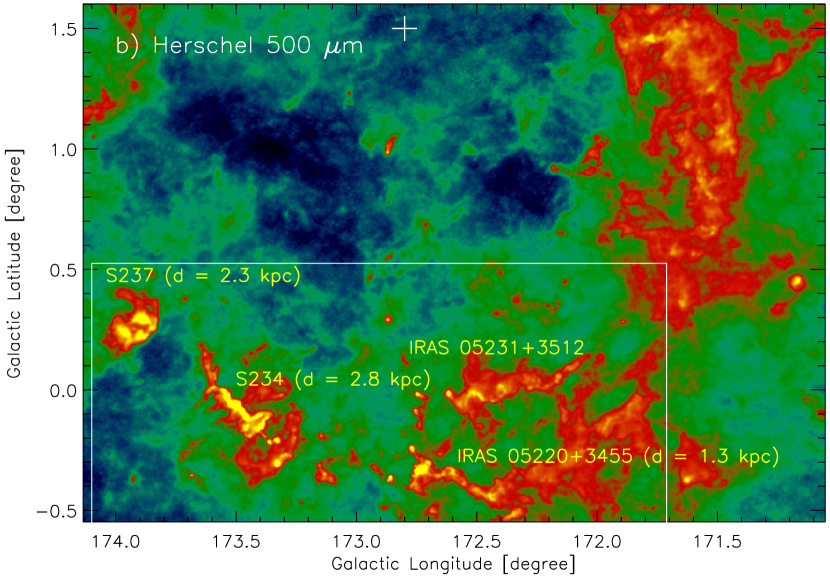
In Figure 17a, we present an integrated 12CO emission map toward l = 172.8; b = 1.5, and the molecular emission is integrated over a velocity interval of [26, 0] km s-1. An extended structure is seen in the molecular intensity map (see a dotted-dashed ellipse in Figure 17a). Earlier, Kang et al. (2012) and Kirsanova et al. (2017) also reported a similar extended shell-like structure/bubble-shaped nebula in the same longitude direction (see Figure 5 in Kang et al., 2012, and Figure 1 in Kirsanova et al. 2017). In Figure 17b, the Galactic southern side of the extended structure is also presented using the Herschel 500 m image, where our selected star-forming regions (i.e. S234 (Vlsr 13.4 km s-1; d = 2.8 kpc), IRAS 05220+3455 (Vlsr 10 km s-1; d = 1.3 kpc), IRAS 05231+3512 (Vlsr 6 km s-1), and S237 (Vlsr 4.5 km s-1; d = 2.3 kpc)) are located (see a solid box in Figure 17b). An active star-forming complex G173+1.5 is located in the Galactic northern side of the extended structure (at d 1.8 kpc and Vlsr 20 km s-1), where five Sharpless H ii regions S231–S235 are distributed. These star-forming regions appear to be distributed toward the edges of the extended molecular structure. However, in the direction of the extended structure, different velocity components/star-forming sites are traced in the velocity range of [26, 0] km s-1, and are situated at different distances. It implies that the extended molecular structure cannot be considered as a single physical system.
Previously, Kang et al. (2012) reported the existence of an old supernova remnant (SNR) FVW 172.8+1.5 (age 0.3 Myr) in the direction of l = 172.8; b = 1.5, and suggested that the SNR is responsible for the extended shell-like structure/bubble-shaped observed in the same longitude direction (see Figure 5 in their paper). They adopted a systemic velocity (Vsys) and a distance of FVW172.8+1.5 to be 20 km s-1 and 1.8 kpc, respectively, which are very similar to that of the H ii complex G173+1.5. Hence, these authors pointed out that the SNR is originated inside the H ii complex G173+1.5. They proposed that the energetics of the SNR (having a kinetic energy 2.5 1050 erg) may have affected the star formation activities in the H ii complex G173+1.5 and our selected star-forming sites. However, the SNR with the age of 0.3 Myr is too young to be a triggering agent. It is supported with the fact that the average ages of YSOs are computed to be 0.44–3 Myr (e.g. Evans et al., 2009), and YSOs are utilized as an excellent tracer for inferring the star formation activity in a given star-forming site. Kang et al. (2012) further proposed that the parent stellar association of the SNR could have influenced the birth of the massive OB stars seen near the edges of the extended structure. However, Kirsanova et al. (2014) discussed that shock waves from the SNR cannot trigger the formation of S235. Based on the photometric and spectroscopic study, Marco & Negueruela (2016) also rejected any influence of the large-scale shocks to the star-formation in the site S234. Considering the observed distances and molecular velocity ranges, we do not find any physical association of our selected sites with the SNR or its parent stellar association (see also Marco & Negueruela, 2016). Together, the proposed scenario of Kang et al. (2012) is unlikely to be applicable in our selected star-forming sites (i.e. S234, V582, IRAS 05220+3455, and S237).
4.2. Supercritical filaments in the direction of l = 171.7 – 174.1
In the direction of our selected longitude range, the sites S234, V582, IRAS 05220+3455, and IRAS 05231+3512 are spatially seen in the infrared images. Based on the existing distance estimates (e.g. Marco & Negueruela, 2016) and our molecular line data analysis, we find that these sites are not part of the same physical system (see also Section 4.1). Using the Herschel sub-mm continuum images, we have identified at least five filamentary features (ff1, ff2, ff3, ns1, and ns2) toward l = 171.7 – 174.1. The site IRAS 05231+3512 is found to be embedded in the filament ff1, while the filament ff2 contains the sites V582 and IRAS 05220+3455. In the site S234, two embedded filaments (i.e. ns1 and ns2) are investigated in the direction of previously known nebulous stream feature. One can note that in the literature, there is no estimate of the distance of the site IRAS 05231+3512. However, in this work, we have used the distance of 1.3 kpc to the IRAS site. As highlighted earlier, the sites IRAS 05231+3512 (Vlsr 6 km s-1) and IRAS 05220+3455 (Vlsr 10 km s-1; d = 1.3 kpc) do not belong to a single system (see Section 3.1). Hence, it is possible that the site IRAS 05231+3512 could be located at a distance ranging from 1.3 to 2.0 kpc. This distance range can supported with the fact that there is another nearby open cluster NGC 1907 (l = 172.6; b = +0.3; Vlsr 0.1) located at a distance of 1.8 kpc (e.g., Marco & Negueruela, 2016).
In order to study the filaments, the observed line masses of filaments are computed, and are compared with a critical line mass in an equilibrium state. As discussed in Section 3.2, the line mass of an infinite and isolated cylinder in equilibrium between thermal and gravitational pressures can be determined using a given temperature value (e.g. Ostriker, 1964). The thermally supercritical filaments follow a condition , whereas thermally subcritical filaments agree with a condition . The supercritical filaments can collapse radially perpendicular to the main long axis of the filaments. In this context, gravitational fragmentation is one of the important physical processes to explain the observed clumps in filaments (e.g. Ostriker, 1964; Inutsuka & Miyama, 1997; Hartmann, 2002; Arzoumanian et al., 2013; André et al., 2014; Kainulainen et al., 2016; Williams et al., 2018). With the help of the Herschel column density and temperature maps, the features ff1, ff2, ff3, ns1, and ns2 are consistent with the condition of thermally supercritical filaments. In recent years, researchers are also trying to explore embedded filaments at an early stage of fragmentation, where star formation activities are not yet started or there is very little sign of ongoing star formation (e.g. Kainulainen et al., 2016). Such filaments may preserve the initial conditions of gravitational fragmentation. A comparison study of YSOs against clumps in filaments can provide an important clue to assess different evolutionary stages of filaments. More detailed discussion concerning star formation in the thermally supercritical filaments is presented in Sections 4.3 and 4.4.
4.3. Star formation scenario in the sites V582, IRAS 05220+3455, and IRAS 05231+3512
In the 1.17 0.81 area of V582, three filaments ff1, ff2, and ff3 are identified, and are classified as thermally supercritical. The column density map has shown the existence of condensations/clumps in these filaments. Hence, radial collapse scenario appears to be operated in these filaments. We have found less number of infrared-excess sources in the two filaments ff1 and ff3, where the radio continuum emission is also not detected. It implies that the filament ff1 harboring IRAS 05231+3512 may be very young, and seems to be located toward the Galactic southern edge of the extended molecular structure (see Figures 17a and 17b). Hence, considering the distance uncertainty of this IRAS site (see Section 4.2) and the age of the young SNR (see Section 4.1), the formation of the filament ff1 could be influenced by the SNR shock. In Figure 5b, the observed velocity gradients along the filament ff1 appear to indicate the accretion in the filamentary cloud (e.g. Vázquez-Semadeni et al., 2009; Arzoumanian et al., 2013), however protostellar feedback cannot be completely ignored for the velocity gradient in the filament ff1. In the thermally supercritical filament ff2, a group of YSOs is seen around IRAS 05220+3455, and a cluster of YSOs and at least five radio continuum peaks are also observed toward the site V582. The associated cometary globules and bright-rimmed clouds with the site V582 are seen at one end of ff2. Recently, Kun et al. (2017) suggested that star formation in the nearby environment of V582 might be triggered by the radiation field of a few hot members of Aur OB1 (i.e. HD 35633 or LS V +3423). However, Marco & Negueruela (2016) found the object HD 35633 as the main powering source for the site S234. Hence, star formation in the site V582 cannot be affected by the object HD 35633. Considering the feedback of massive stars, the presence of massive B type stars may be responsible for the bright-rim clouds and cometary globules in the site V582.
Based on the number of detected YSOs in the three filaments (see Section 3.2), we suggest that the filaments ff1–ff3 and ff2 represent two different evolutionary stages. The filament ff2 appears more evolved compared to other two filaments. Taking into account the existence of the supercritical filaments, our results favour the onset of radial collapse process in the filaments ff1, ff2, and ff3.
4.4. Star formation scenario in the site S234
In Section 3.3, we studied the molecular cloud associated with the site S234 in velocities of [17.75, 10] km s-1, which hosts the nebulous stream, dust shell, young open cluster Stock 8, and dust condensations. Several OB stars were reported in the cluster Stock 8 by Marco & Negueruela (2016). Marco & Negueruela (2016) found the object LS V +3423/HD 35633 as the main exciting source for S234 (see the position of this object in Figure 18). The GMRT radio continuum emission at 610 MHz is detected toward the dust shell, Stock 8, and dust condensations.
Earlier works suggested an age of 4–6 Myr for the open cluster Stock 8 (e.g. Marco & Negueruela, 2016), and the lifetime of star formation in the nebulous stream was reported to be 1 Myr (e.g. Jose et al., 2008). Jose et al. (2008) argued that stars in Stock 8 represent second generation star formation activity, which was triggered by the first-generation stars in the site S234. The nebulous stream was classified as an active region of recent star formation, where the small obscured cluster CC 14 and a significant number of YSOs were identified (e.g. Jose et al., 2008; Marco & Negueruela, 2016). It was suggested that the ionizing feedback of OB stars in the Stock 8 (and the first-generation stars) has not reached the nebulous stream. Hence, these OB stars may not influence the star formation in the nebulous stream (e.g. Jose et al., 2008). The nebulous stream was characterized as a bright rim or an ionization front, and was excited by a massive O type star (i.e. BD +341058) in the site S234 (e.g. Jose et al., 2008). They suggested that this source was not part of the Stock 8 and the first-generation stars (see the position of this source in Figure 18).
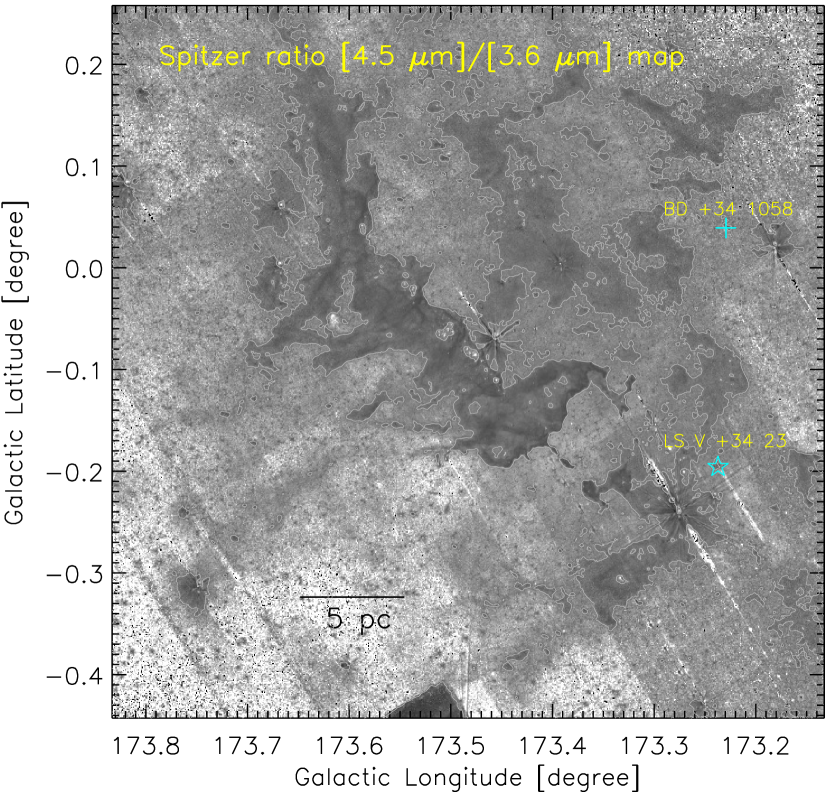
In this work, we have identified two thermally supercritical filaments ns1 and ns2 toward the nebulous stream (see Section 3.3.3). The 8.9 pc long filament ns1 (at Td 19 K) is identified as the most interesting feature in the site S234, and is surrounded by an extended temperature structure at Td = 27-30 K. The observed temperature structure can be explained by the heating from the massive OB stars in the site S234. We find that molecular gas in the filament ns1 (around 13 km s-1) is red-shifted with respect to the molecular gas in other features in the site S234 (around 15 km s-1). It implies that the filament ns1 appears away from the other features in the site S234. Additionally, the filament ns1 is relatively more denser region in the molecular cloud associated with the site S234. Because of these reasons, the pre-existing molecular gas in the filament ns1 is not destroyed by the feedback of massive OB stars in the site S234. But at the same, the filament also seems to be influenced by these massive stars (see Figure 18). In Figure 18, we present the Spitzer-IRAC ratio map of 4.5 m/3.6 m emission in the direction of the site S234. As discussed in Section 3.2, the dark or gray regions in the ratio map help us to trace the PDRs in the site S234, suggesting the impact of massive stars in their surroundings.
The supercritical filament ns1 contains three clumps, which further hosts at least four condensations. These condensations are distributed along the filament. The intense star formation activity (having SFE 3.3% and SFR 40–20 M⊙ Myr-1) is traced in the filament ns1. Furthermore, the thermally supercritical filament ns1 is also supersonic. In Section 3.3.5, we find for the filament ns1. It indicates that the feedback of massive stars as an external agent may provide the necessary support to the filament ns1 against the turbulence, and may be responsible for the intense star formation activities in the filament. It is also favoured by the presence of the observed age gradient in the site S234. More recently, Xu et al. (2018) also found similar results in the filamentary molecular cloud G47.06+0.26. Our interpretation is in agreement with the radiation-driven implosion (RDI; see Bertoldi, 1989; Lefloch & Lazareff, 1994) process, where the expanding ionized region initiates the instability and helps for collapsing the pre-existing dense regions in a given molecular cloud.
On the other hand, no star formation is seen in the thermally supercritical filament ns2 containing three Herschel clumps. Hence, the filament ns2 seems to be at an early stage of fragmentation. To obtain more insights into the physical conditions of the filaments, our multi-wavelength data analysis demands the high density tracer and high resolution molecular line observations for the site S234.
5. Summary and Conclusions
Using a multi-wavelength approach, we present an extensive study of star-forming sites,
IRAS 05231+3512, IRAS 05220+3455, V582, and S234 located toward l = 171.7 – 174.1; b = 0.6 – 0.52. The goal of the present work is to understand the ongoing physical processes in these sites. The major results of this paper are:
The molecular clouds associated with the sites S234, IRAS 05231+3512, and V582 are traced in the velocity ranges of [17.75, 10] km s-1, [8.5, 1] km s-1,
and [12.5, 7.5] km s-1, respectively.
Based on the observed radial velocities and available distance estimates,
we find that these three sites do not belong to a single physical system.
Based on the Herschel data of the 1.17 0.81
area of V582, at least three filamentary features (i.e. ff1 (length 9.5 pc; mass 355 M⊙), ff2 (length 12.7 pc; mass 362 M⊙), and ff3 (length 6.9 pc; mass 182 M⊙)) are identified with temperatures of 14–18 K.
The feature ff1 hosts IRAS 05231+3512, while other two sites IRAS 05220+3455 and V582 are
embedded in the feature ff2.
With the help of the CO line data, the sites IRAS 05220+3455 and V582 are found to be physically linked,
and are not associated with the site IRAS 05231+3512.
The observed line masses of the filaments ff1, ff2, and ff3 are derived to be 37, 28, and 26 M⊙ pc-1, respectively, which exceed the expected critical line mass at T = 10–15 K (i.e. Mline,crit = 16–24 M⊙ pc-1). Hence, the features ff1, ff2, and ff3 can be characterized as thermally supercritical filaments.
The NVSS radio continuum emission at 1.4 GHz is not observed toward
the filaments ff1 and ff3, where a very little star formation activity is found.
In the filament ff2, a group of YSOs and massive B type stars are depicted toward the site V582, and a cluster of YSOs is also seen around IRAS 05220+3455.
The cometary globules and bright-rimmed clouds linked with the site V582 are found
at one corner of the filament ff2, and can be explained by the feedback of massive B type stars.
In the site S234, using the molecular line data, the features ns1, ns2, dust shell, and dust condensation are physically connected in the velocity range of [17.75, 10] km s-1. However, the molecular gas in the filament ns1 is red-shifted (peaking around 13 km s-1) with respect to other molecular features (peaking around 15 km s-1) in the site.
In the site S234, two features (i.e. ns1 (length 8.9 pc; mass 1154 M⊙; dust temperature 19 K; 130 M⊙ pc-1) and ns2 (length 8.7 pc; mass 392 M⊙; dust temperature 19 K; 45 M⊙ pc-1)) are investigated as thermally supercritical filaments, and host several dust clumps.
The Herschel temperature map reveals the filament ns1 around Td 19 K surrounded by an extended temperature structure at 27-30 K. The ratio of / (i.e. Mach number) for the filament ns1 is computed to be 3, indicating that the thermally supercritical filament ns1 is supersonic. Taking into account the turbulence, our analysis reveals (320 M⊙ pc-1) (130 M⊙ pc-1) for the filament ns1.
At least four condensations (Mclump 70–300 M⊙) are observed in the filament ns1, and are not associated with the GMRT 610 MHz continuum emission.
The filament ns2 displays almost no star formation activity, indicating at an early stage of fragmentation.
An intense star formation activity is observed in the filament ns1, where both the Class I and Class II YSOs are identified.
In the filament ns1, the star formation efficiency and the star formation rate are estimated to be 3.3% and 40–20 M⊙ Myr-1 (for 1–2 Myr timescale), respectively.
Considering the existence of the thermally supercritical filaments in our selected longitude range l = 171.7 – 174.1, our results suggest the onset of radial collapse process in the filaments ns2, ff1, ff2, and ff3. At least three filaments ff1, ff3, and ns2 appear to be at an early stage of fragmentation, while the filaments ff2 and ns1 are associated with the ongoing star formation activities. In the site S234, our observational outcomes favour the triggered star formation in the filament ns1. Together, different evolutionary stages of the filaments are investigated toward l = 171.7 – 174.1.

References
- Ábrahám et al. (2018) Ábrahám, P., Kóspál, Á., Kun, M. et al. 2018, 853, 28
- André et al. (2010) André, P., Men’shchikov, A., Bontemps, S., et al. 2010, A&A, 518, L102
- André et al. (2014) André, P., Di Francesco, J., Ward-Thompson, D., et al. 2014, in Protostars and Planets VI, ed. H. Beuther et al. (Tucson, AZ; Univ. Arizona Press), 27
- Arzoumanian et al. (2013) Arzoumanian D., André P., Peretto N., Könyves V., 2013, A&A, 553, 119
- Baug et al. (2015) Baug, T., Ojha, D. K., Dewangan, L. K., et al. 2015, MNRAS, 454, 4335
- Bertoldi (1989) Bertoldi, F. 1989, ApJ, 346, 735
- Blitz et al. (1982) Blitz, L., Fich, M., & Stark, A. A. 1982, ApJS, 49, 183
- Bohlin et al. (1978) Bohlin, R. C., Savage, B. D., & Drake, J. F. 1978, ApJ, 224, 13233
- Brunt (2004) Brunt C., 2004, in Clemens D., Shah R., Brainerd T., eds, Proc. of ASP Conference 317. Milky Way Surveys: The Structure and Evolution of our Galaxy, p. 79
- Chabrier (2003) Chabrier, G. 2003, PASP, 115, 763
- Churchwell et al. (2006) Churchwell, E., Povich, M. S., Allen, D., et al. 2006, ApJ, 649, 759
- Condon et al. (1998) Condon, J. J., Cotton, W. D., Greisen, E. W., et al. 1998, AJ, 115, 1693
- Deharveng et al. (2010) Deharveng, L., Schuller, F., Anderson, L. D., et al. 2010, A&A, 523, 6
- Dewangan et al. (2015) Dewangan, L. K., Luna, A., Ojha, D. K., et al. 2015, ApJ, 811, 79
- Dewangan et al. (2016a) Dewangan, L. K., Ojha, D. K., Luna, A., et al. 2016a, ApJ, 819, 66
- Dewangan et al. (2016b) Dewangan, L. K., Ojha, D. K., Zinchenko, I., et al. 2016b, ApJ, 833, 246
- Dewangan et al. (2017a) Dewangan, L. K., Ojha, D. K., Zinchenko, I., Janardhan, P., & Luna, A. 2017a, ApJ, 834, 22
- Dewangan et al. (2017b) Dewangan, L. K., Ojha, D. K., & Baug, T. 2017b, ApJ, 844, 15
- Dewangan et al. (2017c) Dewangan, L. K., Baug, T., Ojha, D. K., Janardhan, P., Devaraj, R., & Luna, A. 2017c, ApJ, 845, 34
- Dewangan et al. (2017d) Dewangan, L. K., Devaraj, R., Baug, T., & Ojha, D. K. 2017d, ApJ, 848, 51
- Dewangan et al. (2017e) Dewangan, L. K., Ojha, D. K., & Zinchenko, I. 2017e, ApJ, 851, 140
- Drew et al. (2005) Drew, J. E., Greimel, R., Irwin, M.J., et al. 2005, MNRAS, 362, 753
- Evans et al. (2009) Evans, N. J., II, Dunham, M. M., Jørgensen, J. K., et al. 2009, ApJS, 181, 321
- Flaherty et al. (2007) Flaherty, K. M., Pipher, J. L., Megeath, S. T., et al. 2007, ApJ, 663, 1069
- Gutermuth et al. (2009) Gutermuth R. A., Megeath S. T., Myers P. C., et al., 2009, ApJS, 184, 18
- Hartmann (2002) Hartmann, L. 2002, ApJ, 578, 914
- Heyer et al. (1996) Heyer, M. H., Carpenter, J. M., & Ladd, E. F. 1996, ApJ, 463, 630
- Heyer et al. (1998) Heyer, M., Brunt, C., Snell, R., et al. 1998, ApJS, 115, 241
- Inutsuka & Miyama (1997) Inutsuka, S. & Miyama, S. M. 1997, ApJ, 480, 681
- Jose et al. (2008) Jose, J., Pandey, A. K., Ojha, D. K., et al. 2008, MNRAS, 384, 1675
- Kainulainen et al. (2016) Kainulainen J., Hacar A., Alves J., et al., 2016, A&A, 586, 27
- Kang et al. (2012) Kang, Ji-hyun, Koo, Bon-Chul, & Salter, C. 2012, AJ, 143, 75
- Kirsanova et al. (2014) Kirsanova, M. S., Wiebe, D. S., Sobolev, A. M., Henkel, C., & Tsivilev, A. P. 2014 MNRAS, 437, 1593
- Kirsanova et al. (2017) Kirsanova, M. S., Salii, S. V., Sobolev, A. M., et al., 2017 OAst, 26, 99
- Kun et al. (2017) Kun, M., Szegedi-Elek, E., & Reipurth, B. 2017, MNRAS, 468, 2325
- Lada et al. (2003) Lada, C. J., Bergin, E. A., Alves, J. F., & Huard, T. L. 2003, ApJ, 586, 286
- Lawrence et al. (2007) Lawrence, A., Warren, S. J., Almaini, O., et al. 2007, MNRAS, 379, 1599
- Lefloch & Lazareff (1994) Lefloch, B., & Lazareff, B. 1994, A&A, 289, 559
- Mallick et al. (2012) Mallick, K. K., Ojha, D. K., Samal, M. R., et al. 2012, ApJ, 759, 48
- Mallick et al. (2013) Mallick, K. K., Kumar, M. S. N., Ojha, D. K., et al. 2013, ApJ, 779, 113
- Mallick et al. (2015) Mallick, K. K., Ojha, D. K., Tamura, M., et al. 2015, MNRAS, 447, 2307
- Marco & Negueruela (2016) Marco, A., & Negueruela, I. 2016, MNRAS, 459, 880
- Molinari et al. (2010) Molinari, S., Swinyard, B., Bally, J., et al., 2010, A&A, 518, L100
- Myers (2009) Myers, P. C. 2009, ApJ, 700, 1609
- Omar et al. (2002) Omar, A., Chengalur, J. N., & Anish Roshi, D. 2002, A&A, 395, 227
- Ostriker (1964) Ostriker, J. 1964, ApJ, 140, 1056
- Panagia (1973) Panagia, N. 1973, AJ, 78, 929
- Pandey et al. (2013) Pandey, A. K., Eswaraiah, C., Sharma, S., et al. 2013, ApJ, 764, 172
- Schneider et al. (2012) Schneider, N., Csengeri, T., Hennemann, M., et al. 2012, A&A, 540, L11
- Skrutskie et al. (2006) Skrutskie, M. F., Cutri, R. M., Stiening, R., et al. 2006, AJ, 131, 1163
- Tan et al. (2014) Tan, J. C., Beltrán, M. T., Caselli, P., et al. 2014, in Protostars and Planets VI, ed. H. Beuther et al. (Tucson, AZ: Univ. Arizona Press), 149
- Vázquez-Semadeni et al. (2009) Vázquez-Semadeni, E., Gómez, G. C., Jappsen, A.-K., Ballesteros-Paredes, J., & Klessen, R. S. 2009, ApJ, 707, 1023
- Whitney et al. (2011) Whitney, B., Benjamin, R., Meade, M., et al. 2011, BAAS, 43, 241.16
- Williams et al. (2018) Williams, G. M., Peretto, N., Avison, A., Duarte-Cabral, A., & Fuller, G. 2018 arXiv:1801.07253
- Wright et al. (2010) Wright, E. L., Eisenhardt, P. R. M., Mainzer, A. K., et al. 2010, AJ, 140, 1868
- Xu et al. (2018) Xu, Jin-Long, Xu, Y., Zhang, Chuan-Peng, et al. 2018, A&A, 609, 43
- Zinnecker & Yorke (2007) Zinnecker, H., & Yorke, H. W. 2007, ARA&A, 45, 481
| ID | l | b | Sν | log | Spectral Type | |
|---|---|---|---|---|---|---|
| [degree] | [degree] | (pc) | (in Jy) | (s-1) | ||
| 1 | 173.389 | 0.155 | 5.30 | 1.613 | 47.96 | B0V-O9.5V |
| 2 | 173.339 | 0.209 | 0.65 | 0.129 | 46.86 | B0.5V-B0V |
| 3 | 173.440 | 0.192 | 0.35 | 0.035 | 46.30 | B1V-B0.5V |
| 4 | 173.451 | 0.126 | 0.30 | 0.026 | 46.15 | B1V-B0.5V |
| 5 | 173.385 | 0.030 | 0.20 | 0.056 | 46.50 | B0.5V |
| ID | l | b | Rc | Mclump |
|---|---|---|---|---|
| [degree] | [degree] | (pc) | () | |
| 1 | 173.635 | 0.142 | 1.1 | 60 |
| 2 | 173.623 | 0.088 | 1.6 | 178 |
| 3 | 173.604 | 0.002 | 1.5 | 154 |
| 4 | 173.542 | -0.025 | 1.7 | 365 |
| 5 | 173.507 | -0.068 | 1.8 | 593 |
| 6 | 173.460 | -0.114 | 1.3 | 196 |
| 7 | 173.410 | -0.110 | 1.0 | 85 |
| 8 | 173.375 | -0.118 | 0.9 | 42 |
| 9 | 173.394 | -0.145 | 1.3 | 119 |
| 10 | 173.445 | -0.196 | 0.9 | 39 |
| 11 | 173.464 | -0.161 | 1.2 | 83 |
| 12 | 173.390 | -0.013 | 1.8 | 154 |
| 13 | 173.316 | -0.025 | 1.1 | 63 |
| 14 | 173.273 | -0.064 | 0.5 | 10 |
| 15 | 173.273 | -0.110 | 1.0 | 48 |
| 16 | 173.246 | -0.126 | 0.9 | 38 |
| 17 | 173.266 | -0.173 | 1.2 | 85 |
| 18 | 173.223 | -0.208 | 0.5 | 13 |
| 19 | 173.262 | -0.204 | 1.3 | 100 |
| 20 | 173.312 | -0.254 | 1.5 | 100 |
| 21 | 173.332 | -0.215 | 1.0 | 72 |
| 22 | 173.367 | -0.219 | 0.8 | 40 |
| 23 | 173.336 | -0.313 | 1.9 | 323 |
| 24 | 173.386 | -0.336 | 1.9 | 185 |
| 25 | 173.472 | -0.309 | 1.7 | 142 |
| 26 | 173.690 | -0.227 | 0.5 | 13 |
| 27 | 173.701 | -0.266 | 0.7 | 20 |
| 28 | 173.725 | -0.266 | 1.1 | 58 |
| 29 | 173.690 | -0.359 | 1.1 | 73 |
| 30 | 173.662 | -0.383 | 0.7 | 24 |
| 31 | 173.305 | 0.033 | 0.9 | 35 |
| 32 | 173.410 | 0.166 | 0.6 | 15 |