The low detection rate of pair instability supernovae and the effect of the core carbon fraction
Abstract
The pair instability supernova (PISN) is a common fate of very massive stars (VMSs). Current theory predicts the initial and the CO core mass ranges for PISNe of 140–260 and 65–120 respectively for stars that are not much affected by the wind mass loss. The corresponding relative event rate between PISNe and core collapse supernovae is estimated to be 1% for the present-day initial mass function. However, no confident PISN candidate has been detected so far, despite more than 1,000 supernovae are discovered every recent years. We investigate the evolution of VMSs with various core carbon-to-oxygen ratios for the first time, by introducing a multiplication factor to the 12C()16O reaction rate. We find that a less massive VMS with a high (C)/(O) develops shell convection during the core carbon-burning phase, with which the star avoids the pair-creation instability. The second result is the high explodability for a massive VMS, i.e., a star with high (C)/(O) explodes with a smaller explosion energy. Consequently, the initial and the CO core mass ranges for PISNe are significantly increased. Finally, a PISN with high (C)/(O) yields smaller amount of 56Ni. Therefore, PISNe with high (C)/(O) are much rarer and fainter to be detected. This result advances the first theory to decrease the PISN event rate by directly shifting the CO core mass range.
1 Introduction
The pair instability supernova (PISN) is known as a common fate of very massive stars (VMSs)111Very massive stars with the initial mass of are conventionally called as VMSs (e.g., Vink et al., 2015). that develop massive CO cores during the evolution (Barkat et al., 1967; Rakavy et al., 1967). In the massive CO core, the pair creation reaction effectively takes place, converting the thermal energy into the rest mass of pair and softening the pressure. As a consequence, the core becomes hydrodynamically unstable and initiates accelerating core contraction, or, core collapse. In the collapsing core, nuclear reactions of carbon, neon, and oxygen burnings take place. If the nuclear reactions release large energy enough to explode the whole star, then the explosion called PISN takes place in the end. Indeed, hydrodynamical simulations in both 1D (e.g., Heger & Woosley, 2002; Umeda & Nomoto, 2002; Kozyreva et al., 2014a; Takahashi et al., 2016) and multi-D (Chatzopoulos et al., 2013; Chen et al., 2014) have resulted in successful explosions, confirming the robustness of the mechanism. The confident understanding of the explosion mechanism provides a strong motivation to search a PISN explosion in the real universe.
In spite of the robust theoretical prediction, existence of PISNe has not been observationally confirmed so far. The explosion of a PISN can be observed as a luminous supernova because of the large explosion energy and the large 56Ni yield (e.g. Kasen et al., 2011), while lower mass PISNe are expected to be dim (Kasen et al., 2011; Kozyreva et al., 2014a). Therefore a class of so-called super luminous supernovae (SLSNe), which shows a luminosity 10 or more times larger than that of a standard supernova, is a good candidate to be explained as a PISN event (Gal-Yam et al., 2009; Gal-Yam, 2012). However, no currently observed SLSNe match with theoretical predictions, which produce much broader light curves and more red colors than observations as a result of the intrinsically long diffusion timescale of the large ejecta masses (Dessart et al., 2012, 2013; Chatzopoulos et al., 2015; Kozyreva et al., 2014b, 2016, 2017). Besides existence of PISNe in the early universe has not been confirmed yet. Instead of the direct detection, PISN explosions in the early universe can be traced by observing surface chemical abundances of metal-poor stars (abundance profiling; Nomoto et al., 2013; Umeda & Nomoto, 2002). Although thousands of metal-poor stars have been observed until now, none of them show agreements with PISN characteristic abundances of low [Na/Mg]222A stellar abundance ratio is indicated by the solar scaled value of , where is the number density of the element and is the solar value. and high [Ca/Mg] (Takahashi et al., 2018).
Stellar evolution simulations of single nonrotating zerometallicity VMSs have estimated the mass range of CO cores for PISNe to be 65–120 and the corresponding initial mass range of 140–260 (Heger & Woosley, 2002; Takahashi et al., 2016). Assuming the Salpeter initial mass function (IMF) with a slope of , a relative number fraction of PISNe to core collapse supernovae (CCSNe) of 1% is estimated. The relative event rate between PISNe and CCSNe can not be directly related to the detection rate because these supernovae will have various luminosities and durations and supernova surveys are magnitude and volume limited. Nevertheless, provided that more than 1,000 of supernovae are discovered every year by the current supernova surveys (the “Latest Supernovae” website333http://www.rochesterastronomy.org/supernova.html; Gal-Yam et al. 2013, and references therein), the 1% relative event rate might be large enough for the PISN detection. Furthermore, the number of detection will be significantly increased after the operation start of upcoming surveys such as the Zwicky Transient Facility (ZTF444http://www.ztf.caltech.edu/, Bellm 2018) and the Large Synoptic Survey Telescope (LSST555https://www.lsst.org/, Ivezić et al. 2008).
If the PISN confident detection will not be achieved even by the upcoming surveys, it will imply that the actual event rate is well below 1% obtained by the present theory. One important uncertainty related to the event rate estimate is involved in the upper limiting mass for the star formation. If the limiting mass is below the lower end of the PISN mass range, no PISN takes place in the universe. However, the estimated initial mass of 140 for a PISN progenitor is not so much massive as regarded as unrealistic. A VMS with the initial mass of 320 has been observed in a star cluster R136 in the Large Magellanic Cloud (Crowther et al., 2010, 2016), and the upper limiting mass for the star formation in the cluster has been estimated to be 200 (Schneider et al., 2014), indicating that the formation of a VMS is possible for environments with finite metallicities. Apart from that, the star formation in the early universe has been investigated by cosmological ab-initio simulations. Because of the absence of efficient coolants in primordial gas clouds, zerometallicity stars are considered to be born with very massive initial masses of 100 (Hirano et al., 2014, 2015; Susa et al., 2014, and references therein).
The other big uncertainties are in the estimate of the initial mass range for PISNe. If the present theory has estimated the lower minimum initial mass for a PISN than the actual value, then it overestimates the event rate because a less massive star is more frequently formed under the present initial mass function. One of the relevant physics is the strong wind mass loss, and especially its metallicity dependence is of importance. Due to the strong wind during both the main sequence and the Walf-Rayet phases, a solar metallicity VMS of 500 will not become a PISN (Yusof et al., 2013; Yoshida et al., 2014). As the wind efficiency is reduced, a PISN mass range with the lower metallicity gets close to the zerometallicity estimate with no mass loss. Provided the big uncertainty of the metallicity dependence, the upper value of 1/3 for the critical metallicity, below which the same PISN mass range as the range for the zerometallicity model is obtained, is suggested in Langer et al. (2007). Meanwhile, the much higher value of 300 are obtained for the lower end of the PISN initial mass range for 1/5 stars in other works (Yoshida & Umeda, 2011; Yusof et al., 2013; Yoshida et al., 2014). Apart from the wind mass loss, binary mass transfer can reduce the mass of the primary and increase the mass of the secondary stars. Strong internal magnetic field may suppress the core convection to form a smaller mass CO core (Petermann et al., 2015), while strong surface magnetic field may suppress the wind mass loss and thus help to form a massive CO core on the contrary (Georgy et al., 2017). Also a CO core may be extended by the rotation induced mixing (Chatzopoulos & Wheeler, 2012a; Yoon et al., 2012). All of those mechanisms can shift the initial mass-CO core mass relation to affect the initial mass range for PISNe.
Most of the previous works have implicitly assumed that the CO core mass range of PISNe is well-determined, and in fact, less number of mechanisms have been suggested to shift the CO core mass range for PISNe upward. Multidimensional turbulence that may appear during core collapse and explosion will not affect the hydrodynamical evolution, since the growth timescale is merely comparable to the timescale of the overall hydrodynamical evolution, and indeed, multidimensional calculations have confirmed the PISN explosion (Chen et al., 2014). A fast rotation of a CO core will regulate the collapsing motion and may affect the CO core mass range for PISNe (c.f. Chatzopoulos et al., 2013; Chen, 2015). However, a large specific angular momentum of cm2 s-1 is required to affect the PISN explosion (Glatzel et al., 1985). Considering the infrequency of the long gamma ray burst, the progenitor of which is estimated to have a similar or smaller specific angular momentum of cm2 s-1 to fulfill the constraints of the collapsar model (Woosley, 1993; Yoon & Langer, 2005; Woosley & Heger, 2006), it will be unreasonable to consider majority of VMSs form fast rotating CO cores in the end. Progenitor structures having an inflated envelope or not affect the explodability of the CO core, because they have different temperature structures at the outer region of the core (Takahashi et al., 2018) and a deflated envelope requires more momentum to be blown off (Kasen et al., 2011; Takahashi et al., 2016). However, the change of the initial mass range by the effect is 10 and not so significant.
In this work, we investigate the evolution of VMSs that form CO cores with various carbon-to-oxygen ratios, and report the evolutionary consequences that significantly affect the CO core mass range for PISNe for the first time. By introducing a multiplication factor to the 12C()16O reaction rate of Caughlan & Fowler (1988), CO cores with 0.15–3.1 are developed. In the next section, firstly we provide the information of the stellar evolution code and a short discussion on the 12C()16O reaction rate, then the results of VMS evolutions are discussed. For more massive models, the later hydrodynamic evolution is calculated by a 1D hydrodynamic code. The code description is given in the first subsection in section 3., and the results are discussed in the second subsection. Discussion of the event rate of PISNe and of the observational consequences is presented in section 4. Conclusion is given in the last section.
2 Stellar Evolution Calculation
2.1 Method
The stellar evolution of nonrotating zerometallicity VMSs is calculated from zero age main sequence (ZAMS) until central carbon depletion at least or until iron core formation. An initial mass of a model, , is taken from [120, 460] . The initial composition is determined based on the result of Big bang nucleosynthesis of Steigman (2007). Assuming all of the 2H has burned to form 3He before the ZAMS stage, mass fractions of 1H, 3He, and 4He of 0.7599, , and 0.2400 respectively, are applied.
Calculations have been done by a stellar evolution code described in Takahashi et al. (2016, 2018), which was developed originally by Japanese researchers (Saio et al., 1988). In order to treat a general massive star evolution, overall physical and numerical descriptions have been improved since then, including the introduction of the wind mass loss and a large reaction network (Yoshida & Umeda, 2011), the inertia term and the automatic mesh refinement scheme (Takahashi et al., 2013), and stellar rotation (Takahashi et al., 2014). The equation of state in the code includes four species of particles, photon, ions, electron, and positron. Photon is expressed as a blackbody radiation and ions are approximated as the Boltzmann gas. For the electron–positron part, the reaction equilibrium between pair creation and annihilation is assumed, and analytic formulae for general Fermi-Dirac integrals are applied (Blinnikov et al., 1996). The convective overshooting is taken into account for the core hydrogen- and helium-burning phases. An exponentially decaying function is applied with the overshoot parameter of , with which a non-rotating solar metallicity models can account for the wide MS width observed for AB type stars in open clusters in our galaxy (Maeder & Meynet, 1989).
A nuclear reaction network with 49 isotopes, which includes all of the major nuclear reactions affecting the concerned evolution, is incorporated in the stellar calculation. The reaction rates are taken from the current version of JINA REACLIB (Cyburt et al., 2010) except for the 12C()16O reaction.
2.2 The 12C(,)16O reaction rate
Together with the 3 reaction, the 12C(,)16O is an astrophysically important reaction, which determines the 12C/16O ratio in the universe. In a He core of a massive star, the reaction takes place with a typical center-of-mass energy of 300 keV, which results in a small cross section of barn. Since the cross section is far below the sensitivity of the current measurements, experimental data that are obtained at the higher energy range has to be extrapolated down to the astrophysically relevant energy range. However, at this higher energy, the cross sections are complicated by the interference from other excited states of 16O. To disentangle the experimental data and to conduct a reliable extrapolation, theoretical models such as the R-matrix theory (e.g. Azuma et al., 2010) are required. Due to these complications in both experiment and theory, the reaction rate has been still unsettled, despite numbers of investigations have been done over the years (c.f. deBoer et al., 2017, for a review).
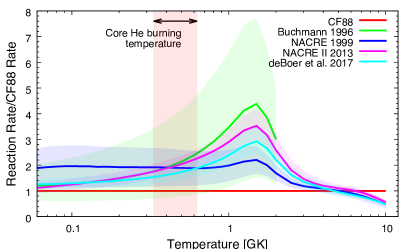
In Fig 1, the 12C(,)16O reaction rates presented in the literature are compared. In the relevant temperature range for core helium burning in a VMS of – K, a low value of is inside the uncertainty of the reaction rate of Buchmann (1996). On the other hand, the small reaction rate of Caughlan & Fowler (1988) is below the uncertainty ranges of more recent works (Angulo et al. 1999 (NACRE), Xu et al. 2013 (NACRE II), deBoer et al. 2017). Nevertheless, CO cores with various carbon-to-oxygen ratios are calculated by applying a multiplication factor to the reaction rate of 12C()16O of Caughlan & Fowler (1988) in this work. This is because the aim of this work is to display a new route in the massive star evolution that appears when the CO core has a high carbon-to-oxygen ratio. In addition to the small reaction rate, astrophysical origins such as additional mixing may account for the large carbon-to-oxygen ratio. Previous works have shown that the carbon-to-oxygen ratio in a CO cores is influenced by the convective overshooting (Imbriani et al., 2001) and by the rotation induced mixing (Chieffi & Limongi, 2013).
The 12C()16O reaction rate has also been inspected by calculating theoretical yields of CCSNe (Weaver & Woosley, 1993; Timmes et al., 1995; Woosley & Heger, 2007; West et al., 2013; Austin et al., 2017). Because carbon-to-oxygen ratio affects the electron mole fractions at the end of the stellar evolution, the multiplier of the reaction rate has correlation and anti-correlation to even-Z and odd-Z elemental yields. The same trends have also been found in our calculations of 15 models, having the converging point at . Thus the upper value of is the one used in our conventional calculations. Since the resulting carbon-to-oxygen ratio of is small, we expect that the evolution applying is qualitatively similar to the one from pure oxygen cores. For the same reason, calculations with will represent calculations with higher . This is why we drop calculations with from this work, despite the larger reaction rate is more compatible with recent estimates.
2.3 Result
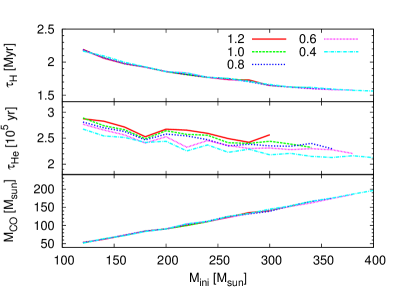
Until core carbon depletion, a zerometallicity VMS experiences core hydrogen- and helium-burning phases. In Fig. 2, durations of these phases, and , and resulting CO core masses, , which is defined as the innermost mass coordinate where helium mass fraction exceeds , are shown as functions of the initial mass, , for selected sequences of . The duration of the hydrogen-burning phase is independent666Actually, tiny differences in are seen for models with the same initial masses. However, these differences should not have a physical significance but have a numerical origin. The different affects the evolution of a zerometallicity VMS during the pre-ZAMS He burning phase. This difference is enhanced through the evolution of the convective regions around the H burning core, because the convective evolution is significantly sensitive to any kind of numerical errors. Finally, the merging of shell- and central convections takes place during the core hydrogen-burning phase in some models, causing the different .
of but depends on the initial mass, because the 12C(,)16O reaction is irrelevant to the hydrogen burning. On the other hand, models with smaller tend to have slightly shorter helium burning phases for models with the same initial masses. The CO core mass is again independent from . This is because the size of the convective core is nearly constant during the helium-burning phase.
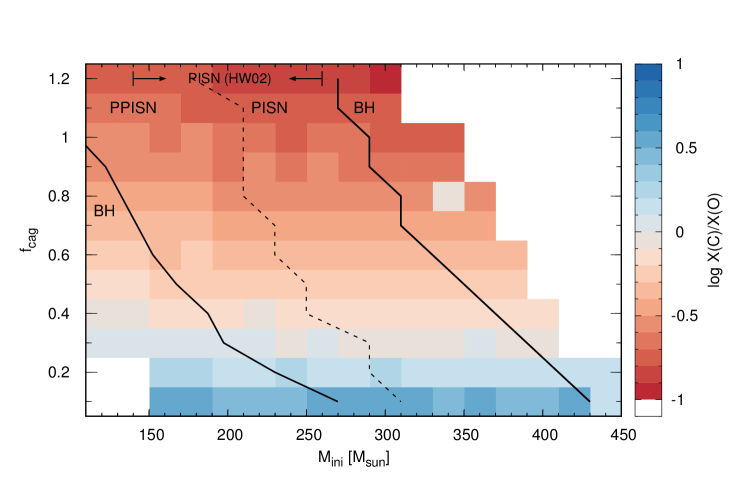
Hence, the most relevant consequence from applying different is the different carbon-to-oxygen ratio in the same mass CO core. The central measured when the central temperature reaches is shown by a color map in Fig.3. The phase space is divided into 4 regions according to the fate of the model, while the definition of each boundary is explained later. Also, the initial mass range of PISNe indicated by Heger & Woosley (2002) is shown. The color map shows that models with small have high . More massive models tend to have less , however, the mass dependency is much weaker than the dependency. Thus, models with have the lowest , models with the intermediate have , and models with have the highest .
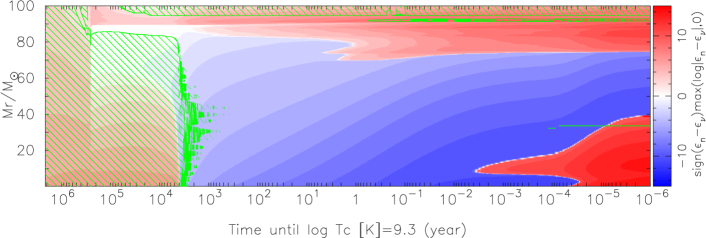
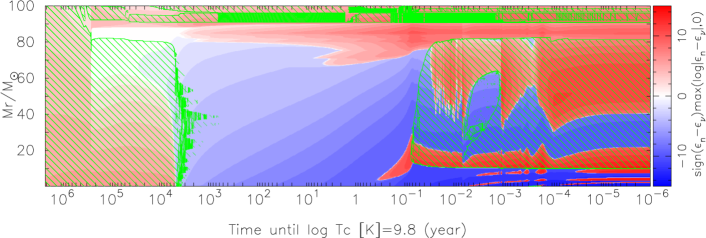
We have found that, due to the high core carbon fraction, less massive models with small develop shell convection during the core carbon-burning phase. The thick solid line passing from 110 at to 270 at in Fig. 3 is the upper boundary of models that experience this convective shell formation. Figure 4 shows the evolution of convective regions for models of with different 1.2 (top panel) and 0.3 (bottom panel). No convection develops for the case, which has a small of 0.18. On the other hand, a large shell convective region appears at from yr before the calculation end for the case, which has 5.7 times larger ratio of 1.04.
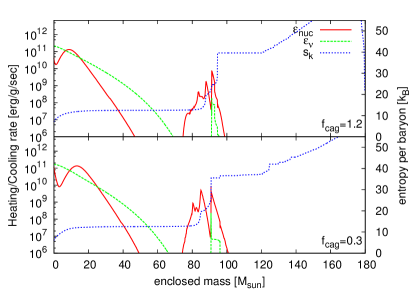
In general, a CO core material easily becomes convectively unstable if a certain amount of heating takes place in the shell region. This is because a newly-formed CO core in a VMS has nearly homogeneous distributions of entropy and chemical composition as a result of the effective mixing during the previous core helium-burning phase. In addition, neutrino cooling, which triggers the further core evolution by reducing the core entropy, is dominated to occur in the central region of the core. Therefore, the isentropic structure in the surrounding region remains. Figure 5 shows distributions of heating and cooling rates and the entropy for the two models when the central temperatures become . The figure shows that the model has a shell region at – where the nuclear heating rate significantly exceeds the neutrino cooling rate. This net heating soon creates a negative entropy gradient and drives shell convection at that region. On the other hand, the nuclear heating rate is only slightly larger than the neutrino cooling rate in the model. Except for the carbon depleted central region, the heatings are solely caused by the reaction. Therefore, the heating rate is proportional to the the square of the carbon mass fraction. Given the similar core entropies the lower heating rate is explained by the lower core carbon fraction. Finally no convection appears in this model until core collapse sets in.
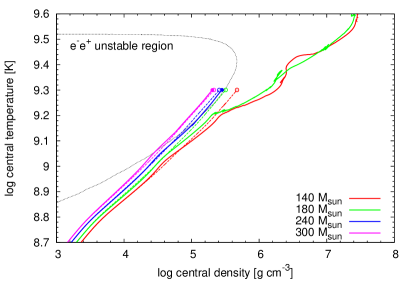
The evolution of central density and temperature is shown in Fig. 6 for selected models. All of the models with , shown by dashed lines, are nonconvective. For models with shown by solid lines, less massive models with develop shell convection during the core carbon-burning phase, while more massive models are nonconvective. It is evident that those convective models offset to the lower entropy side, i.e., the higher density for the same temperature, when the central temperatures reach . The branching moments are exactly when the shell convections develop in the cores. Thus, due to the emergence of the shell convective regions, the effective core masses of the convective models are reduced. And due to the effective neutrino cooling, the central entropies rapidly decrease to match with the new core masses. As a consequence, the low entropy core avoids being affected by the pair-creation instability. No dynamical collapse or energetic pulsations take place for the convective models. The two convective models shown in the Fig. 6 form hydrostatic iron cores in the end.
Based on the result, we estimate that the formation of a stellar mass black hole (BH), instead of the explosion as a PISN, is the fate of convective models. Therefore, the minimum mass to be affected by the pair creation instability is significantly shifted upward, for example, for models with and (C)/(O) and for models with and (C)/(O) . Note that weak pulsations possibly appear in the outer region of the CO core in reality, which are dumped in a time-implicit evolutionary calculation with a long time step. Although the nonlinear coupling with carbon burning may trigger mass ejection and further affect the evolution, this is beyond the scope of this work.
3 Hydrodynamic Calculation
3.1 Method
After the central carbon depletion, nonconvective models with more massive initial masses of are affected by the pair creation instability. The late hydrodynamic evolution is calculated by a general relativistic hydrodynamic code described in Yamada (1997). A result at log [K] calculated by the stellar evolution calculation is used for the initial structure. Except for the small reaction network with reduced 49 isotopes, which is identical to the evolution calculation in this work, the code settings are the same as in Takahashi et al. (2016, 2018). The equation of state, the local neutrino cooling rate, and the reaction network are imported from the stellar evolution code (Takahashi et al., 2016).
Chemical mixing and energy transport by convection are not considered in the hydrodynamic code. The code thus has no capability to model the Rayleigh-Taylor (RT) instability developing at the core-envelope interface associated with the reverse shock, which may affect the efficiency of the fallback and thus the bounding mass between pulsationall-PISNe and PISNe. However, no major instabilities will be developed during the neon and oxygen burning phases, and therefore the explosion of PISNe will not be affected by the omission of convection. Chen et al. (2014) has shown that only a mild instability grows by the oxygen burning in their 2D simulations. This can be understood as the growth time, which may be estimated as , where is the Brunt-Väisälä frequency, is sec at its minimum and is merely comparable to the timescale of core contraction and expansion around the turning point. Soon after the instability starts to grow, the core expands and the growth time will be significantly lengthened. Thus the instability is expected to freeze out for the further evolution, which is what observed in the 2D simulations.
3.2 Result
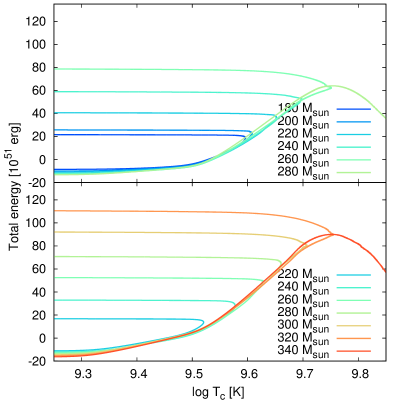
In Fig. 7, the evolution of the total energy, which is defined as , is shown as a function of the central temperature. Here, is the internal energy density including the rest mass of created electron-positron pair (for detailed information, see Takahashi et al., 2016) and and are the velocity and the radius of the mass shell at the enclosed baryon mass of .
Results of models with shown in the top panel are essentially the same as reported in Takahashi et al. (2016). During the contraction, the total energy firstly increases due to the neon burning that initiates when the central temperature reaches log [K] 9.3. However, the released energy is small and the star k-eps-converted-to.pdf contracting. Next, oxygen burning sets in after the central temperature reaches log [K] 9.5, significantly increasing the total energy. The star returns its contracting motion to expansion when the large enough energy is released by the reaction. On the other hand, when the released energy is insufficient and the central temperature reaches log [K] 9.75, the next important reaction of the photodisintegration initiates. Because this reaction converts the internal energy into rest mass of nuclei, the total energy defined above rapidly decreases. Empirical results obtained by Takahashi et al. (2016) show that the star finally collapses to form a BH if the central temperature exceeds log [K] 9.8.
The second panel shows the total energy evolution of models with . The basic picture discussed for models with is still applicable to other cases with . I.e., important temperatures of [K] 9.3, 9.5, and 9.8 divide the hydrodynamic evolution into four phases. On the other hand, the figure also shows that the inclination of energy increase during the neon-burning phase becomes steeper than the case of . This is because a model with has a higher core neon fraction. Neon is the prime product of the carbon burning of
so that the high core carbon fraction before the core carbon-burning phase results in the high core neon fraction after the core carbon depletion. Moreover, the neon burning in the surrounding region has a major contribution for the energy increase even after the central temperature reaches log [K] 9.5. Therefore, a low model with the same initial mass has a larger total energy for the same central temperature. As a consequence, a model with lower returns its contracting motion to explosion having a lower central temperature. In other words, models with lower are more easily explode than models with higher .
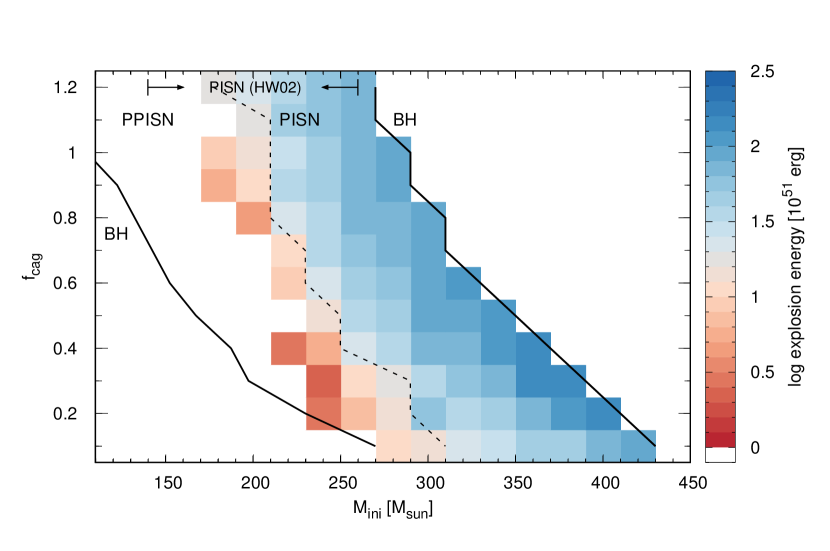
The phase diagram of the fate is again shown in Fig. 8 but with the color map showing the total energy after s from the start of the hydrodynamic calculation. Note that the total energies are shown only for models that have positive total energies after the core collapse. The thick solid line passing from 270 at to 430 at shows a boundary between progenitors of PISNe and BH formation. The definition is clear: whether the model returns the contracting motion or not.
The boundary between progenitors of pulsational PISNe (PPISNe) and PISNe is shown by another dashed line passing from 175 at to 310 at . Similar to PISNe, PPISNe are triggered by the pair creation instability. However, in this case, a central part of the star remains gravitationally bound after the expansion because of the smaller energy injection by the thermonuclear reactions (Woosley et al., 2007; Chatzopoulos & Wheeler, 2012b; Chen et al., 2014; Yoshida et al., 2016; Woosley, 2017). In this work, an expanding model is considered as a PPISN if the central mesh of the model restarts contraction after its first expansion during s from the start of the hydrodynamic calculation. The bounding mass at is larger than the results of Heger & Woosley (2002), however, this discrepancy will be well explained as hydrogen-rich envelopes are included in our calculation (Kasen et al., 2011; Takahashi et al., 2016). The central remnant of a PPISN is considered to restart hydrostatic evolution leading to the iron core collapse in the end. Because of the high masses, the fate of PPISN models are determined as BH formation.
The phase diagram clearly shows the strong dependence of the initial mass range of PISNe on the core carbon-to-oxygen ratio. With the highest , the models have small and have the lower shifted initial mass range of . The initial mass range becomes for models with the intermediate with , and the highest shifted mass range of results from models with the lowest which have the largest .
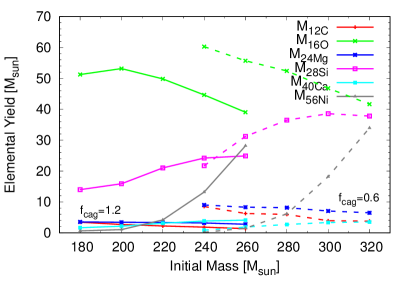
In spite of the very different initial mass ranges, the initial mass dependences of the explosion energy as well as the elemental yields are quite similar for models with different . The smallest explosion energy k-eps-converted-to.pdf – erg for a wide range of , although the initial mass spans a wide range of . And the largest explosion energy increases from erg to erg, while the initial mass increases from 260 for the models to 400 for the models. The yields of representative elements are shown in Fig. 9 for exploding models with and 0.6. It clearly shows the similar mass dependencies. As a result, models with the same mass but with different can produce totally different explosion energy and elemental yields. For example, 260 models have quite different 56Ni yields of 1.48 for the model with and 28.1 for the model with .
4 Discussion
4.1 PISN event rate
In order to demonstrate the impact of a larger mass range of PISN progenitors, we estimate the event rate of PISNe by applying a simple initial mass function (IMF) that is characterized by the slope () and the upper limiting mass () above which no star is born. A typical for low redshift PISNe will be the Salpeter value, = 2.35 (however, a small IMF slope of is recently obtained for a massive stellar cluster R136; Schneider et al. 2018). A flat value = 0 may be applicable for the IMF of zerometallicity stars (c.f. Hirano et al., 2014). For , while a low value of for finite metallicity stars has been rejected by the population synthesis for the cluster R136 (Schneider et al., 2014), the actual value is quite uncertain for both the low-redshift universe and the early universe (for example, the maximum mass for zero-metallicity stars is estimated as 300 in Susa et al. (2014) and 1000 in Hirano et al. (2015)). Therefore, massive values of are tested here as a free parameter.
Instead of the absolute value, a relative event rate of PISNe to a rate of CCSNe,
| (1) |
is calculated, in which the mass range of 10 to 20 is assumed for CCSN progenitors. The relative rate depends on through and , which are the minimum and the maximum masses for PISN progenitors, respectively.
Here we assume that the initial mass range for PISN progenitors only depends on and is independent especially from the metallicity of the star. This can be justified for low metallicity environments with (Langer et al., 2007), since a CO core formed in a star with the same initial mass has a nearly metallicity-independent mass unless the efficient wind mass loss significantly reduces the mass of the star. We does not take the effect of the envelope structure into account in this estimate. Whether the envelope of a VMS inflates or not affects the explodability and thus changes the initial mass range of the PISNe (e.g., Takahashi et al., 2018). However, the shift is and much less effective than the effect of core carbon fraction considered here.
Also we does not take the effect of the rotational induced mixing into consideration. This is because the efficiency of the rotational mixing is highly uncertain. Fast rotating VMSs in Chatzopoulos & Wheeler (2012a) form extended He cores, as a result, the lower and higher end of the PISN mass range shifts to lower masses. For example, their 95 model with 30% , where is the surface rotation velocity at the ZAMS phase, is the Kepler velocity, and is the Eddington factor, forms a 90 oxygen core, which has 40 higher mass than the nonrotating counterpart. On the other hand, a 100 model with 47% which also has km s-1 and 30% in Yoon et al. (2012) develops a 65.81 CO core, and a 85 model with km s-1 in Ekström et al. (2008) forms a 43.92 CO core. They are merely 13.88 and 9.42 larger than their nonrotating counterparts, respectively. Also in Takahashi et al. (2018), less effective enhancements of 5.80 and 2.29 are obtained in their 100 rotating models of 30% with and without the Tayler-Spruit dynamo.
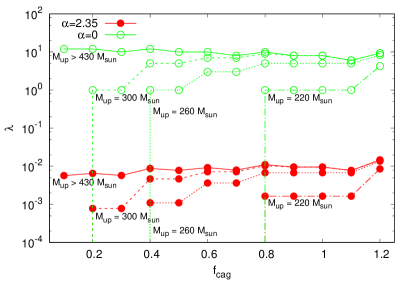
Results are shown in Fig. 10. Similar properties are deduced for both results of 2.35 and 0. If the upper limiting mass in the star formation is considerably large, say, , then the relative event rate is nearly independent from . This constant value becomes % for the Salpeter IMF case. Also, the relative rate only slightly depends on for case. On the other hand, the relative event rate shows a dependency for models with . In particular, no PISN progenitor is formed under the condition of small and small . Considering the big uncertainty in the current estimate of , we conclude that the combination of the small and the large carbon-to-oxygen ratio has a potential importance to explain the nondetection of PISNe.
4.2 Observational consequences
The luminosity of a PISN in the early phase will be powered by diffusion of the thermal energy that is deposited by the shock heating and the radioactive decay of 56Ni 56Co. The duration is determined by the diffusion time, which scales as , where , , and are the ejecta mass, the explosion energy, and the opacity, respectively (Arnett, 1980). As the opacity in a PISN is dominated by the electron scattering and thus (Kasen et al., 2011), the large ejecta mass of a PISN of results in a long diffusion time of day, which characterizes the PISN light curve. The peak luminosity during the diffusion phase will correlate with the explosion energy (c.f. Kasen et al., 2011). The late luminosity, which is explained by the 56Co decay, is estimated as (Arnett, 1979), where is the mass of the 56Co, which is originally ejected as 56Ni.
Therefore, a PISN can have a less luminous brightness, if the explosion energy and the ejected 56Ni mass are small. Indeed, the model R175 in Kasen et al. (2011), which is a 175 PISN model producing erg of the explosion energy and 0.70 of 56Ni, has a peak absolute R-band magnitude of and a fainter decay tail that are rather comparable to a normal Type IIP SNe. Our minimum mass PISN models for various will have similar observational properties to this R175 model, because they also have erg of the explosion energies and 56Ni yields. Therefore, the most important observational consequence of the high (C)/(O) is the more fainter PISN from the same mass progenitors. We expect that the low detectability of PISNe may be explained by the fainter luminosity of the VMS progenitors with higher (C)/(O).
Apart from the discussion on the low detectability, we discuss some possibilities to constrain the (C)/(O) in the real VMSs. For example, the core carbon-to-oxygen ratio can be constrained by determining the relation between the ejecta mass and the explosion energy. This relation can be obtained from the width of the light curve, if the explosion energy is determined by another kind of observation, such as the line broadening. Similarly, the relation between the ejecta mass and the 56Ni yield also significantly depends on the (C)/(O). By observing the late decay tail of the light curve, the 56Ni ejecta mass can be obtained. This will also be a powerful tool to distinguish models with different core carbon-to-oxygen ratios.
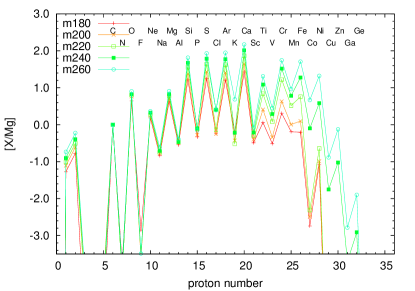
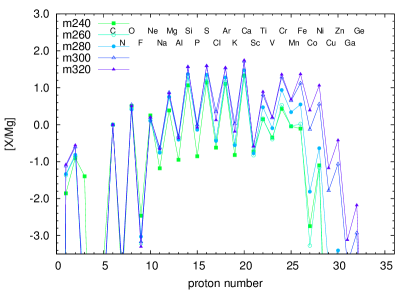
On the other hand, no significant distinction is found from PISN yields with different (C)/(O), in spite of the big difference in the initial mass ranges. The abundance ratios of PISN explosive yields are shown in Fig. 11 for models with and 1.2, in which the solar values in Asplund et al. (2009) are used. The low [Na/Mg] and the high [Ca/Mg], which characterize the PISN yields from ordinary CCSN yields (Takahashi et al., 2018), are resulted from both of the sequences. The explosive yields are incapable to discriminate stellar models with different core carbon-to-oxygen ratio.
5 Conclusion
Thanks to the development of automated wide-field surveys, currently more than 1,000 of SNe are discovered every year. The large number might be enough for the detection of PISNe, because the relative event rate of 1% of CCSN events is estimated from the conventional stellar evolution simulations for the Salpeter initial mass function. However, none of the observed SNe are known to show characteristic signatures of PISNe such as the intrinsically red color and the broad light curve.
The above estimate of % of the relative event rate of PISNe to CCSNe is based on a conventional estimate for the initial mass range of PISNe of 140–260 . Because more massive stars are less frequently formed in the present universe, the event rate of PISNe has been possibly overestimated if the upper and lower ends of the PISN mass range has been underestimated than their actual values. So far, most estimates of the PISN initial mass range have assumed the well-defined mass range of the CO core for PISNe of 65–120 . For example, a strong wind mass loss has been known to affect the PISN event rate by shifting the initial mass range for PISNe upward for VMSs with finite metallicities but without changing the CO core mass range.
In this work, we have investigated the VMS evolution with various core carbon-to-oxygen ratios. By applying a modulation factor of to the reaction rate of 12C(,)16O of Caughlan & Fowler (1988), VMS models developing CO cores with 0.15–3.1 have been calculated. The characteristic excited states of the compound nuclei 16O makes it challenging to accurately determine the 12C(,)16O reaction rate (deBoer et al., 2017). Although the small reaction rate of Caughlan & Fowler (1988) is below the uncertainty of the most recent estimates (Xu et al., 2013; deBoer et al., 2017), modulation factors of is compatible with the estimate of Buchmann (1996). Moreover, the high core carbon fraction may result from astrophysical mechanisms such as the additional mixing, because the mixing at the convective boundary region during the last part of the core He burning phase can significantly affect the carbon abundance in the convective core (Imbriani et al., 2001). Thus it is still interesting to investigate what results from the high carbon fraction in CO cores formed in VMSs.
We have found that VMSs with high core carbon-to-oxygen ratios follow a qualitatively different evolutionary path from conventional models. Less massive models with small avoid the pair-creation instability, since their effective core masses are reduced during the carbon-burning phase by developing shell convection. For example, this takes place for 105, 135, and 155 models for 1.0, 0.8, and 0.6 cases, respectively. Besides, massive exploding models with smaller are found to have higher explodabilities, i.e., stars with a higher core carbon-to-oxygen ratio explode with smaller explosion energies. For example, the explosion energies of 260 models are 73.7, 65.1, and 44.3 erg for 1.0, 0.8, and 0.6 cases, respectively. Consequently, the initial mass range for PISNe increases from for the conservative case to , , and for 1.0, 0.8, and 0.6 cases, respectively. It has been also found that, as well as the explosion energy, the 56Ni yield significantly decreases with decreasing .
We have estimated the corresponding relative event rate of PISNe to that of CCSNe by integrating a simplified IMF that is characterized by the slope, , and the upper limiting mass for the star formation, . With sufficiently large M⊙, the relative rate becomes nearly independent from , and a roughly constant value of 1% is obtained for the Salpeter value of . The event rate can be significantly reduced by decreasing , and the reduction is more vigorous for models with smaller , or with higher core carbon-to-oxygen ratios. This result advances the first theory to decrease the PISN event rate not by modifying the initial mass–CO core mass relation but by directly changing the CO core mass range.
Finally, observational consequences of PISNe
with different core carbon-to-oxygen ratios are discussed.
Based on the small explosion energies and the small 56Ni yields,
the minimum mass PISNe for different cases
are estimated to have similar luminosities to a normal Type IIP SN.
Therefore, those relatively fainter PISNe may be missed from extensive observations,
explaining the low detectability of the PISNe.
The author thanks Prof. Nobert Langer and Dr. Takashi Yoshida for fruitful discussions. The author is grateful to the anonymous referee for his/her careful reading of the manuscript and helpful comments. K. T. was supported by Japan Society for the Promotion of Science (JSPS) Overseas Research Fellowships.
References
- Angulo et al. (1999) Angulo, C., Arnould, M., Rayet, M., et al. 1999, Nuclear Physics A, 656, 3
- Arnett (1979) Arnett, W. D. 1979, ApJ, 230, L37
- Arnett (1980) —. 1980, ApJ, 237, 541
- Asplund et al. (2009) Asplund, M., Grevesse, N., Sauval, A. J., & Scott, P. 2009, ARA&A, 47, 481
- Austin et al. (2017) Austin, S. M., West, C., & Heger, A. 2017, ApJ, 839, L9
- Azuma et al. (2010) Azuma, R. E., Uberseder, E., Simpson, E. C., et al. 2010, Phys. Rev. C, 81, 045805
- Barkat et al. (1967) Barkat, Z., Rakavy, G., & Sack, N. 1967, Physical Review Letters, 18, 379
- Bellm (2018) Bellm, E. C. 2018, ArXiv e-prints, arXiv:1802.10218
- Blinnikov et al. (1996) Blinnikov, S. I., Dunina-Barkovskaya, N. V., & Nadyozhin, D. K. 1996, ApJS, 106, 171
- Buchmann (1996) Buchmann, L. 1996, ApJ, 468, L127
- Caughlan & Fowler (1988) Caughlan, G. R., & Fowler, W. A. 1988, Atomic Data and Nuclear Data Tables, 40, 283
- Chatzopoulos et al. (2015) Chatzopoulos, E., van Rossum, D. R., Craig, W. J., et al. 2015, ApJ, 799, 18
- Chatzopoulos & Wheeler (2012a) Chatzopoulos, E., & Wheeler, J. C. 2012a, ApJ, 748, 42
- Chatzopoulos & Wheeler (2012b) —. 2012b, ApJ, 760, 154
- Chatzopoulos et al. (2013) Chatzopoulos, E., Wheeler, J. C., & Couch, S. M. 2013, ApJ, 776, 129
- Chen (2015) Chen, K.-J. 2015, Modern Physics Letters A, 30, 1530002
- Chen et al. (2014) Chen, K.-J., Woosley, S., Heger, A., Almgren, A., & Whalen, D. J. 2014, ApJ, 792, 28
- Chieffi & Limongi (2013) Chieffi, A., & Limongi, M. 2013, ApJ, 764, 21
- Crowther et al. (2010) Crowther, P. A., Schnurr, O., Hirschi, R., et al. 2010, MNRAS, 408, 731
- Crowther et al. (2016) Crowther, P. A., Caballero-Nieves, S. M., Bostroem, K. A., et al. 2016, MNRAS, 458, 624
- Cyburt et al. (2010) Cyburt, R. H., Amthor, A. M., Ferguson, R., et al. 2010, ApJS, 189, 240
- deBoer et al. (2017) deBoer, R. J., Görres, J., Wiescher, M., et al. 2017, Reviews of Modern Physics, 89, 035007
- Dessart et al. (2012) Dessart, L., Hillier, D. J., Waldman, R., Livne, E., & Blondin, S. 2012, MNRAS, 426, L76
- Dessart et al. (2013) Dessart, L., Waldman, R., Livne, E., Hillier, D. J., & Blondin, S. 2013, MNRAS, 428, 3227
- Ekström et al. (2008) Ekström, S., Meynet, G., Chiappini, C., Hirschi, R., & Maeder, A. 2008, A&A, 489, 685
- Gal-Yam (2012) Gal-Yam, A. 2012, Science, 337, 927
- Gal-Yam et al. (2013) Gal-Yam, A., Mazzali, P. A., Manulis, I., & Bishop, D. 2013, PASP, 125, 749
- Gal-Yam et al. (2009) Gal-Yam, A., Mazzali, P., Ofek, E. O., et al. 2009, Nature, 462, 624
- Georgy et al. (2017) Georgy, C., Meynet, G., Ekström, S., et al. 2017, A&A, 599, L5
- Glatzel et al. (1985) Glatzel, W., Fricke, K. J., & El Eid, M. F. 1985, A&A, 149, 413
- Heger & Woosley (2002) Heger, A., & Woosley, S. E. 2002, ApJ, 567, 532
- Hirano et al. (2014) Hirano, S., Hosokawa, T., Yoshida, N., et al. 2014, ApJ, 781, 60
- Hirano et al. (2015) Hirano, S., Zhu, N., Yoshida, N., Spergel, D., & Yorke, H. W. 2015, ApJ, 814, 18
- Imbriani et al. (2001) Imbriani, G., Limongi, M., Gialanella, L., et al. 2001, ApJ, 558, 903
- Ivezić et al. (2008) Ivezić, Ž., Kahn, S. M., Tyson, J. A., et al. 2008, ArXiv e-prints, arXiv:0805.2366
- Kasen et al. (2011) Kasen, D., Woosley, S. E., & Heger, A. 2011, ApJ, 734, 102
- Kozyreva et al. (2014a) Kozyreva, A., Blinnikov, S., Langer, N., & Yoon, S.-C. 2014a, A&A, 565, A70
- Kozyreva et al. (2016) Kozyreva, A., Hirschi, R., Blinnikov, S., & den Hartogh, J. 2016, MNRAS, 459, L21
- Kozyreva et al. (2014b) Kozyreva, A., Yoon, S.-C., & Langer, N. 2014b, A&A, 566, A146
- Kozyreva et al. (2017) Kozyreva, A., Gilmer, M., Hirschi, R., et al. 2017, MNRAS, 464, 2854
- Langer et al. (2007) Langer, N., Norman, C. A., de Koter, A., et al. 2007, A&A, 475, L19
- Maeder & Meynet (1989) Maeder, A., & Meynet, G. 1989, A&A, 210, 155
- Nomoto et al. (2013) Nomoto, K., Kobayashi, C., & Tominaga, N. 2013, ARA&A, 51, 457
- Petermann et al. (2015) Petermann, I., Langer, N., Castro, N., & Fossati, L. 2015, A&A, 584, A54
- Rakavy et al. (1967) Rakavy, G., Shaviv, G., & Zinamon, Z. 1967, ApJ, 150, 131
- Saio et al. (1988) Saio, H., Nomoto, K., & Kato, M. 1988, ApJ, 331, 388
- Schneider et al. (2014) Schneider, F. R. N., Izzard, R. G., de Mink, S. E., et al. 2014, ApJ, 780, 117
- Schneider et al. (2018) Schneider, F. R. N., Sana, H., Evans, C. J., et al. 2018, Science, 359, 69
- Steigman (2007) Steigman, G. 2007, Annual Review of Nuclear and Particle Science, 57, 463
- Susa et al. (2014) Susa, H., Hasegawa, K., & Tominaga, N. 2014, ApJ, 792, 32
- Takahashi et al. (2014) Takahashi, K., Umeda, H., & Yoshida, T. 2014, ApJ, 794, 40
- Takahashi et al. (2013) Takahashi, K., Yoshida, T., & Umeda, H. 2013, ApJ, 771, 28
- Takahashi et al. (2018) —. 2018, ApJ, 857, 111
- Takahashi et al. (2016) Takahashi, K., Yoshida, T., Umeda, H., Sumiyoshi, K., & Yamada, S. 2016, MNRAS, 456, 1320
- Timmes et al. (1995) Timmes, F. X., Woosley, S. E., & Weaver, T. A. 1995, ApJS, 98, 617
- Umeda & Nomoto (2002) Umeda, H., & Nomoto, K. 2002, ApJ, 565, 385
- Vink et al. (2015) Vink, J. S., Heger, A., Krumholz, M. R., et al. 2015, Highlights of Astronomy, 16, 51
- Weaver & Woosley (1993) Weaver, T. A., & Woosley, S. E. 1993, Phys. Rep., 227, 65
- West et al. (2013) West, C., Heger, A., & Austin, S. M. 2013, ApJ, 769, 2
- Woosley (1993) Woosley, S. E. 1993, ApJ, 405, 273
- Woosley (2017) —. 2017, ApJ, 836, 244
- Woosley et al. (2007) Woosley, S. E., Blinnikov, S., & Heger, A. 2007, Nature, 450, 390
- Woosley & Heger (2006) Woosley, S. E., & Heger, A. 2006, ApJ, 637, 914
- Woosley & Heger (2007) —. 2007, Phys. Rep., 442, 269
- Xu et al. (2013) Xu, Y., Takahashi, K., Goriely, S., et al. 2013, Nuclear Physics A, 918, 61
- Yamada (1997) Yamada, S. 1997, ApJ, 475, 720
- Yoon et al. (2012) Yoon, S.-C., Dierks, A., & Langer, N. 2012, A&A, 542, A113
- Yoon & Langer (2005) Yoon, S.-C., & Langer, N. 2005, A&A, 443, 643
- Yoshida et al. (2014) Yoshida, T., Okita, S., & Umeda, H. 2014, MNRAS, 438, 3119
- Yoshida & Umeda (2011) Yoshida, T., & Umeda, H. 2011, MNRAS, 412, L78
- Yoshida et al. (2016) Yoshida, T., Umeda, H., Maeda, K., & Ishii, T. 2016, MNRAS, 457, 351
- Yusof et al. (2013) Yusof, N., Hirschi, R., Meynet, G., et al. 2013, MNRAS, 433, 1114