No Strong Geometric Beaming in the Ultraluminous Neutron Star Binary NGC 300 ULX-1 (SN 2010da) from Swift and Gemini
Abstract
We have obtained near-simultaneous Swift/XRT imaging and Gemini GMOS spectroscopy for the ultraluminous X-ray source (ULX) NGC 300 ULX-1 (formerly designated SN 2010da). The observed X-ray emission is consistent with an inhomogeneous wind that partially obscures a central, bright inner accretion disk. We simultaneously fit eleven 0.3-10 keV spectra obtained over a 1 year time period (2016 April to 2017 July) using the same partial covering model, and find that although the covering fraction varies significantly (from 78% to consistent with 0%), the unabsorbed luminosity remains essentially constant across all observations ( erg s-1). A relatively high 0.3-10 keV fractional variability amplitude () of 30% is observed in all eleven observations. Optical spectra from Gemini exhibit numerous emission lines (e.g., H, H, He II 4686) which suggest that the neutron star primary is photoionizing material in the immediate vicinity of the binary. We compare the He II 4686 line luminosity ( erg s-1) to the contemporaneous soft X-ray emission and find the X-ray emission is broadly consistent with the observed He II line luminosity. The combination of our X-ray observations and optical spectroscopy suggest that geometric beaming effects in the ULX-1 system are minimal, making ULX-1 one of only a few bona fide ULXs to be powered by accretion onto a neutron star.
Subject headings:
X-rays: binaries, individual (SN 2010da, NGC 300 ULX-1) – accretion, accretion disks – ultraluminous X-ray sources1. Introduction
It is now well-established that the optical transient SN 2010da (Monard, 2010; Immler et al., 2010) in NGC 300 was a supernova “impostor” (Chornock & Berger, 2010; Elias-Rosa et al., 2010a, b), and likely a young (5 Myr; Binder et al., 2011, 2016) high-mass X-ray binary (HMXB). Several multiwavelength studies (from X-ray to infrared) have been conducted to examine the nature of the binary components (Binder et al., 2016; Villar et al., 2016; Lau et al., 2016), and recently deep XMM-Newton +NuSTAR observations have confirmed the neutron star origin of the X-ray emission (Carpano et al., 2018; Walton et al., 2018; Kosec et al., 2018). The most likely scenario is that SN 2010da hosts a neutron star primary with a spin period s and s-1 (Carpano et al., 2018) and a supergiant companion (Lau et al., 2016), possibly a yellow- or red-supergiant (RSG) entering a blue-loop phase of its evolution (Villar et al., 2016). Optical spectroscopy (Chornock & Berger, 2010; Elias-Rosa et al., 2010b; Chornock et al., 2011; Villar et al., 2016) has revealed complex environment. Much of the dust that enshrouded the progenitor system (Khan et al., 2010) was destroyed in the initial optical/X-ray outburst (Brown, 2010; Prieto et al., 2010), and recent observations suggest that new dust is actively forming from the supergiant donor star (Lau et al., 2016). The high X-ray luminosities ( erg s-1) recently observed in the XMM and NuSTAR have earned SN 2010da a new designation: NGC 300 ULX-1.
Ultraluminous X-ray sources (ULXs) are off-nuclear X-ray sources with luminosities exceeding the Eddington limit of a 10 black hole in the 0.3-10 keV energy band (for a review, see Feng & Soria, 2011). The extreme X-ray luminosities are expected to arise from ‘supercritical’ accretion (King, 2009; Bachetti et al., 2014), where large scale-height, optically thick winds are radiatively driven to large radii, revealing a hot accretion disk (King, 2004; Poutanen et al., 2007). Inclination angle, therefore, plays a major role in the appearance of ULXs (Middleton et al., 2011, 2014; Sutton et al., 2013), and beaming effects may amplify the X-ray emission (particularly in the hard band King, 2009; Poutanen et al., 2007). Clumps and inhomogeneities in the winds can imprint variability in the X-ray emission, which is likewise dependent on inclination angle (Takeuchi et al., 2013, 2014; Middleton et al., 2011; Heil et al., 2009; Sutton et al., 2013).
We present the results of recent monitoring campaign of NGC 300 ULX-1/SN 2010da (hereafter, ULX-1) by the Neil Gehrels Swift Observatory (hereafter, Swift) combined with ground-based optical spectroscopy with the Gemini Observatory. Throughout this work, we assume a distance to NGC 300 of 2.0 Mpc (Dalcanton et al., 2009, corresponding to a redshift ), and a column of neutral absorption fixed at the Galactic column ( = 4.09 cm-2; Kalberla et al., 2005).
2. Observations
2.1. Swift/XRT
Swift/XRT (Burrows et al., 2004) observations were obtained from 2016 April 14 through 2017 April 22 through the Swift archive (Evans et al., 2009), and our team acquired three new target-of-opportunity observations on 2017 July 2, 6, and 12 to coincide with our Gemini observations. All observations were performed in Photon Counting mode (Hill et al., 2004). The data were produced using standard procedures (XRTPIPELINE) using the FTOOLS in the HEASOFT package (v 6.17).
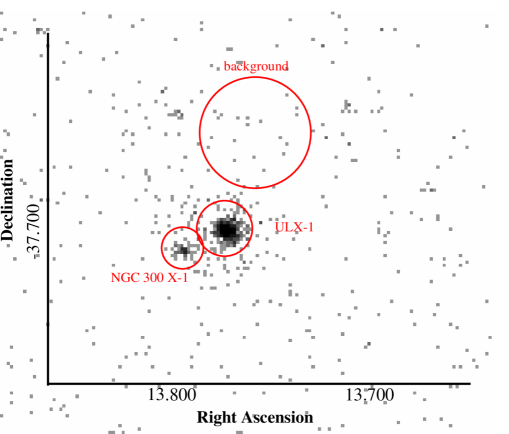
The location of the X-ray source corresponding to ULX-1 has been measured with high precision by Chandra, with a right ascension of 00:55:04.9 and a declination of -37:41:44.0. Spectra were extracted in each observations where an X-ray source was detected near these coordinates with a signal-to-noise 3; we used a circular aperture with a 40″ radius centered on the Chandra position of ULX-1. The background was extracted from a circular aperture (radius of 80″) offset from the ULX-1 position in a region with no obvious contaminating X-ray sources. Figure 1 shows an example Swift/XRT image, with our extraction regions superimposed. Ancillary response files were generated for each spectrum with XRTMKARF using the spectral redistribution matrix v015111See http://heasarc.gsfc.nasa.gov/docs/heasarc/caldb/swift.
2.2. Gemini Spectroscopy
We obtained time-resolved optical spectra of ULX-1 using the Gemini Multi-Object Spectrograph on Gemini South (Hook et al., 2004; Gimeno et al., 2016). The observations were carried out in queue mode during June and July of 2017 and were originally designed to be executed in three separate visits, each with complete wavelength coverage, spaced 5 and 10 days apart respectively. Unfortunately, poor weather at Gemini prevented this execution, and we instead obtained four different spectra with full or partial wavelength coverage spanning a 42-day period. Our final set of observations is summarized in Table 1.
| Date | Grating | Exp. Time | Resolution | |
|---|---|---|---|---|
| (UT) | (Å) | (s) | (Å) | |
| (1) | (2) | (3) | (4) | (5) |
| 2017 Jun 19 | B600 | 5000 | 2 600 | 3 |
| B600 | 5050 | 2 600 | 3 | |
| R400 | 7000 | 2 600 | 4 | |
| 2017 Jul 02 | B600 | 5000 | 2 600 | 3 |
| B600 | 5050 | 2 600 | 3 | |
| R400 | 7000 | 2 600 | 4 | |
| R400 | 7050 | 2 600 | 4 | |
| 2017 Jul 18 | R400 | 7000 | 2 600 | 4 |
| R400 | 7050 | 2 600 | 4 | |
| 2017 Jul 30 | B600 | 5000 | 2 600 | 3 |
| B600 | 5050 | 2 600 | 3 |
Our spectra were taken with the 0.5330′′ slit, using the B600 grating centered at 5000Å and the R400 grating (with the GG455 blocking filter) centered at 7000Å for a total wavelength coverage of 3600Å to 9000Å; the grating centers shifted by +50Å for half of our observations to avoid the detector gaps. Image quality during these observations was 85 222Our image quality criteria correspond to a point source FWHM of in the -band; see http://www.gemini.edu/sciops/telescopes-and-sites/observing-condition-constraints#ImageQuality for a complete discussion of Gemini image quality criteria, and the data were taken at a mean airmass of 1.1. Standard quartz lamp and CuAr arc lamp observations were taken for flat-field and wavelength calibrations.
The data were reduced using the gemini package in IRAF (Gemini Observatory & AURA, 2016). Data read out through the 12 amplifiers on the three GMOS-S chips were mosaiced together with the gprepare task. A bias image and flat field images for each grating were created from the gbias and gsflat tasks, and the data were reduced with gsreduce. Two-dimensional wavelength solutions in each grating were created with gswavelength and applied with gstransform. We used gsskysub on the two dimensional images to account for telluric features in the data. One-dimensional spectra were traced, extracted, and background-subtracted with gsextract. We also observed the spectrophotometric standard star Hiltner 600 (aka H600/HD 289002, Baldwin & Stone, 1984) with the same instrument setup on 2017 March 3rd – unfortunately we were unable to obtain observations of H600 on the same night as our observations of ULX-1 due to poor weather. We derive the sensitivity function for each grating using gsstandard and applied it to the data with gscalibrate. Finally, the data from individual nights were combined using gemscombine.
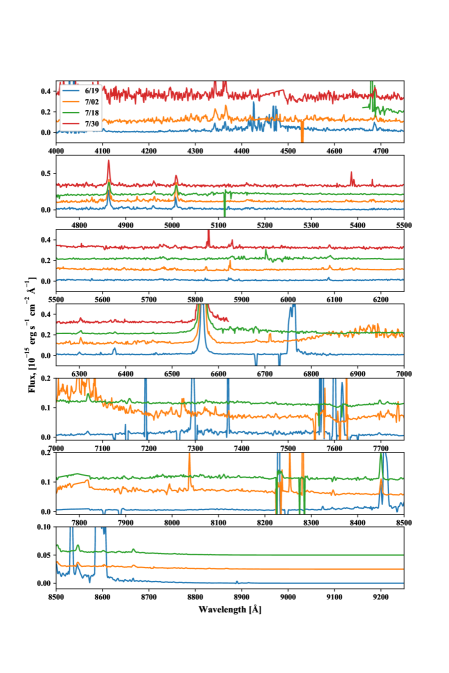
The resulting flux-calibrated GMOS spectra are shown in Figure 2, and line identifications and fluxes (corrected for a foreground reddening of E(B-V)=0.011; Schlafly & Finkbeiner, 2011) are listed in Table 2. The wavelengths in both Figure 2 and Table 2 are in the observer frame (as was done in Villar et al., 2016). The redshift to NGC 300 is very small (141 km s-1), and it is thus impossible to clarify whether the observed shifts in the lines relative to the rest wavelength can be attributed to the velocity of NGC 300 itself, the motion of ULX-1 within NGC 300, or the velocity of the emission source within the system.
| Date | Line ID | Shapea | Flux (10-15 erg | FWHM | Eq. Width | Line ID | Shapea | Flux (10-15 erg | FWHM | Eq. Width | |||
| (Å) | s-1 cm-2 Å-1) | (km s-1) | (Å) | (Å) | s-1 cm-2 Å-1) | (km s-1) | (Å) | ||||||
| (1) | (2) | (3) | (4) | (5) | (6) | (7) | (8) | (9) | (10) | (11) | (12) | (13) | |
| June 19 | H | G | 4102.44 | 0.099 | 231 | -7.346 | H | G | 4341.65 | 0.338 | 305 | -25.79 | |
| July 2 | G | 4103.80 | 0.134 | 323 | -8.034 | G | 4343.46 | 0.863 | 515 | -44.54 | |||
| July 30 | … | … | … | … | G | 4342.52 | 0.756 | 211 | -13.22 | ||||
| June 19 | [O III]+ | G | 4364.25 | 0.243 | 185 | -8.522 | He II | G | 4686.71 | 0.430 | 338 | -21.2 | |
| July 2 | [Fe IX]+ | G | 4366.16 | 0.688 | 354 | -21.89 | G | 4688.15 | 0.318 | 342 | -24.3 | ||
| July 30 | Fe II | G | 4364.34 | 0.640 | 149 | -6.623 | G | 4687.07 | 0.587 | 355 | -15.4 | ||
| June 19 | H | L | 4863.16 | 1.967 | 280 | -205.2 | [O III] | G | 4959.57 | 0.238 | 296 | -16.86 | |
| July 2 | L | 4863.45 | 2.103 | 253 | -109.5 | G | 4961.73 | 0.207 | 185 | -9.865 | |||
| July 18 | L | 4863.84 | 1.479 | 293 | -306.5 | G | 4960.89 | 0.207 | 324 | -16.14 | |||
| July 30 | L | 4863.38 | 2.333 | 240 | -76.2 | G | 4960.88 | 0.334 | 268 | -6.50 | |||
| June 19 | [O III] | L | 5007.77 | 0.875 | 186 | -73.3 | G | 5755.06 | 0.038 | 251 | -3.583 | ||
| July 2 | G | 5008.8 | 1.196 | 253 | -54.24 | [N II]+ | G | 5755.36 | 0.104 | 243 | -11.98 | ||
| July 18 | G | 5008.86 | 0.837 | 350 | -461.8 | [Fe II] | … | … | … | … | |||
| July 30 | G | 5008.93 | 0.682 | 249 | -12.94 | G | 5756.86 | 0.018 | 305 | -8.587 | |||
| June 19 | He I | c | … | … | … | … | [Fe VIII] | G | 6087.1 | 0.094 | 171 | -11.18 | |
| July 2 | c | … | … | … | … | G | 6090.11 | 0.174 | 245 | -13.54 | |||
| July 18 | G | 5879.01 | 0.293 | 483 | -30.22 | G | 6090.45 | 0.301 | 423 | -14.00 | |||
| July 30 | c | … | … | … | … | G | 6089.17 | 0.150 | 225 | -8.665 | |||
| June 19 | [O I] | G | 6300.33 | 0.147 | 285 | -26.58 | [Fe X] | G | 6375.71 | 0.360 | 246 | -34.98 | |
| July 2 | G | 6303.35 | 0.271 | 202 | -19.19 | G | 6377.66 | 0.115 | 255 | -8.165 | |||
| July 18 | G | 6302.66 | 0.151 | 278 | -10.6 | G | 6377.09 | 0.085 | 211 | -6.445 | |||
| July 30 | G | 6302.91 | 0.181 | 194 | -6.267 | G | 6377.24 | 0.114 | 179 | -4.157 | |||
| June 19 | H | L | 6564.57 | 7.846 | 343 | -453.7 | He I | G | 7067.89 | 0.080 | 304 | -11.14 | |
| July 2 | L | 6566.56 | 19.52 | 299 | -961.7 | G | 7068.98 | 0.377 | 219 | -4.52 | |||
| July 18 | L | 6566.17 | 26.43 | 298 | -696.2 | G | 7069.2 | 0.167 | 235 | -8.247 | |||
| July 30 | L | 6565.8 | 31.38 | 257 | -905.7 | … | … | … | … | ||||
| June 19 | [Ca II] | … | … | … | … | [Fe XI] | G | 7894.32 | 0.033 | 180 | -5.371 | ||
| July 18 | G | 7323.15 | 0.033 | 140 | -1.961 | G | 7896.61 | 0.082 | 172 | -4.518 | |||
| June 19 | O I | G | 8448.95 | 0.341 | 151 | -22.66 | Ca II+ | G | 8500.65 | 0.051 | 114 | -3.931 | |
| July 2 | G | 8450.46 | 0.247 | 157 | -34.12 | Pa 8500 | G | 8502.96 | 0.045 | 242 | -9.288 | ||
| July 18 | G | 8450.11 | 0.452 | 157 | -39.83 | G | 8503.0 | 0.067 | 252 | -8.854 | |||
| June 19 | Ca II+ | G | 8546.89 | 0.154 | 241 | -8.499 | Ca II+ | G | 8665.86 | 0.018 | 100 | -5.757 | |
| July 2 | Pa 8544 | G | 8547.34 | 0.051 | 218 | -11.27 | Pa 8664 | G | 8667.63 | 0.025 | 235 | -8.323 | |
| July 18 | G | 8546.9 | 0.069 | 199 | -12.06 | G | 8666.86 | 0.033 | 178 | -7.597 | |||
| June 19 | Pa 8753 | G | 8753.51 | 0.004 | 167 | -5.189 | Pa 8753 | … | … | … | … | ||
| July 2 | G | 8754.87 | 0.004 | 172 | -2.935 | G | 8867.5 | 0.006 | 252 | -24.71 | |||
| July 18 | G | 8755.33 | 0.007 | 231 | -4.922 | G | 8868.03 | 0.001 | 141 | -2.992 | |||
| Table Comments: Measurement errors are 10%. aLorentzian (L), Gaussian (G), complex (c) bWavelengths are in observer frame. | |||||||||||||
3. X-ray Analysis
3.1. Spectral Modeling
X-ray emission from ULX-1 was detected with a signal-to-noise in all 11 Swift/XRT observations obtained since 2016. High-quality ULX spectra typically require multiple components (Sutton et al., 2013; Middleton et al., 2015). Carpano et al. (2018) found that variations in the observed flux from ULX-1 in XMM-Newton and NuSTAR could be interpreted in changes in absorbing column only. We therefore simultaneously fit all eleven 0.3-10 keV Swift spectra using XSPEC (Arnaud, 1996) v.12.9.1 with a single model (tbabs*pcfabs*(diskbb+nthcomp)); only the covering fraction was allowed to vary between each observation. The neutral absorbing column lower limit was set to the Galactic line-of-sight value (4.09 cm-2; Kalberla et al., 2005). We used a multicolor disk blackbody component to model the optically thick wind emission, and nthcomp has been used previously to describe the harder X-ray emission originating in the inner disk (e.g., Middleton et al., 2015, while other authors have used a simple power law to represent this component). Due to the low number of counts, we fit the unbinned spectra using -statistics, and the Pearson statistic was used as a “test” statistic for comparison purposes only.
The best-fit spectral model parameters are given in Table 3. The fit parameters were generally consistent with those found by Carpano et al. (2018), although the Swift data require substantial intrinsic absorption associated with the partial covering model component ( cm-2). A similarly high absorbing column was required to adequately fit the 2010 XMM observations that were obtained shortly after the initial outburst. This result is consistent with the recent multiwavelength SED modeling by Lau et al. (2016) and Villar et al. (2016), which suggested that dust was actively re-forming in the vicinity of ULX-1. Details about the eleven individual observations used in the spectral fitting, with the observation-specific best-fit partial covering fraction and unabsorbed luminosities, are presented in Table 4.
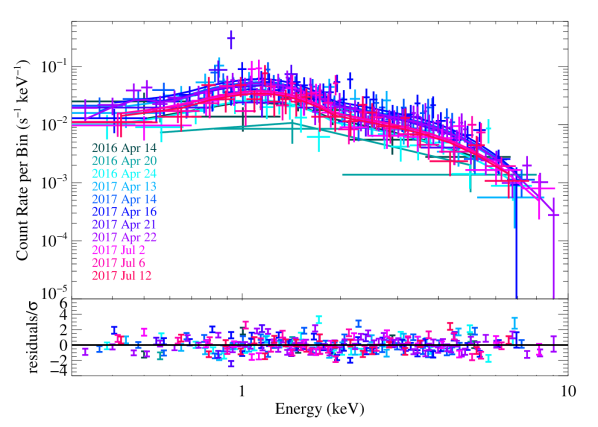
Figure 3 shows the 0.3-10 keV spectra for all eleven observations, binned for display purposes only, with the best-fit models superimposed. The unabsorbed luminosities are essentially constant (within a factor of 3) across all observations. The average unabsorbed 0.3-10 keV luminosity is erg s-1, similar to what was measured by Carpano et al. (2018) and roughly an order of magnitude higher than the classical Eddinginton limit for a neutron star. We can use the luminosity relation to estimate the average mass accretion rate onto the ULX-1 neutron star. Assuming canonical neutron star values of and =10 km, we estimate a mass accretion rate yr-1.
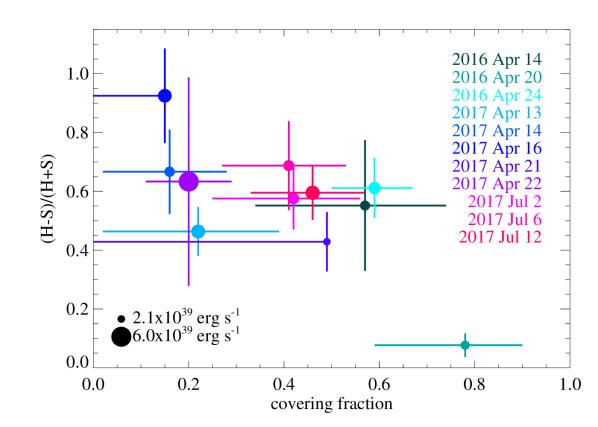
The partial covering fractions vary significantly between observations, from 78% on 2016 April 04 to consistent with 0% a year later. We define the spectral hardness ratio , where is the unabsorbed flux in the 1-10 keV band and is the unabsorbed flux in the 0.3-1 keV band. There is evidence for changes in the unabsorbed spectral hardness with partial covering fraction (see Figure 4) – the observation with the highest covering fraction exhibits the lowest value of (e.g., the unabsorbed hard flux was comparable to the unabsorbed soft flux), while observations with smaller covering fractions exhibit significantly harder values of .
| Component | Parameter | Best-Fit Value |
| (1) | (2) | (3) |
| tbabs | (1022 cm-2) | 0.160.03 |
| pcfabs | (1022 cm-2) | 32.2 |
| diskbb | (keV) | 0.40 |
| nthcomp | 1.54 | |
| nthcomp | (keV) | 1.76 |
| 0.3-10 keV (erg s-1) | ||
| Luminosity | 0.3-1 keV (erg s-1) | |
| 1-10 keV (erg s-1) | ||
| Photon Flux | 54-200 eV (ph s-1) | |
| degrees of freedom | 1284 | |
| Fit statistics | 1053.8 | |
| 1.00 |
| Obs. ID | Date | Exp. | Position (J2000) | Net Counts | covering | Luminosity (1039 erg s-1) | |||||||
| Time (s) | R.A. | Decl. | (0.3-10 keV) | fraction (%) | (%) | 0.3-10 keV | 0.3-1 keV | 1-10 keV | |||||
| (1) | (2) | (3) | (4) | (5) | (6) | (7) | (8) | (9) | (10) | (11) | (12) | ||
| 00049834002 | 2016-04-14 | 599 | 00:55:04.9 | -37:41:40.2 | 439 | 57 | 3311 | 0.550.22 | |||||
| 00049834003 | 2016-04-20 | 489 | 00:55:04.7 | -37:41:40.3 | 1565 | 78 | 318 | 0.080.04 | |||||
| 00049834005 | 2016-04-24 | 2922 | 00:55:04.9 | -37:41:46.1 | 19419 | 59 | 3311 | 0.610.10 | |||||
| 00049834006 | 2017-04-13 | 1128 | 00:55:04.9 | -37:41:41.0 | 11914 | 22 | 3211 | 0.460.08 | |||||
| 00049834007 | 2017-04-14 | 2545 | 00:55:04.8 | -37:41:46.7 | 33825 | 16 | 2912 | 0.670.14 | |||||
| 00049834008 | 2017-04-16 | 1853 | 00:55:04.5 | -37:41:48.6 | 30123 | 349 | 0.930.16 | ||||||
| 00049834009 | 2017-04-21 | 522 | 00:55:04.8 | -37:41:48.6 | 479 | 3110 | 0.430.10 | ||||||
| 00049834010 | 2017-04-22 | 5175 | 00:55:04.5 | -37:41:46.6 | 61733 | 3110 | 0.630.35 | ||||||
| 00049834012 | 2017-07-02 | 1296 | 00:55:04.7 | -37:41:41.2 | 11614 | 42 | 3112 | 0.580.11 | |||||
| 00049834013 | 2017-07-06 | 1953 | 00:55:04.4 | -37:41:47.0 | 18718 | 41 | 3511 | 0.690.15 | |||||
| 00049834014 | 2017-07-12 | 1833 | 00:55:04.4 | -37:41:44.0 | 15617 | 46 | 329 | 0.600.09 | |||||
3.2. Timing
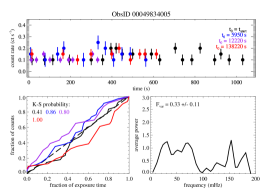
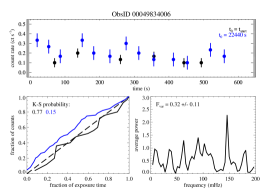
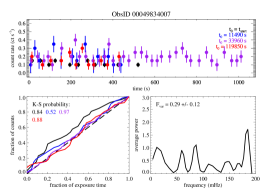
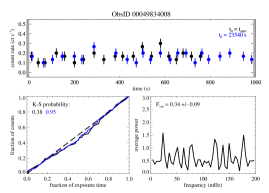
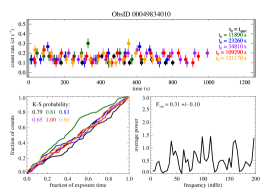
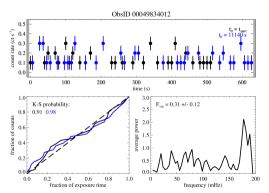
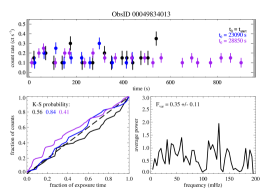
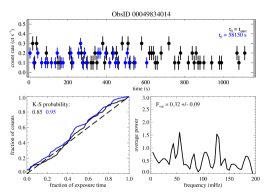
X-ray variability provides additional clues to the geometry of supercritical accretion onto the neutron star. Variability can arise from clumps or inhomogeneities in the winds as they transit the central region from the perspective of the observer. Alternatively, inwardly propagating variations in surface density or mass accretion rate (“flicker noise,” e.g., as mass is lost to the wind, Lyubarskii, 1997; Ingram & Done, 2012; Middleton et al., 2015) can produce variations in X-ray emission, especially at sub-Eddington accretion rates (Remillard & McClintock, 2006; Heil et al., 2015a, b). Following the approach of Middleton et al. (2015), we compute the fractional root-mean-square variability () by Fourier-transforming 1000 s segments of the background-subtracted 0.3-10 keV light curves of ULX-1 and averaging the resulting periodograms (see also van der Klis, 1989). is then calculated by integrating the power over the frequency range of 3–200 mHz (where most broad-band variability is observed in ULXs Heil et al., 2009) and taking the square root (Edelson et al., 2002). In all eleven Swift observations, (see Table 4). Similar variability behavior has been observed in other ULXs with relatively soft spectra (Sutton et al., 2013; Middleton et al., 2015). We used a two-sided K-S test of the photon arrival time in each exposure against the assumption of a constant count rate, but do not find any evidence for significant variability on short time scales. Our light curves (shown in Figure 5) are consistent with a constant count rate, with variations about a constant rate on the order of 30%.


4. Discussion
4.1. Potential Evidence for Geometric Beaming?
The observed variation in covering fractions and spectral hardnesses from our X-ray spectral modeling is likely driven by changes in the mass accretion rate onto the ULX-1 neutron star primary. Using the spectral-timing model of Sutton et al. (2013) and Middleton et al. (2015), we can interpret the partial covering component of the spectral model as representing optically thick clumps in the winds of ULX-1 as they obscure the central ionizing source. High covering fractions indicate an increased homogeneity of the winds, and the simultaneous softening of the spectrum may correspond to an increased mass accretion rate. The high luminosities of ULXs have led some to speculate that beaming effects may be important for understanding the geometry of the underlying X-ray binary (King, 2009); such beaming would occur if the observer’s line of sight to the ULX () falls within the opening angle over which the wind is launched (i.e., see Figure 1 in Middleton et al., 2015). At low inclinations, the observer will have a relatively unobstructed view of the hot inner accretion disk and will therefore observe a harder spectrum. Although there is evidence for a relatively hard component in the ULX-1 spectrum (), 90% of the unabsorbed flux originates in the soft wind component in all eleven observations. Our X-ray spectral-timing suggest that we are observing ULX-1 at small- to moderate-.
The importance of beaming was explored for the pulsed neutron star-ULX M82 ULX-2 (King & Lasota, 2016). The relationship between the observed X-ray luminosity and (the ratio of the thermal timescale mass transfer rate to the Eddington rate) is given by (King, 2009; King & Lasota, 2016):
| (1) |
where is the mass of the neutron star (assumed to be 1.4 ) and is the observed X-ray luminosity in units of 1040 erg s-1. Using the average X-ray luminosity from our spectral modeling ( = 0.35) yields . King (2009) give an approximate relationship between and the beaming factor ,
| (2) |
which is valid for . We therefore estimate a modest beaming factor for ULX-1. The “spherization” radius from which the winds are launched can be estimated from Shakura & Sunyaev (1973):
| (3) |
where is the gravitational radius of the neutron star, . Using this expression, we estimate km.
Geometric beaming, if present, would further impart evidence on the surrounding material. ULXs are expected to ionize the surrounding ISM (Tarter et al., 1969; Kallman & McCray, 1982; Pakull & Angebault, 1986) in a manner that is analogous to UV-ionized H II regions. X-ray ionized nebula, however, will lack a clearly defined boundary (e.g., the equivalent of a Strömgren sphere; Pakull & Mirioni, 2002) and will instead produce an extended, warm region of weakly ionized atoms and collisionally-excited species. The resulting X-ray-ionized nebula will exhibit spectral features from high-ionization species, notably the He II 4686 emission line.
The He II 4686 emission line is particularly sensitive to the photon flux originating from 54-200 eV. We measure an average FWHM of 345 km s-1 in the three Gemini spectra where the He II 4686 line is measurable, somewhat higher than the 270 km s-1 FWHM value found by Villar et al. (2016). Following the approach of Pakull & Angebault (1986), we can combine our Swift X-ray observations and Gemini optical spectroscopy to determine to what degree beaming is occurring in the ULX-1 system. The 54–200 eV photon flux () can be directly measured from our X-ray spectra. These X-ray photons will then excite the He II 4686 emission line in the Gemini spectrum. The absorbed rate of He+ Lyman continuum photons, , in the nebula surrounding ULX-1 can then be calculated by
| (4) |
where (He) is the recombination coefficient summed over all levels above the ground state and is the effective recombination coefficient for the emission of He II 4686 photons, which carry an energy . The ratio of these two coefficients is 5.2 (Pakull & Angebault, 1986), and depends only weakly on the electron temperature.
The observed He II luminosity from the optical spectrum obtained on 2 July 2017 is erg s-1, which implies ph s-1. The Swift X-ray spectrum obtained on the same day yields 6.4 ph s-1; in general, the X-ray spectra predict an average of ph s-1. The X-ray predicted is therefore broadly consistent with the observed . Any geometric beaming effects, if present in the ULX-1 system at all, are likely small.
4.2. The Origin of the Optical Emission Lines
Numerous emission lines are present in the Gemini spectra. Optical images of ULX-1 obtained in 2016 with the Hubble Space Telescope did not show evidence for significant nebulosity – the extinction intrinsic to NGC 300 at the location of the X-ray source was estimated to be mag (Binder et al., 2016). Recent work by Lau et al. (2016) and Villar et al. (2016) indicates that dust may be actively reforming in the vicinity of the central binary (within few hundred AU). We therefore expect the emission lines observed in the Gemini spectra originate from the ULX-1 binary or its immediate vicinity, and not from an extended nebula.
The lack of strong [O II] and [S II] lines imply that the material in the immediate vicinity of ULX-1 is not shock-heated (Baldwin et al., 1981; Sutherland & Dopita, 1993; Kewley et al., 2001). The [O III] 5007/H line ratio and lack of detectable and [N II] 6583 places ULX-1 firmly the photoionization-dominant quadrant of the classic BPT diagram (see, e.g., Evans et al., 1999; Abolmasov et al., 2007, and references therein). This differs from several ULXs that are known to be associated with bright nebulae and bubbles, which typically exhibit spectral features consistent with bright, shock-powered nebulae (Pakull & Mirioni, 2003; Pakull et al., 2006). Ionizing X-ray and UV radiation originating from the 2010 outburst could have affected the surrounding environment only out to a radius of 8 light years (2.5 pc); at the distance of NGC 300, this distance corresponds to an angular size of 026, less than the width of the slit used to obtain the Gemini spectra. The lack of a bright, shock-powered nebula may be due to the young age of the system: ULX-1 is known to be associated with a very young (5 Myr) stellar population (Binder et al., 2016). Although this young age is not unique among ULXs (several nearby ULXs also exhibit extremely young ages, consistent with X-ray binary and ULX formation models; Poutanen et al., 2013; Berghea et al., 2013; Wiktorowicz et al., 2017; Linden et al., 2010), most ULXs with extended nebulae are >10 Myr old (see Berghea et al., 2013; Voss et al., 2011; Yang et al., 2011, and references therein) and have been presumably producing ionizing radiation over significantly longer timescales.
H is well described by a Lorentzian profile with a full width at half maximum (FWHM) of 300 km s-1 (compared to 560 km s-1 following the initial outburst; Villar et al., 2016). The H flux varies by a factor of 4 across our observations, ranging from 7.8 erg s-1 cm-2 Å-1 to 3.1 erg s-1 cm-2 Å-1. In all four observations, the flux ratio H/H. This is similar to the late-time spectrum obtained by Villar et al. (2016), and is consistent with emission from a persistent wind or mass loss from a blue or yellow supergiant donor star (and not standard case B recombination). A detailed study of the optical spectra will be presented in a forthcoming paper.
5. Conclusions
We have obtained new, near-simultaneous Swift/XRT imaging and Gemini GMOS spectroscopy for the supernova impostor-turned-ULX SN 2010da in NGC 300. The X-ray emission from the object has been persistently high, erg s-1, since 2016, consistent with deep XMM-Newton +NuSTAR observations (Carpano et al., 2018). The X-ray spectra and temporal properties are consistent with the widely accepted “supercritical” model of ULX accretion, in which optically thick winds are launched from a region close to the ionizing central source and reveal a hot, inner accretion disk. The optical spectra suggest that the neutron star X-ray source is photoionizing material in immediate vicinity (2.5 pc) of the central binary. Our comparison of the soft X-ray emission to the observed He II 4686 emission line luminosity suggests that geometric beaming effects are minimal in the ULX-1 system, making ULX-1 one of only a few bona fide ULXs to be powered by accretion onto a neutron star.
Acknowledgements
This research has made by using Swift/XRT data provided by the UK Swift Science Data Centre at the University of Leicester. The authors would like to thank Loredana Vetere for her assistance obtaining the Swift ToO observations. We thank the Swift team, the PI, the duty scientists and science planners for making the three ToO observations reported here possible. BB was supported by the NSF via award CAREER-1454333 (PI M. Povich).
References
- Abolmasov et al. (2007) Abolmasov, P., Fabrika, S., Sholukhova, O., & Afanasiev, V. 2007, Astrophysical Bulletin, 62, 36
- Arnaud (1996) Arnaud, K. A. 1996, in Astronomical Society of the Pacific Conference Series, Vol. 101, Astronomical Data Analysis Software and Systems V, ed. G. H. Jacoby & J. Barnes, 17
- Bachetti et al. (2014) Bachetti, M., et al. 2014, Nature, 514, 202
- Baldwin et al. (1981) Baldwin, J. A., Phillips, M. M., & Terlevich, R. 1981, PASP, 93, 5
- Baldwin & Stone (1984) Baldwin, J. A., & Stone, R. P. S. 1984, MNRAS, 206, 241
- Berghea et al. (2013) Berghea, C. T., Dudik, R. P., Tincher, J., & Winter, L. M. 2013, ApJ, 776, 100
- Binder et al. (2011) Binder, B., Williams, B. F., Kong, A. K. H., Gaetz, T. J., Plucinsky, P. P., Dalcanton, J. J., & Weisz, D. R. 2011, ApJ, 739, L51
- Binder et al. (2016) Binder, B., Williams, B. F., Kong, A. K. H., Gaetz, T. J., Plucinsky, P. P., Skillman, E. D., & Dolphin, A. 2016, MNRAS, 457, 1636
- Brown (2010) Brown, P. J. 2010, The Astronomer’s Telegram, 2633, 1
- Burrows et al. (2004) Burrows, D. N., et al. 2004, in Proc. SPIE, Vol. 5165, X-Ray and Gamma-Ray Instrumentation for Astronomy XIII, ed. K. A. Flanagan & O. H. W. Siegmund, 201
- Carpano et al. (2018) Carpano, S., Haberl, F., Maitra, C., & Vasilopoulos, G. 2018, MNRAS
- Chornock & Berger (2010) Chornock, R., & Berger, E. 2010, The Astronomer’s Telegram, 2637, 1
- Chornock et al. (2011) Chornock, R., Czekala, I., & Berger, E. 2011, The Astronomer’s Telegram, 3726, 1
- Dalcanton et al. (2009) Dalcanton, J. J., et al. 2009, ApJS, 183, 67
- Edelson et al. (2002) Edelson, R., Turner, T. J., Pounds, K., Vaughan, S., Markowitz, A., Marshall, H., Dobbie, P., & Warwick, R. 2002, ApJ, 568, 610
- Elias-Rosa et al. (2010a) Elias-Rosa, N., Mauerhan, J. C., & van Dyk, S. D. 2010a, Central Bureau Electronic Telegrams, 2292, 2
- Elias-Rosa et al. (2010b) Elias-Rosa, N., Mauerhan, J. C., & van Dyk, S. D. 2010b, The Astronomer’s Telegram, 2636, 1
- Evans et al. (1999) Evans, I., Koratkar, A., Allen, M., Dopita, M., & Tsvetanov, Z. 1999, ApJ, 521, 531
- Evans et al. (2009) Evans, P. A., Beardmore, A. P., Page, K. L., Osborne, J. P., Burrows, D. N., & Gehrels, N. 2009, in American Institute of Physics Conference Series, Vol. 1133, American Institute of Physics Conference Series, ed. C. Meegan, C. Kouveliotou, & N. Gehrels, 46
- Feng & Soria (2011) Feng, H., & Soria, R. 2011, New Astronomy Reviews, 55, 166
- Gemini Observatory & AURA (2016) Gemini Observatory, & AURA. 2016, Gemini IRAF: Data reduction software for the Gemini telescopes, Astrophysics Source Code Library
- Gimeno et al. (2016) Gimeno, G., et al. 2016, in Proc. SPIE, Vol. 9908, Ground-based and Airborne Instrumentation for Astronomy VI, 99082S
- Heil et al. (2015a) Heil, L. M., Uttley, P., & Klein-Wolt, M. 2015a, MNRAS, 448, 3348
- Heil et al. (2015b) Heil, L. M., Uttley, P., & Klein-Wolt, M. 2015b, MNRAS, 448, 3339
- Heil et al. (2009) Heil, L. M., Vaughan, S., & Roberts, T. P. 2009, MNRAS, 397, 1061
- Hill et al. (2004) Hill, J., et al. 2004, in APS Meeting Abstracts
- Hook et al. (2004) Hook, I. M., Jørgensen, I., Allington-Smith, J. R., Davies, R. L., Metcalfe, N., Murowinski, R. G., & Crampton, D. 2004, PASP, 116, 425
- Immler et al. (2010) Immler, S., Brown, P., & Russell, B. R. 2010, The Astronomer’s Telegram, 2639, 1
- Ingram & Done (2012) Ingram, A., & Done, C. 2012, MNRAS, 419, 2369
- Kalberla et al. (2005) Kalberla, P. M. W., Burton, W. B., Hartmann, D., Arnal, E. M., Bajaja, E., Morras, R., & Pöppel, W. G. L. 2005, A&A, 440, 775
- Kallman & McCray (1982) Kallman, T. R., & McCray, R. 1982, ApJS, 50, 263
- Kewley et al. (2001) Kewley, L. J., Heisler, C. A., Dopita, M. A., & Lumsden, S. 2001, ApJS, 132, 37
- Khan et al. (2010) Khan, R., Stanek, K. Z., Kochanek, C. S., Thompson, T. A., & Prieto, J. L. 2010, The Astronomer’s Telegram, 2632, 1
- King & Lasota (2016) King, A., & Lasota, J.-P. 2016, MNRAS, 458, L10
- King (2004) King, A. R. 2004, Nuclear Physics B Proceedings Supplements, 132, 376
- King (2009) King, A. R. 2009, MNRAS, 393, L41
- Kosec et al. (2018) Kosec, P., Pinto, C., Walton, D. J., Fabian, A. C., Bachetti, M., Fürst, F., & Grefenstette, B. W. 2018, ArXiv e-prints
- Lau et al. (2016) Lau, R. M., et al. 2016, ApJ, 830, 142
- Linden et al. (2010) Linden, T., Kalogera, V., Sepinsky, J. F., Prestwich, A., Zezas, A., & Gallagher, J. S. 2010, ApJ, 725, 1984
- Lyubarskii (1997) Lyubarskii, Y. E. 1997, MNRAS, 292, 679
- Middleton et al. (2015) Middleton, M. J., Heil, L., Pintore, F., Walton, D. J., & Roberts, T. P. 2015, MNRAS, 447, 3243
- Middleton et al. (2011) Middleton, M. J., Roberts, T. P., Done, C., & Jackson, F. E. 2011, MNRAS, 411, 644
- Middleton et al. (2014) Middleton, M. J., Walton, D. J., Roberts, T. P., & Heil, L. 2014, MNRAS, 438, L51
- Monard (2010) Monard, L. A. G. 2010, Central Bureau Electronic Telegrams, 2289, 1
- Pakull & Angebault (1986) Pakull, M. W., & Angebault, L. P. 1986, Nature, 322, 511
- Pakull et al. (2006) Pakull, M. W., Grisé, F., & Motch, C. 2006, in IAU Symposium, Vol. 230, Populations of High Energy Sources in Galaxies, ed. E. J. A. Meurs & G. Fabbiano, 293
- Pakull & Mirioni (2002) Pakull, M. W., & Mirioni, L. 2002, ArXiv Astrophysics e-prints
- Pakull & Mirioni (2003) Pakull, M. W., & Mirioni, L. 2003, in Revista Mexicana de Astronomia y Astrofisica Conference Series, Vol. 15, Revista Mexicana de Astronomia y Astrofisica Conference Series, ed. J. Arthur & W. J. Henney, 197
- Poutanen et al. (2013) Poutanen, J., Fabrika, S., Valeev, A. F., Sholukhova, O., & Greiner, J. 2013, MNRAS, 432, 506
- Poutanen et al. (2007) Poutanen, J., Lipunova, G., Fabrika, S., Butkevich, A. G., & Abolmasov, P. 2007, MNRAS, 377, 1187
- Prieto et al. (2010) Prieto, J. L., Bond, H. E., Kochanek, C. S., Khan, R., Stanek, K. Z., & Thompson, T. A. 2010, The Astronomer’s Telegram, 2660, 1
- Remillard & McClintock (2006) Remillard, R. A., & McClintock, J. E. 2006, ARA&A, 44, 49
- Schlafly & Finkbeiner (2011) Schlafly, E. F., & Finkbeiner, D. P. 2011, ApJ, 737, 103
- Shakura & Sunyaev (1973) Shakura, N. I., & Sunyaev, R. A. 1973, A&A, 24, 337
- Sutherland & Dopita (1993) Sutherland, R. S., & Dopita, M. A. 1993, ApJS, 88, 253
- Sutton et al. (2013) Sutton, A. D., Roberts, T. P., & Middleton, M. J. 2013, MNRAS, 435, 1758
- Takeuchi et al. (2013) Takeuchi, S., Ohsuga, K., & Mineshige, S. 2013, PASJ, 65, 88
- Takeuchi et al. (2014) Takeuchi, S., Ohsuga, K., & Mineshige, S. 2014, PASJ, 66, 48
- Tarter et al. (1969) Tarter, C. B., Tucker, W. H., & Salpeter, E. E. 1969, ApJ, 156, 943
- van der Klis (1989) van der Klis, M. 1989, ARA&A, 27, 517
- Villar et al. (2016) Villar, V. A., et al. 2016, ApJ, 830, 11
- Voss et al. (2011) Voss, R., Nielsen, M. T. B., Nelemans, G., Fraser, M., & Smartt, S. J. 2011, MNRAS, 418, L124
- Walton et al. (2018) Walton, D. J., et al. 2018, ApJ, 857, L3
- Wiktorowicz et al. (2017) Wiktorowicz, G., Sobolewska, M., Lasota, J.-P., & Belczynski, K. 2017, ApJ, 846, 17
- Yang et al. (2011) Yang, L., Feng, H., & Kaaret, P. 2011, ApJ, 733, 118