Study of the molecular gas towards the N11 region in the Large Magellanic Cloud
Abstract
We study three subregions in the HII region N11 which is located at the northeast side of the Large Magellanic Cloud (LMC). We used 12CO and 13CO J=3–2 data observed with the Atacama Submillimeter Telescope Experiment (ASTE) with an angular and spectral resolution of 22′′ and 0.11 km s-1 respectively. From the 12CO J=3–2 and 13CO J=3–2 integrated maps we estimated, assuming local thermodynamic equilibrium (LTE), masses in about M⊙ for the molecular clouds associated with each subregion. Additionally, from the mentioned maps we study the 12CO /13CO integrated ratios for each subregion, obtaining values between 8 and 10.
Resumen
Estudiamos tres subregiones en la región HII N11, la cual está ubicada en la parte noreste de la Nube Mayor de Magallanes. Usamos datos del 12CO y 13CO J=3–2 obtenidos con el Atacama Submillimeter Telescope Experiment (ASTE) con una resolución angular y espectral de 22′′ y 0.11 km s-1 respectivamente. De los mapas de la emisión integrada del 12CO y 13CO estimamos las masas considerando equilibrio termodinámico local (LTE), obteniendo M⊙ para las nubes moleculares asociadas a cada subregión. Adicionalmente usando los mapas mencionados se estudiaron los cocientes 12CO/13CO de las líneas integradas para cada subregión, obteniéndose valores entre 8 y 10.
1 Introduction
The Magalleanic Clouds are excellent laboratories to study star formation on different conditions from the Milky Way. In the Large Magellanic Cloud (LMC), the metalicity is Z 0.5Z⊙ (Keller and Wood, 2006) and the gas-to-dust ratio is a factor of 4 higher than in our galaxy. LMC is located at 50 kpc from us (Persson et al., 2004), and is seen nearly face-on with an inclination angle of 35∘.
The N11 complex, at the northeast side of the LMC, is one of the most important star forming regions in that galaxy. It has a ring morphology with a central cavity with 170 pc in diameter. This region was previously studied by (Herrera and Rubio, 2013), using 12CO J=1-0 and 12CO J=2-1 lines.
2 Observations
The observations of the 12CO =3–2 emission line were performed in October 2014 and the 13CO =3–2 in August 2015 with the 10 m ASTE telescope. We used the CATS345 GHz band receiver, a two single-band SIS receiver, which is remotely tunable in the LO frequency range of 324-372 GHz. The XF digital spectrometer was set to a bandwidth and spectral resolution of 128 MHz and 125 kHz. The spectral velocity resolution was 0.11 km s-1 and the half-power beamwidth (HPBW) was 22′′ at 345 GHz. The system temperature was in the range 150 to 250 K and the main beam efficiency was . The data were reduced with NOSTAR and the spectra processed using the XSpec software package. The typical rms noise levels are: 0.17 K and 0.11 K for the 12CO and 13CO data, respectively.
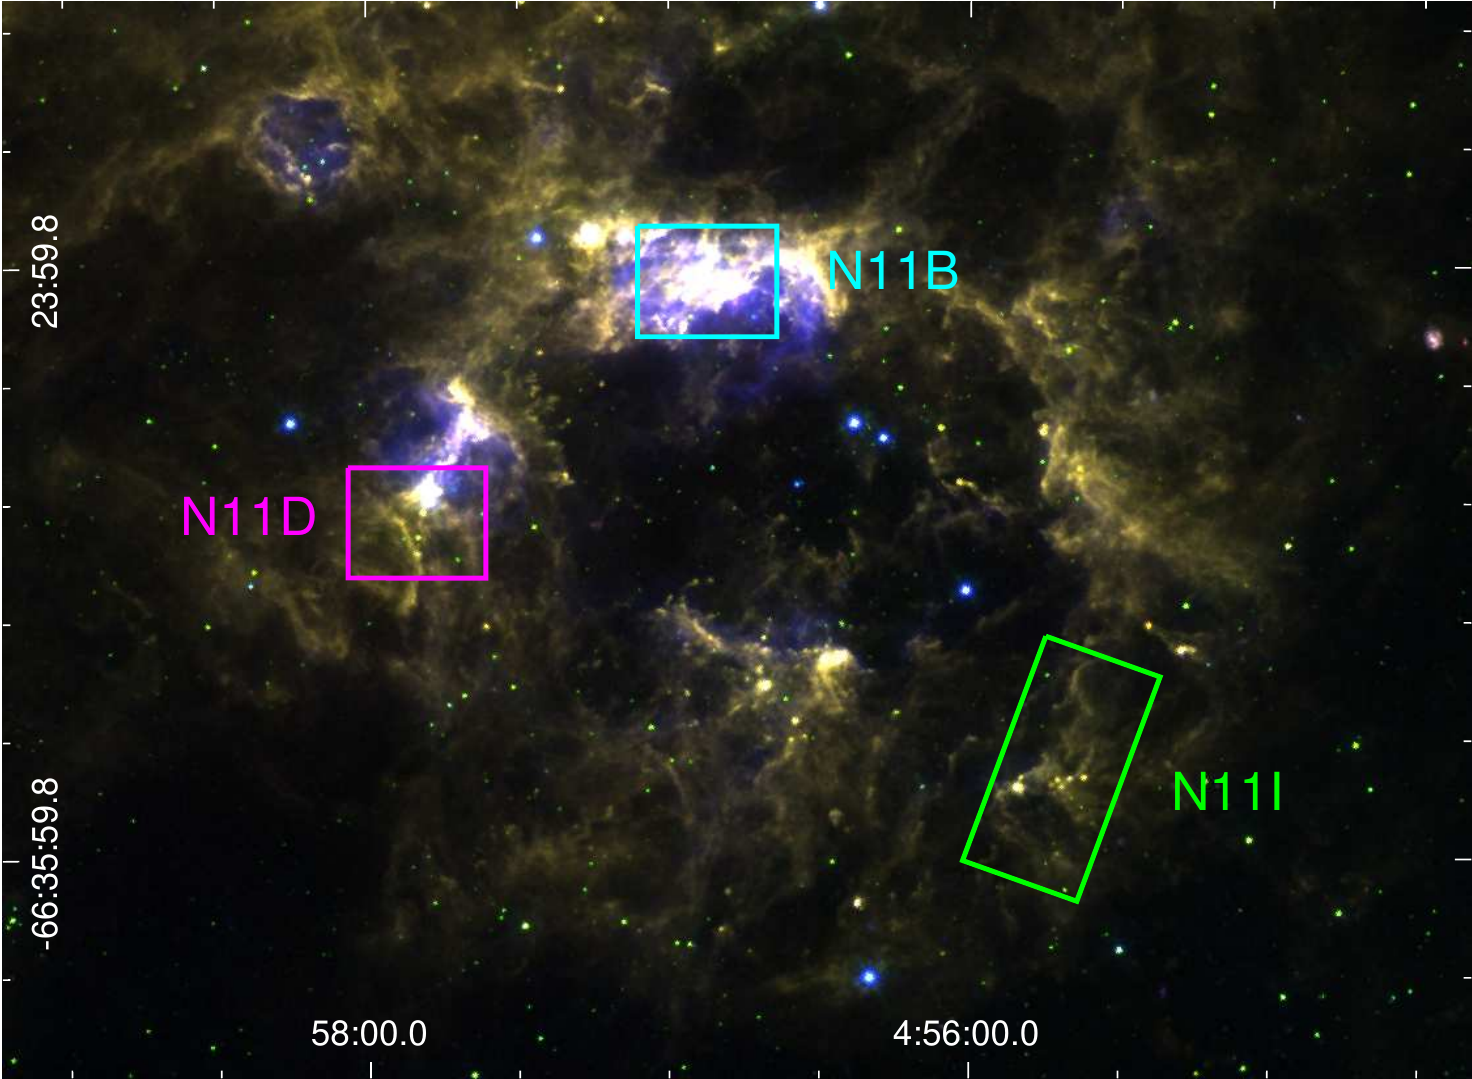
Figure 1 shows the N11 region displayed in a three-colour image, in which the 4.5, 5.8, and 8 m emission obtained from IRAC-Spitzer are presented in blue, green, and red, respectively. The rectangles represent the regions observed with ASTE: N11B, N11D, and N11I in cyan, magenta, and green boxes, respectively.
3 Results
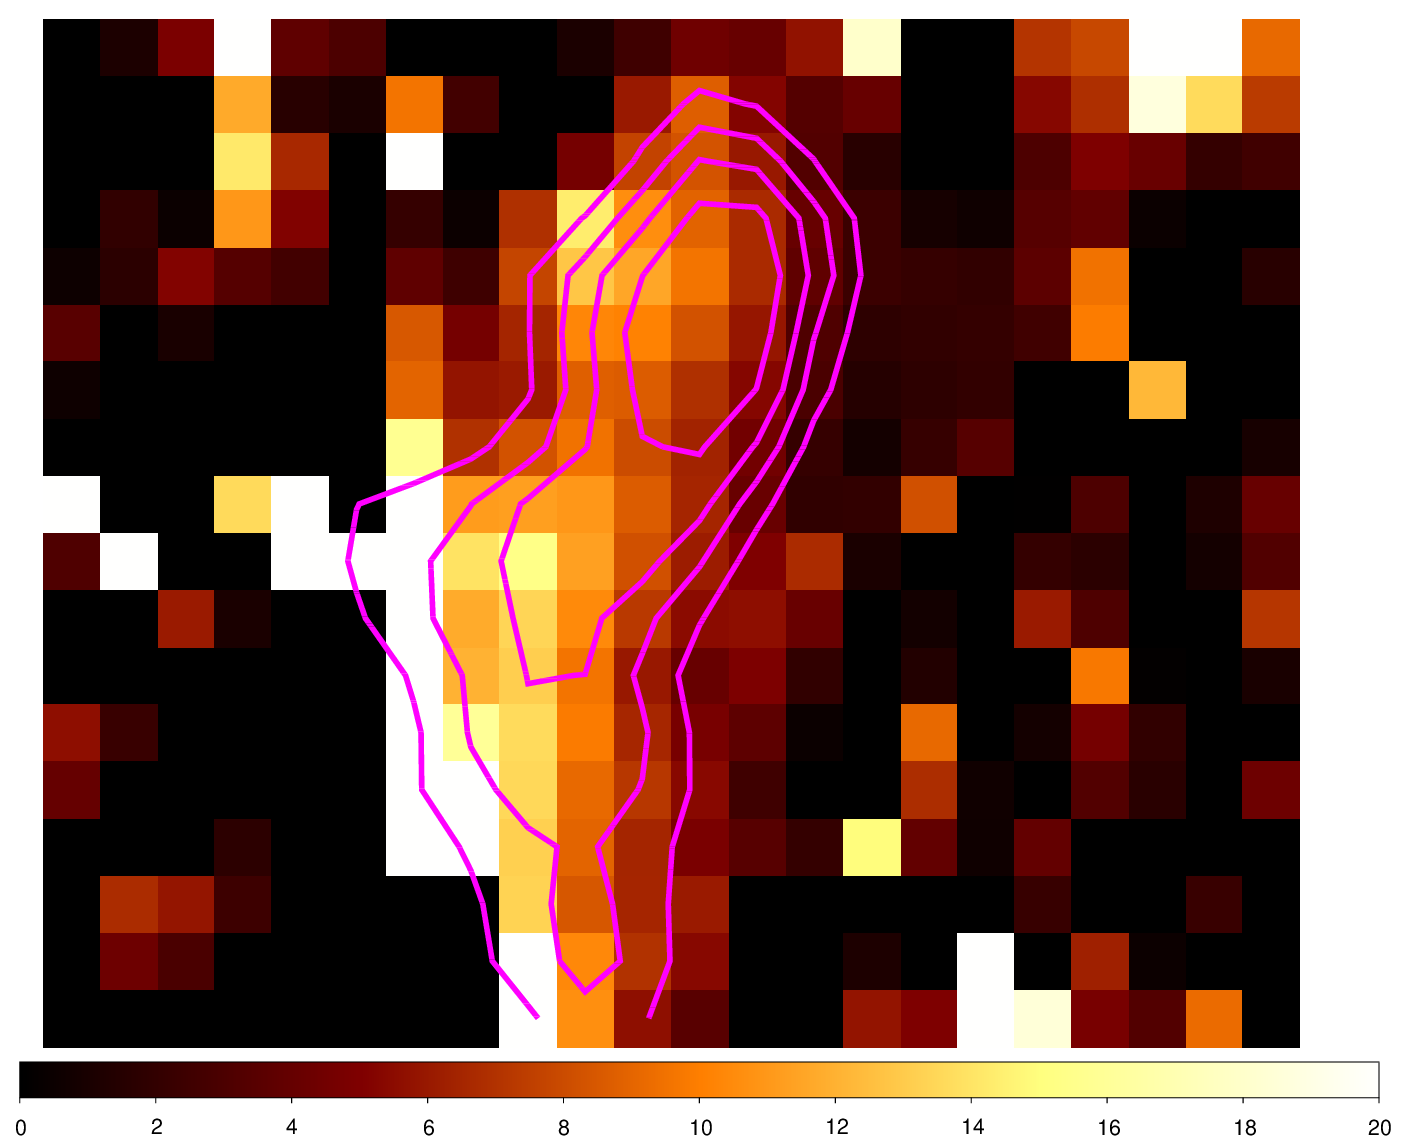
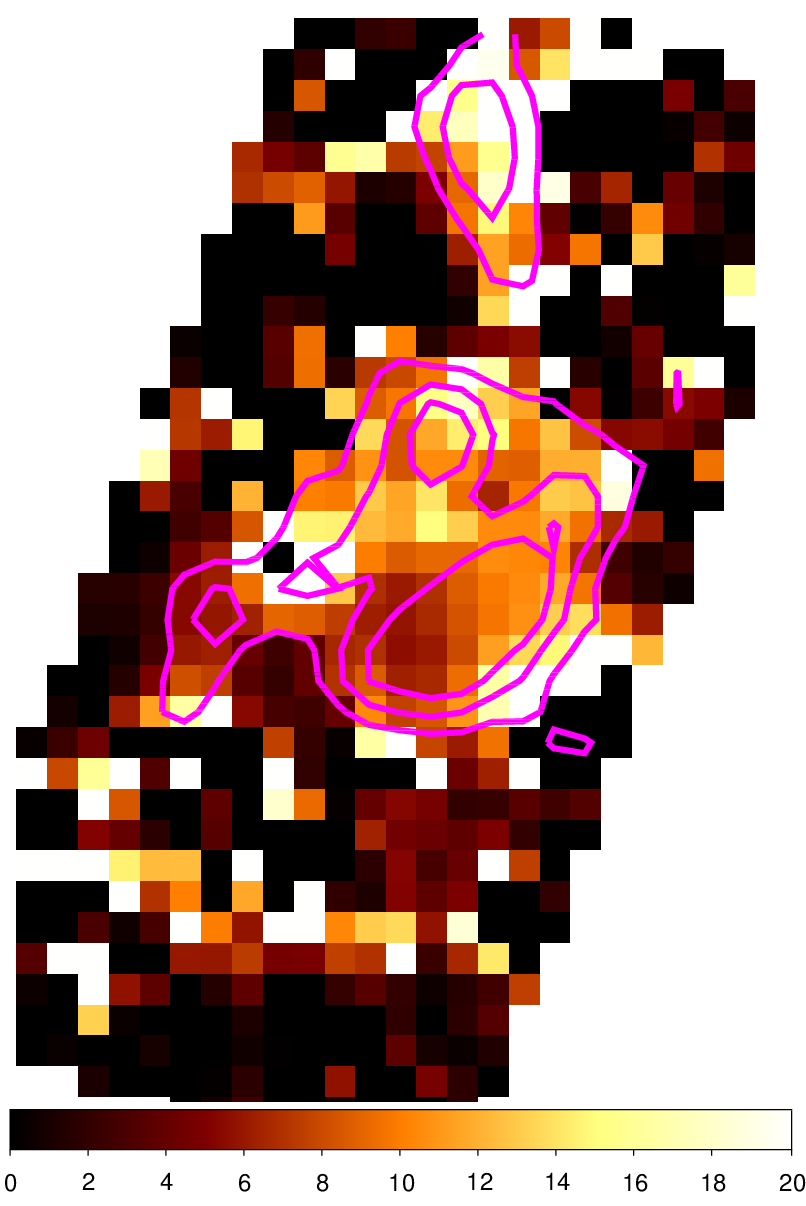
As shown in Figure 1 three subregions were studied towards N11. N11B have a size of about 5 pc and it is excited by the OBLH10 star cluster. The observed area was 140110′′. N11D, which is being excited by the OBLH13 star cluster, has a size of about 9 pc and the observed area was 130100′′. Finally, it was observed an area of 80230′′ towards N11I, which has a size of about 10 pc and none star cluster is related to it. Figures 2, 3 and 4 show the 12CO and 13CO J=3–2 integrated between 275 and 295 km s-1 for each region, respectively.
As a first result we observe a good morphological and spectral correspondence between the 12CO J=2–1 emission mapped by Herrera and Rubio (2013) and the 12CO and 13CO J=3–2 presented here. This allow us to perform a detailed multiline analysis of the CO emission towards the region (work in preparation).
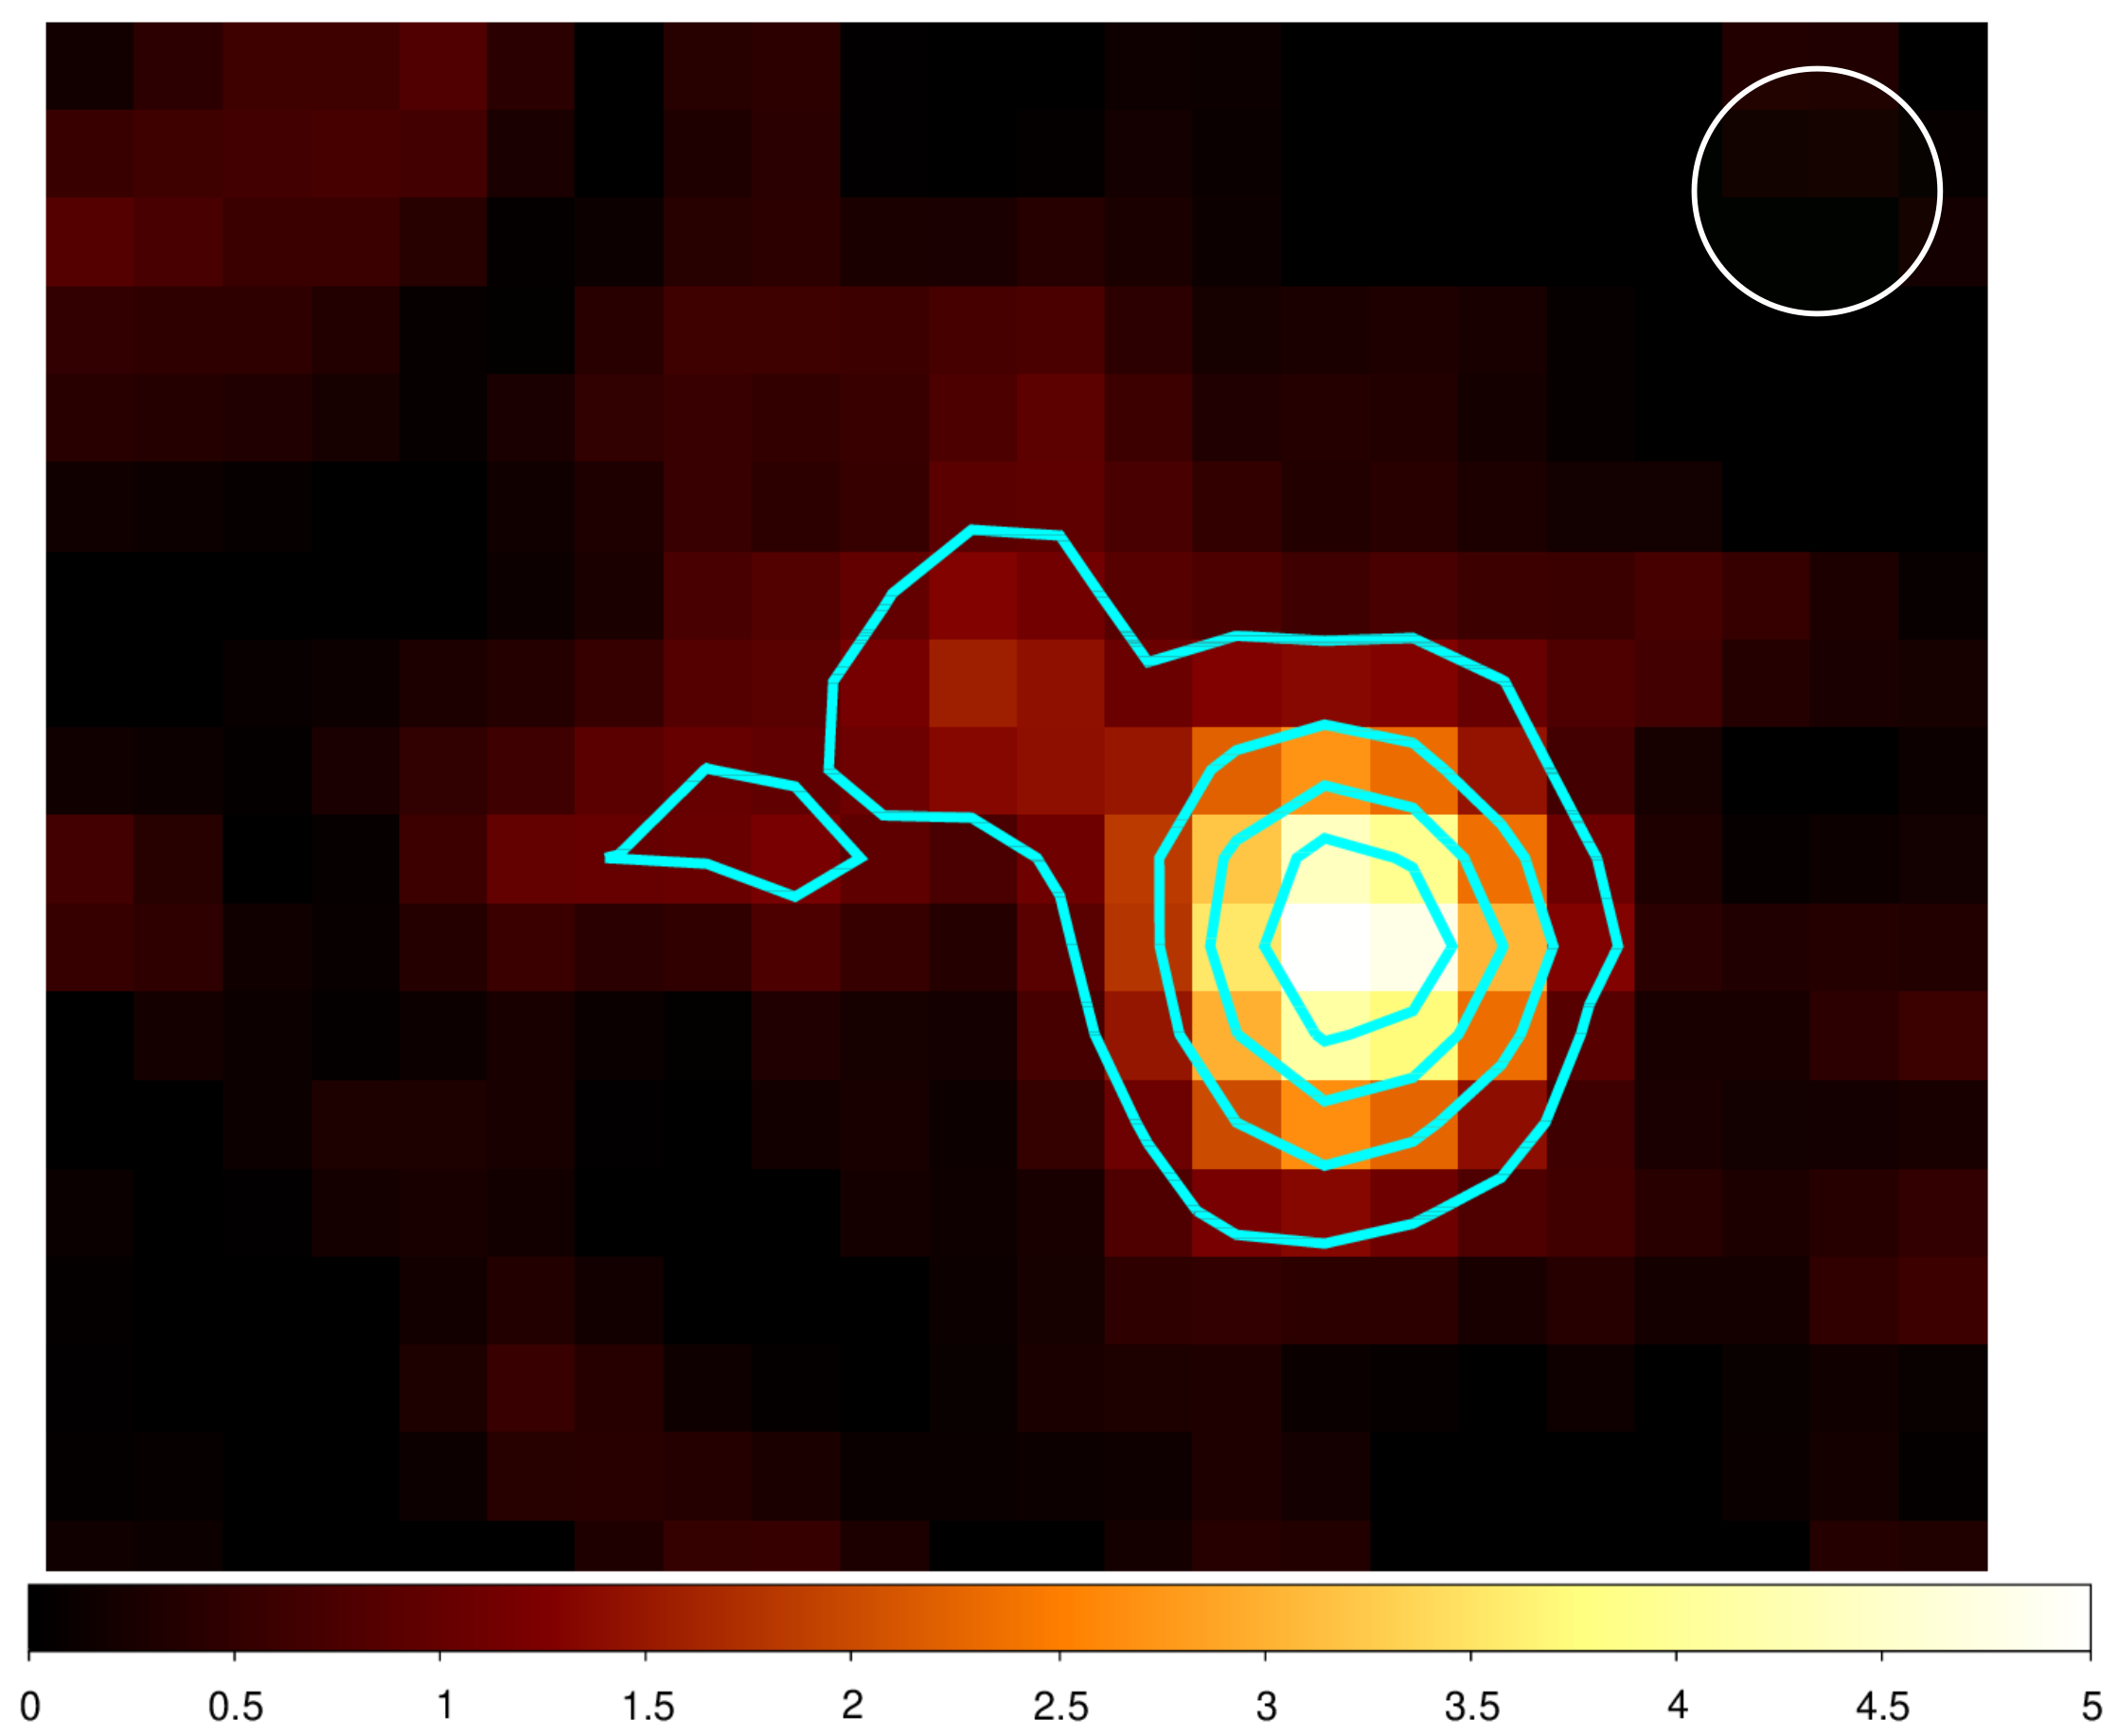
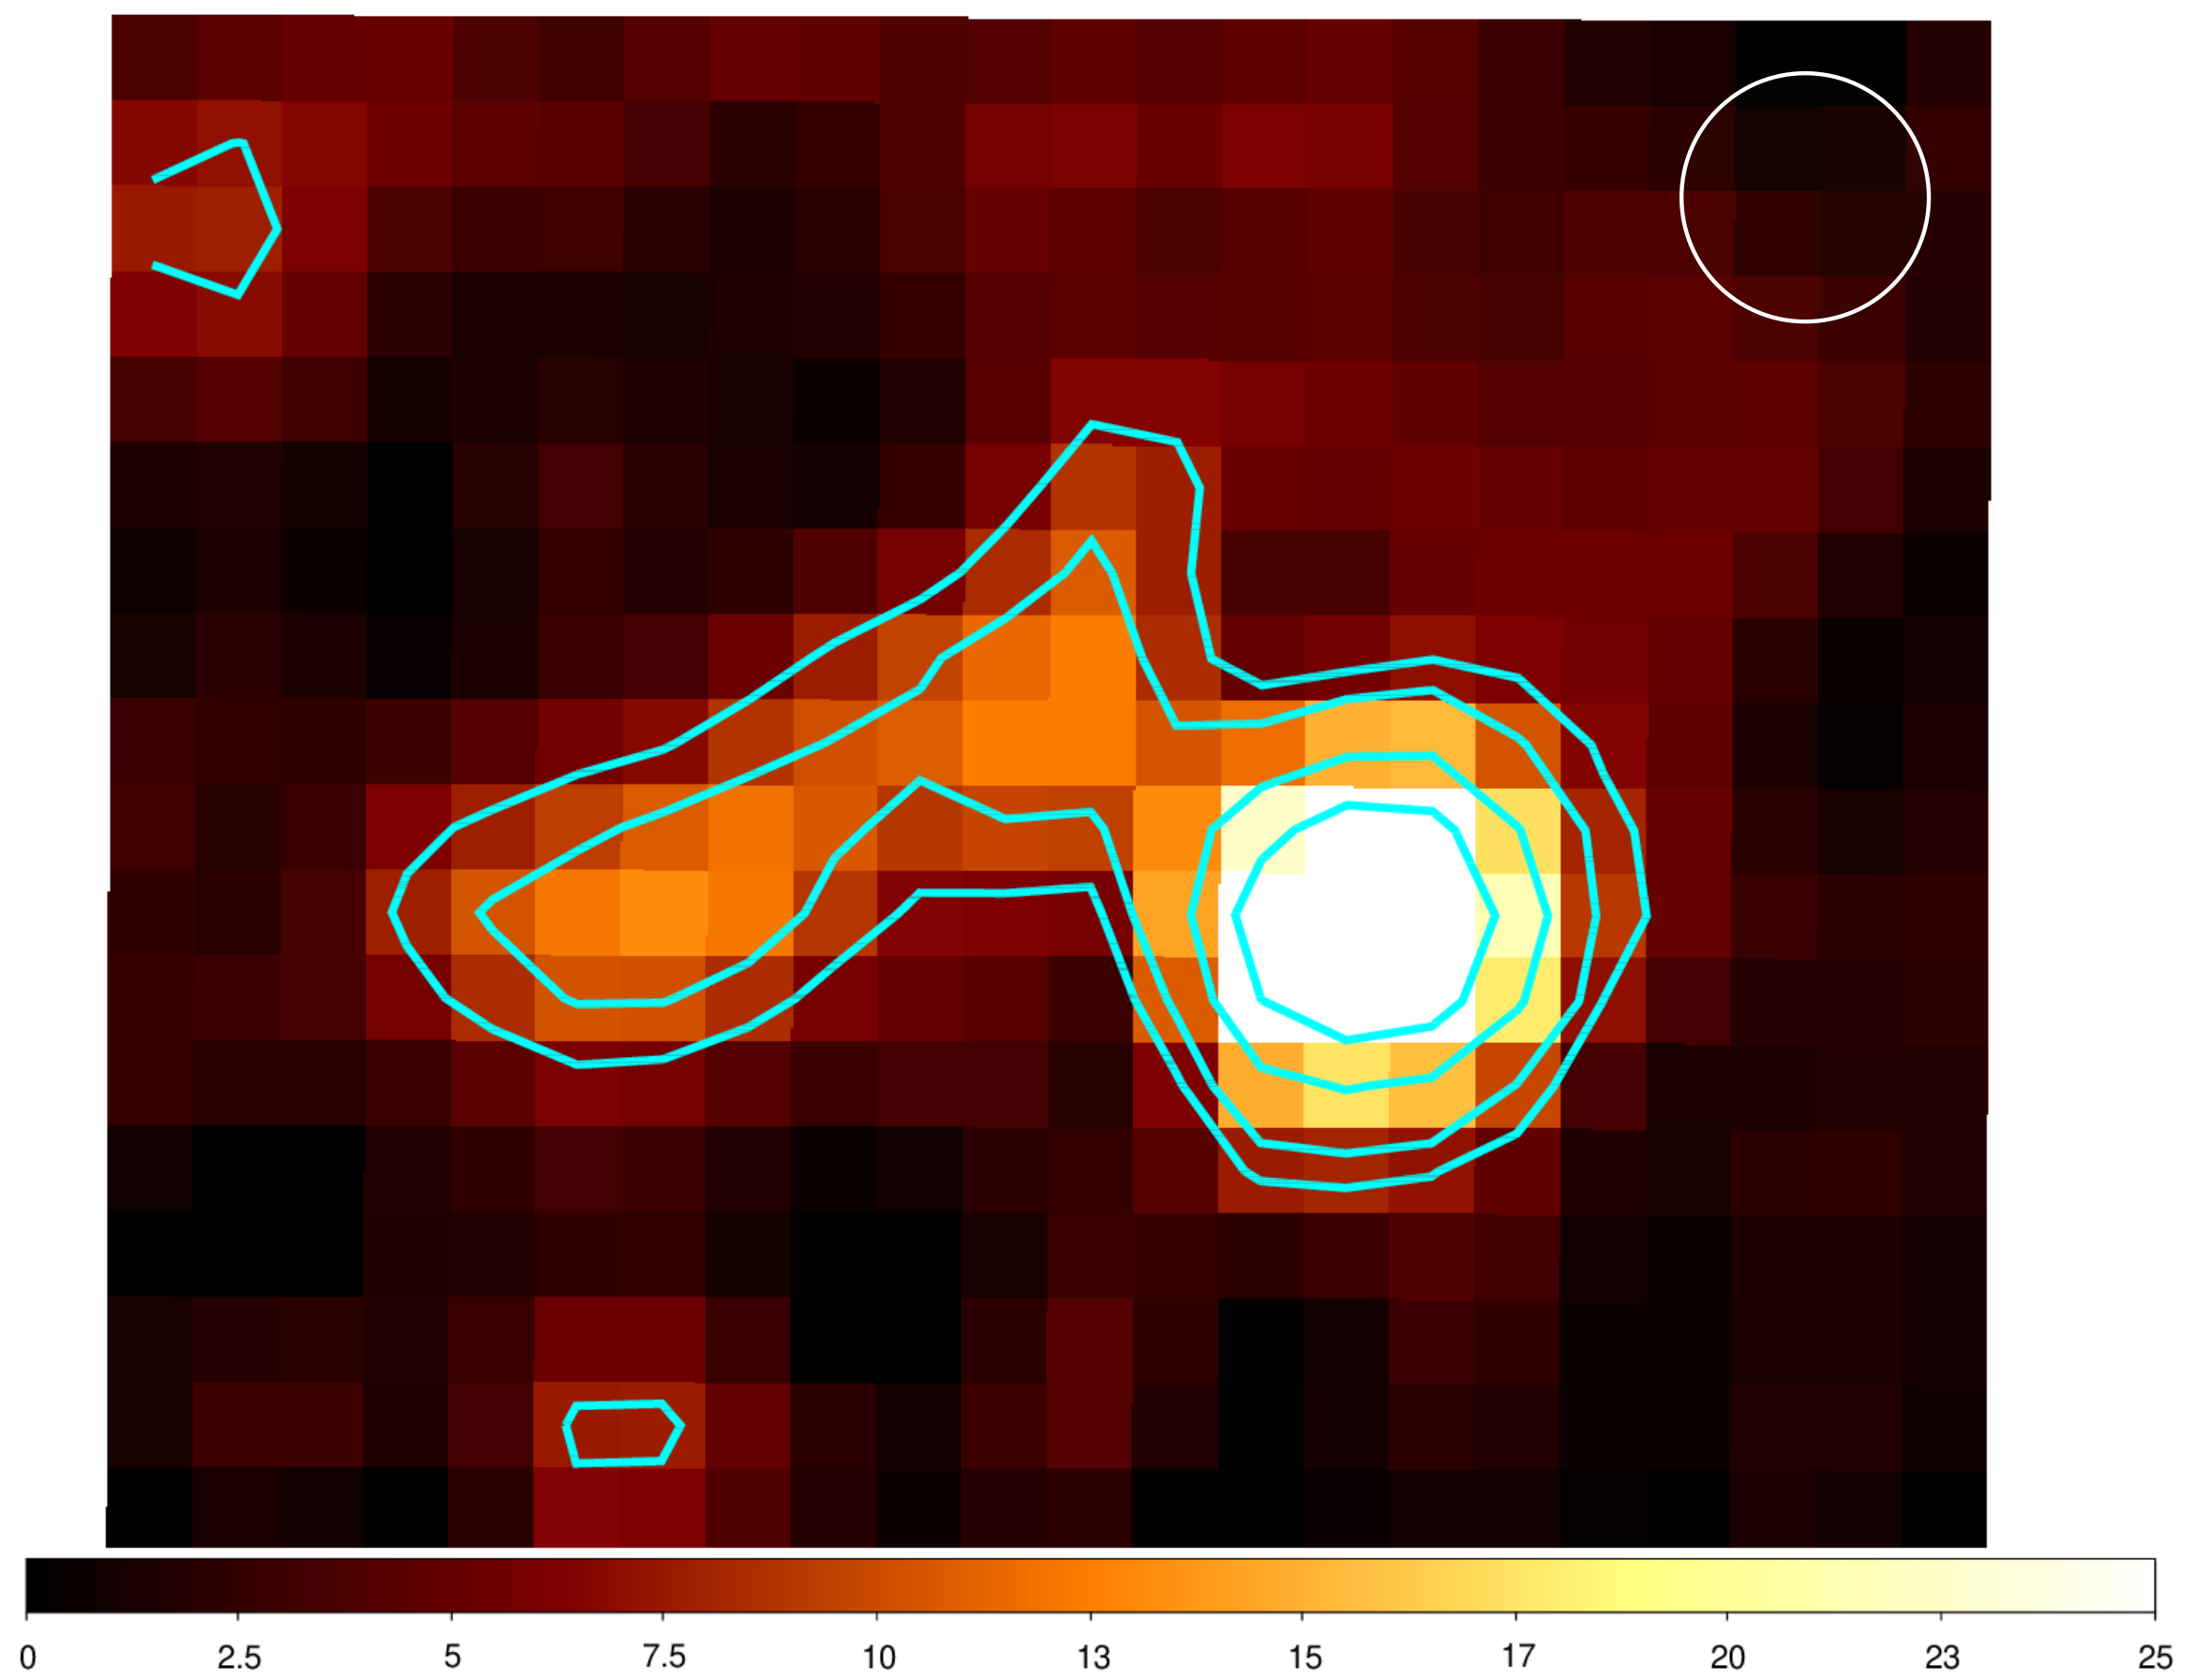
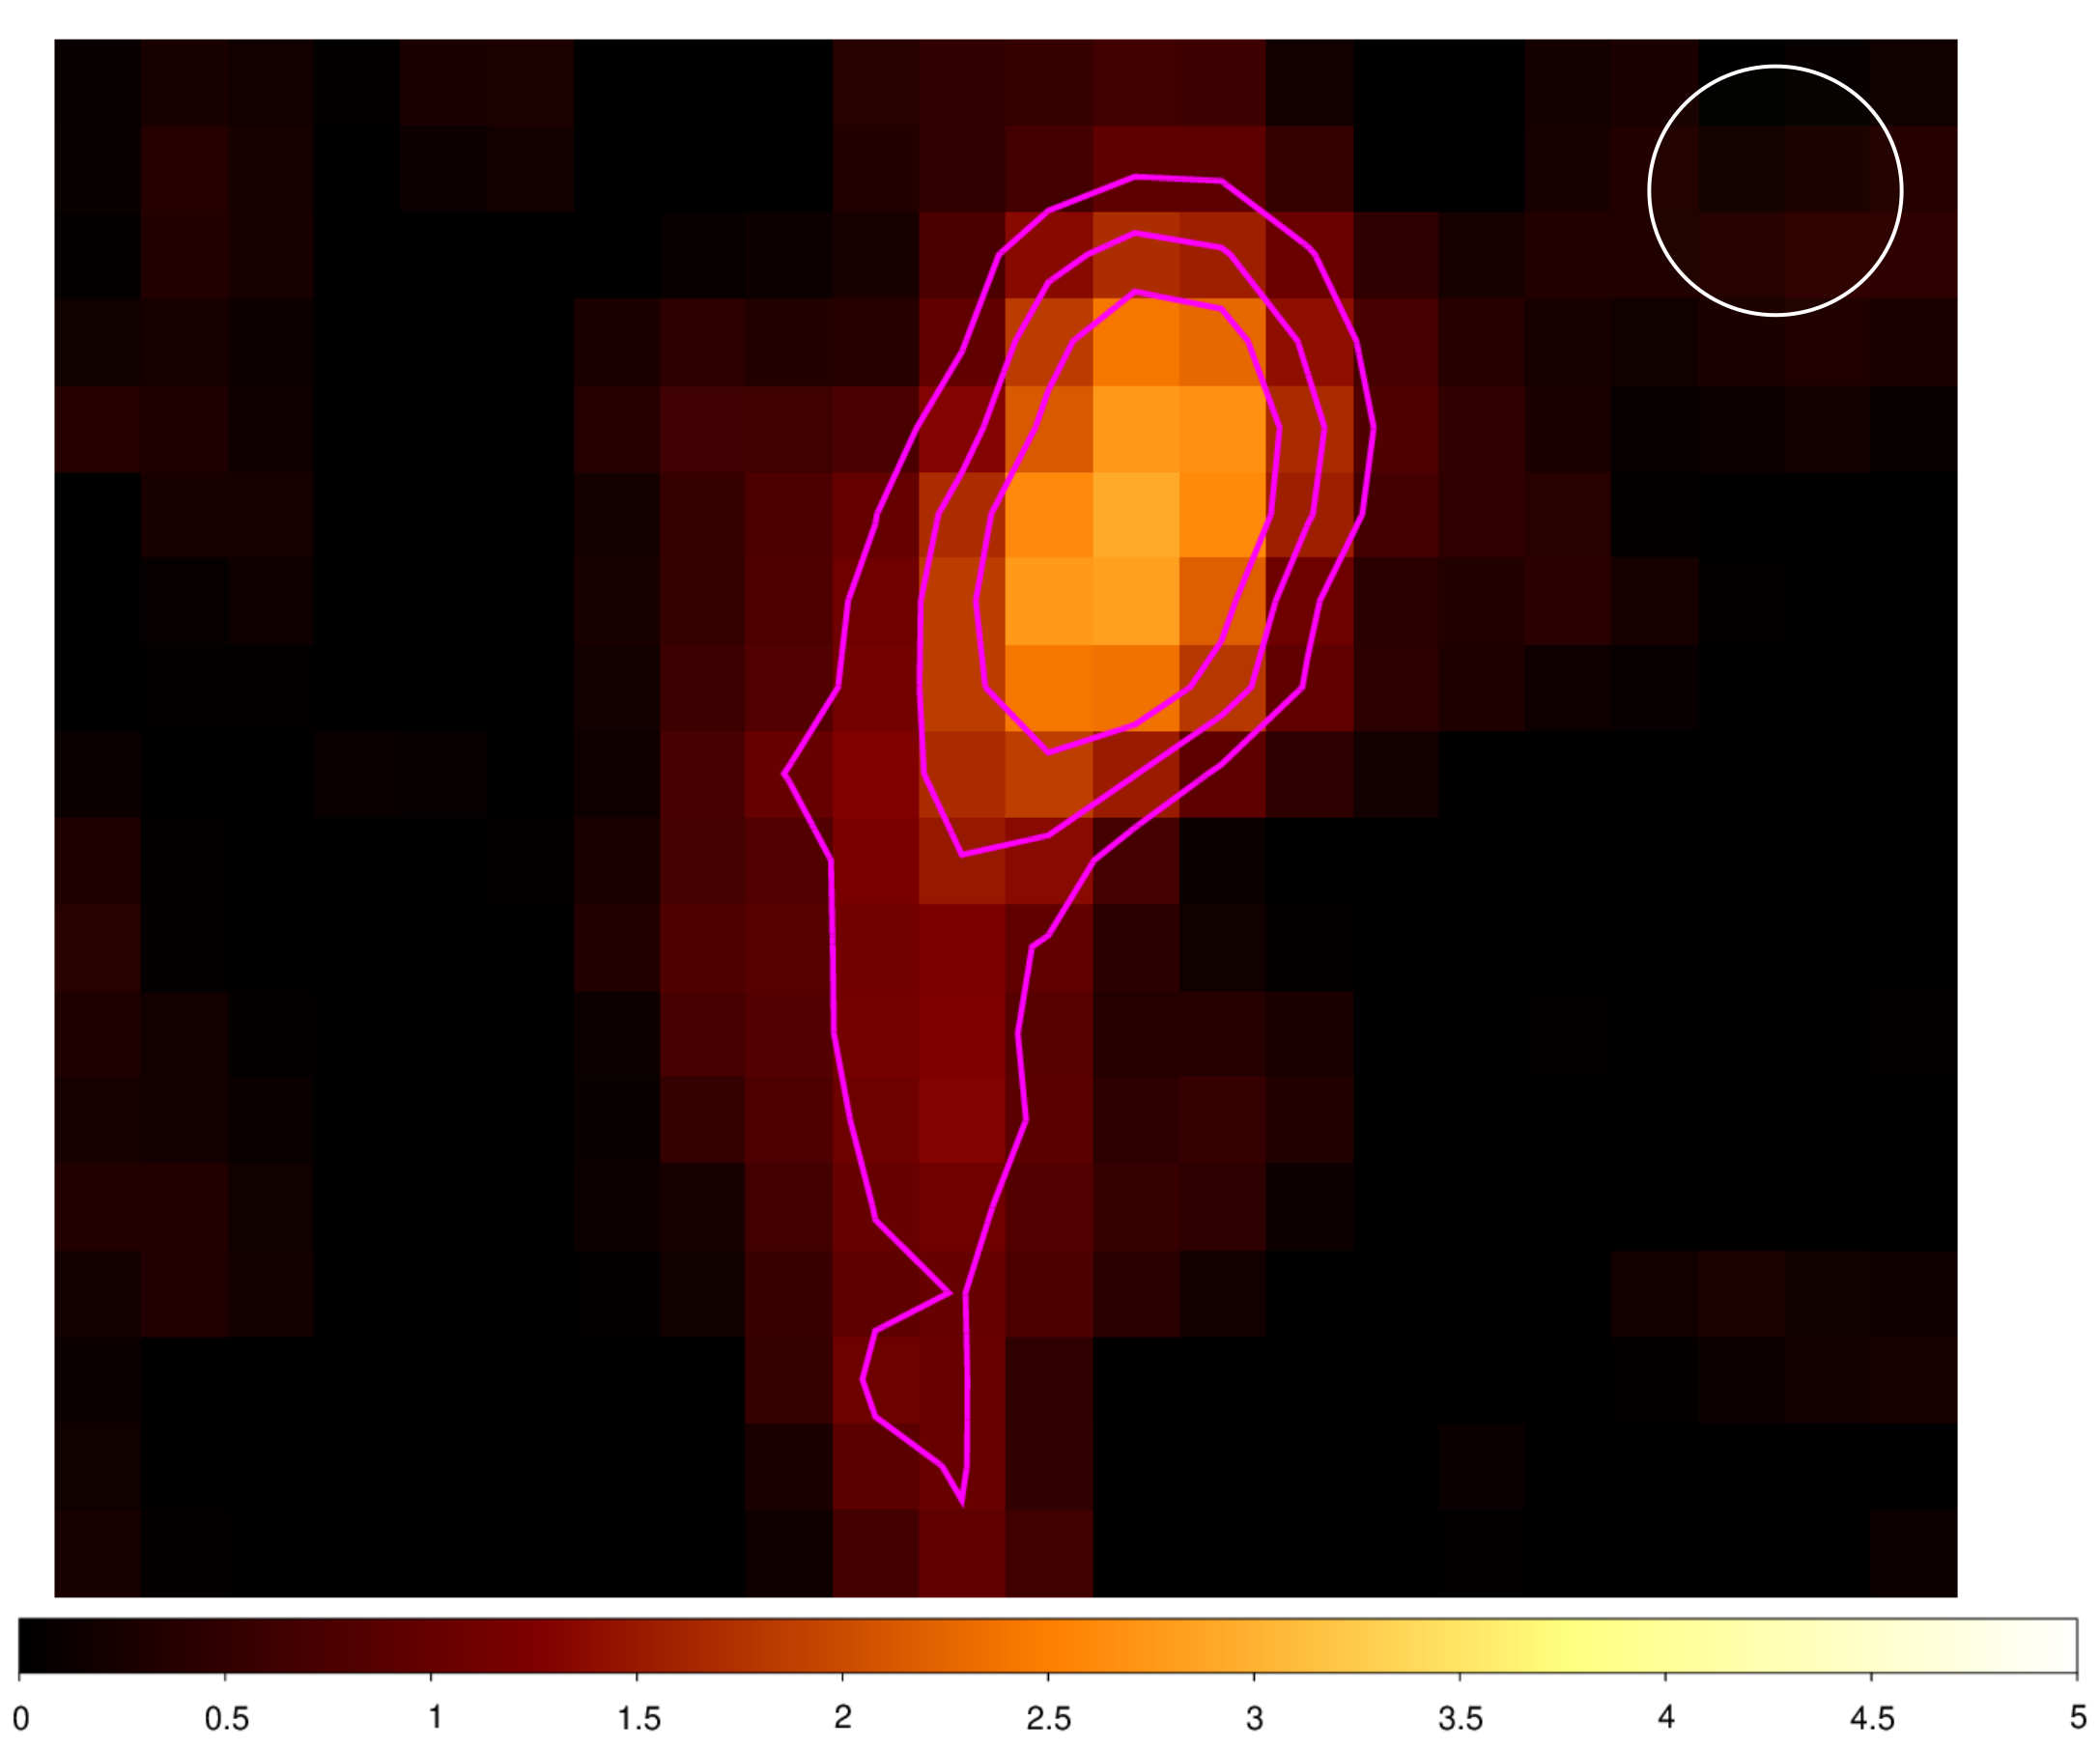
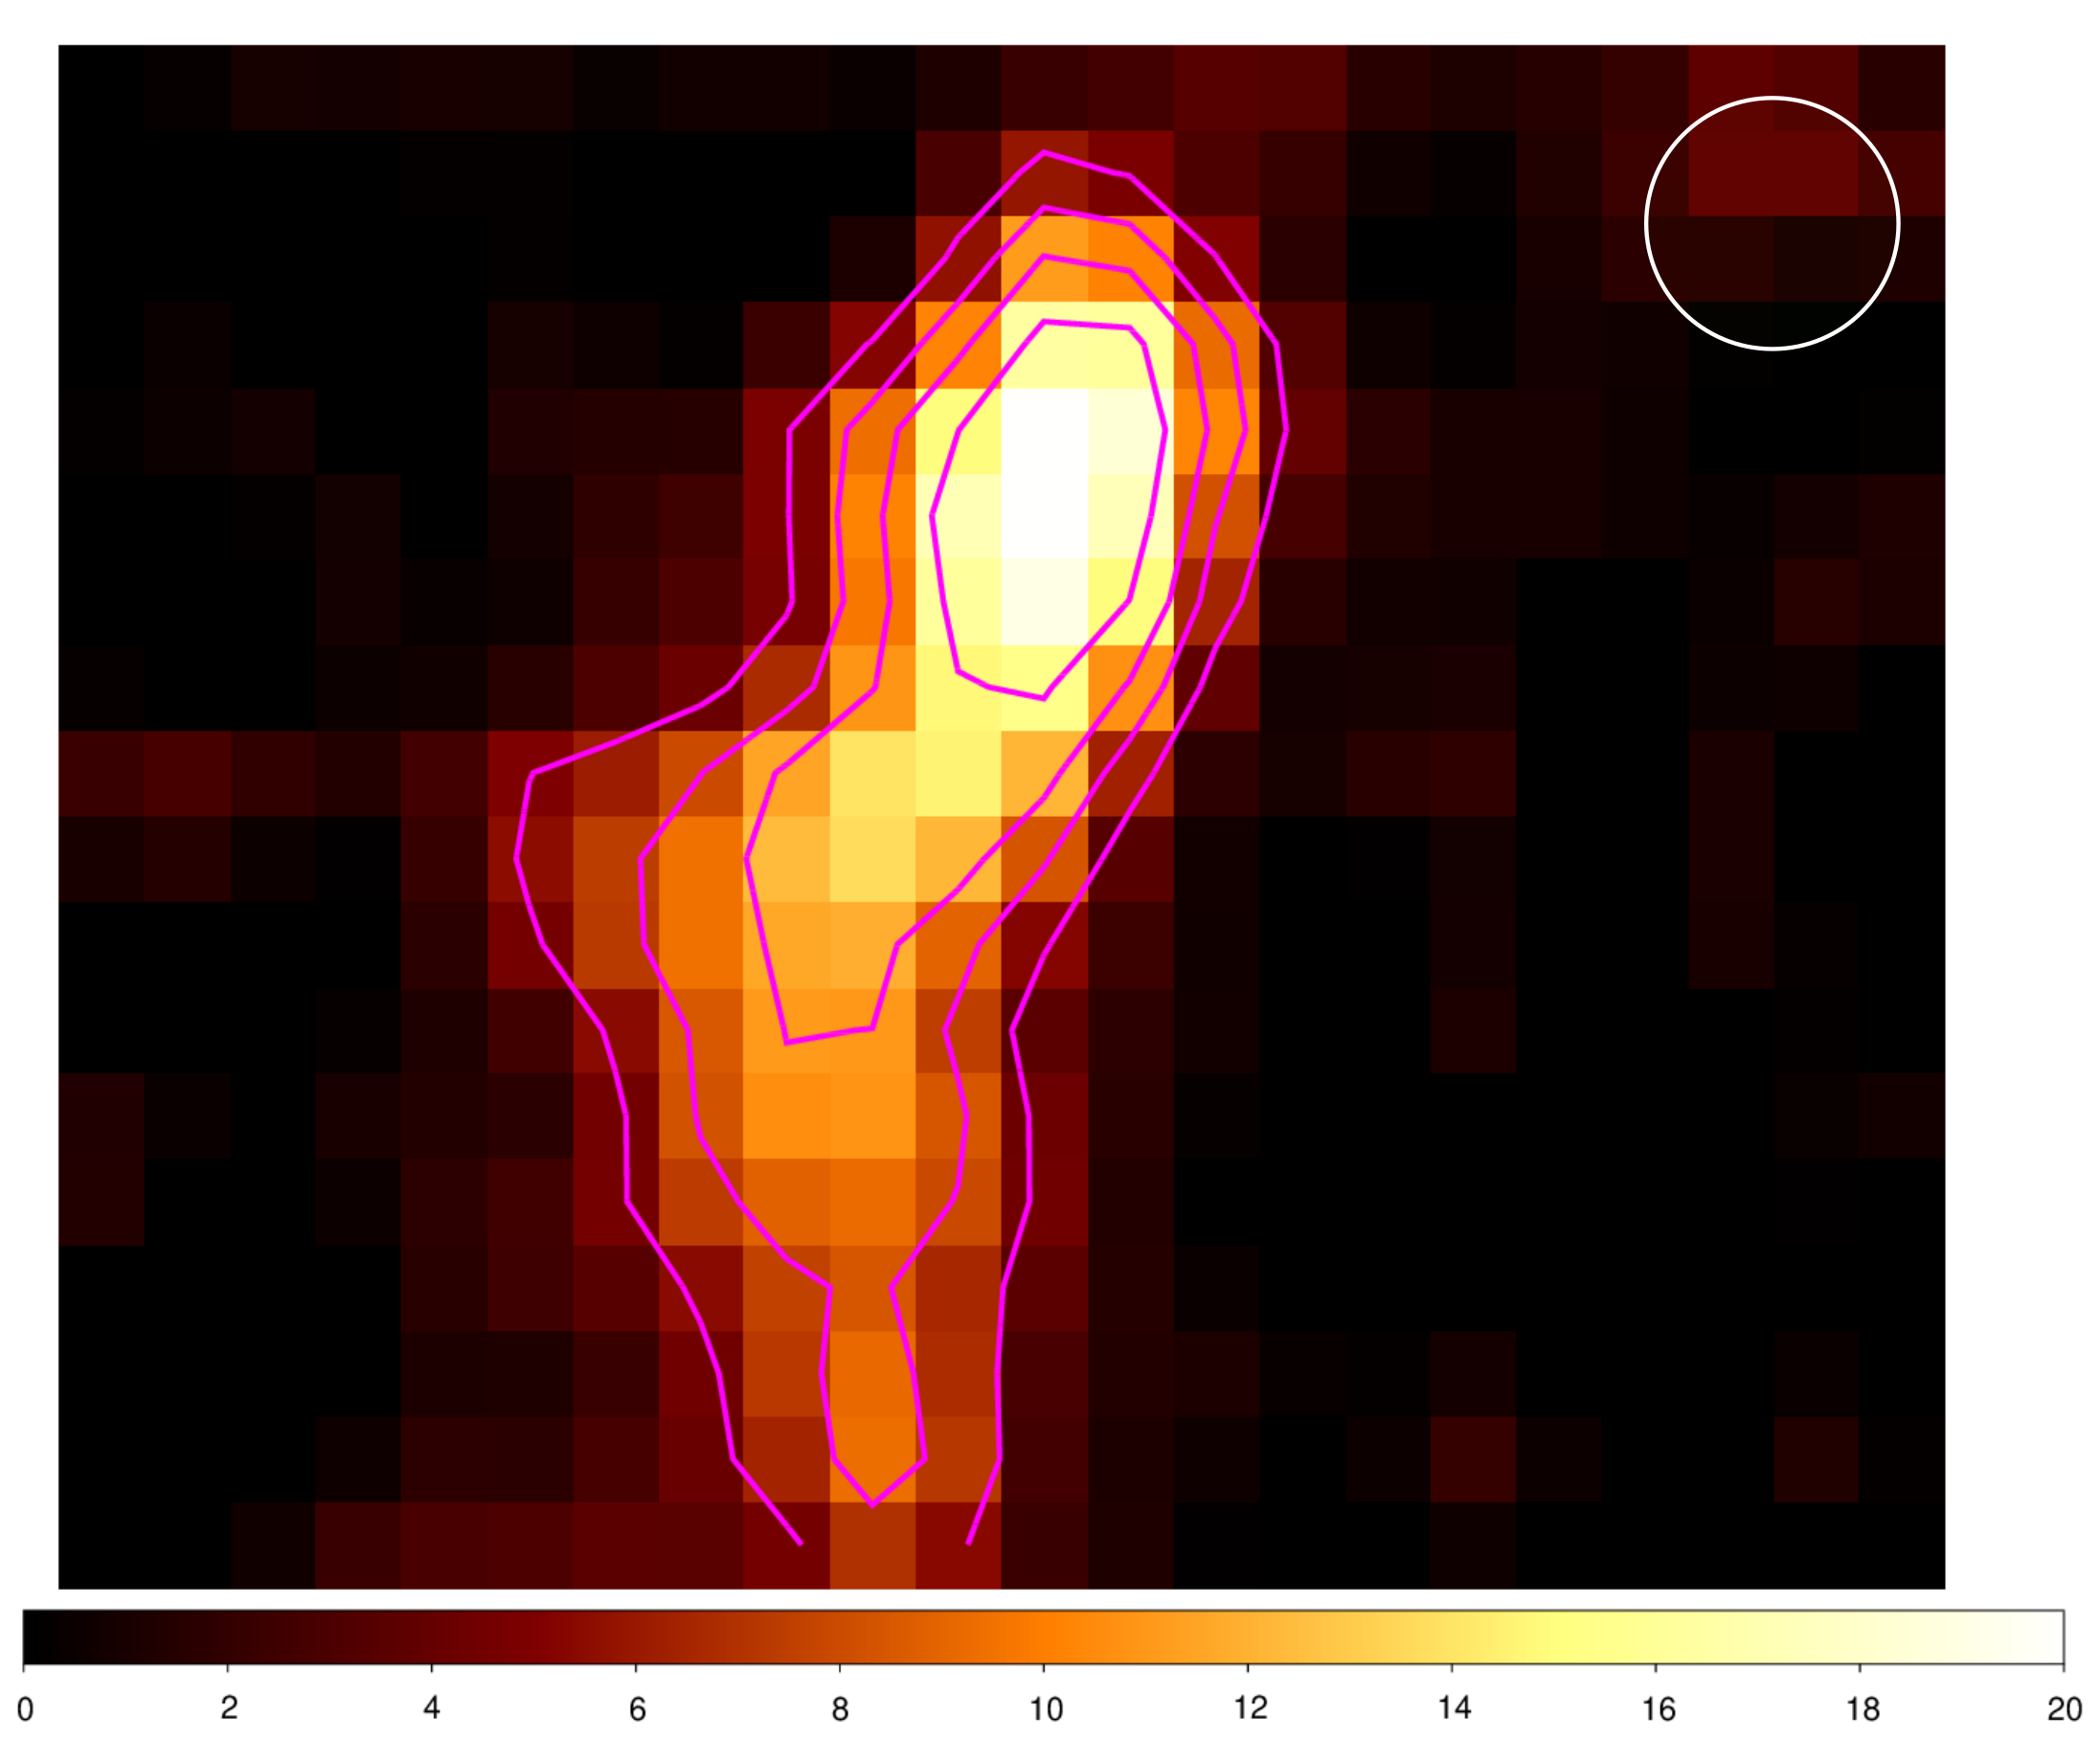
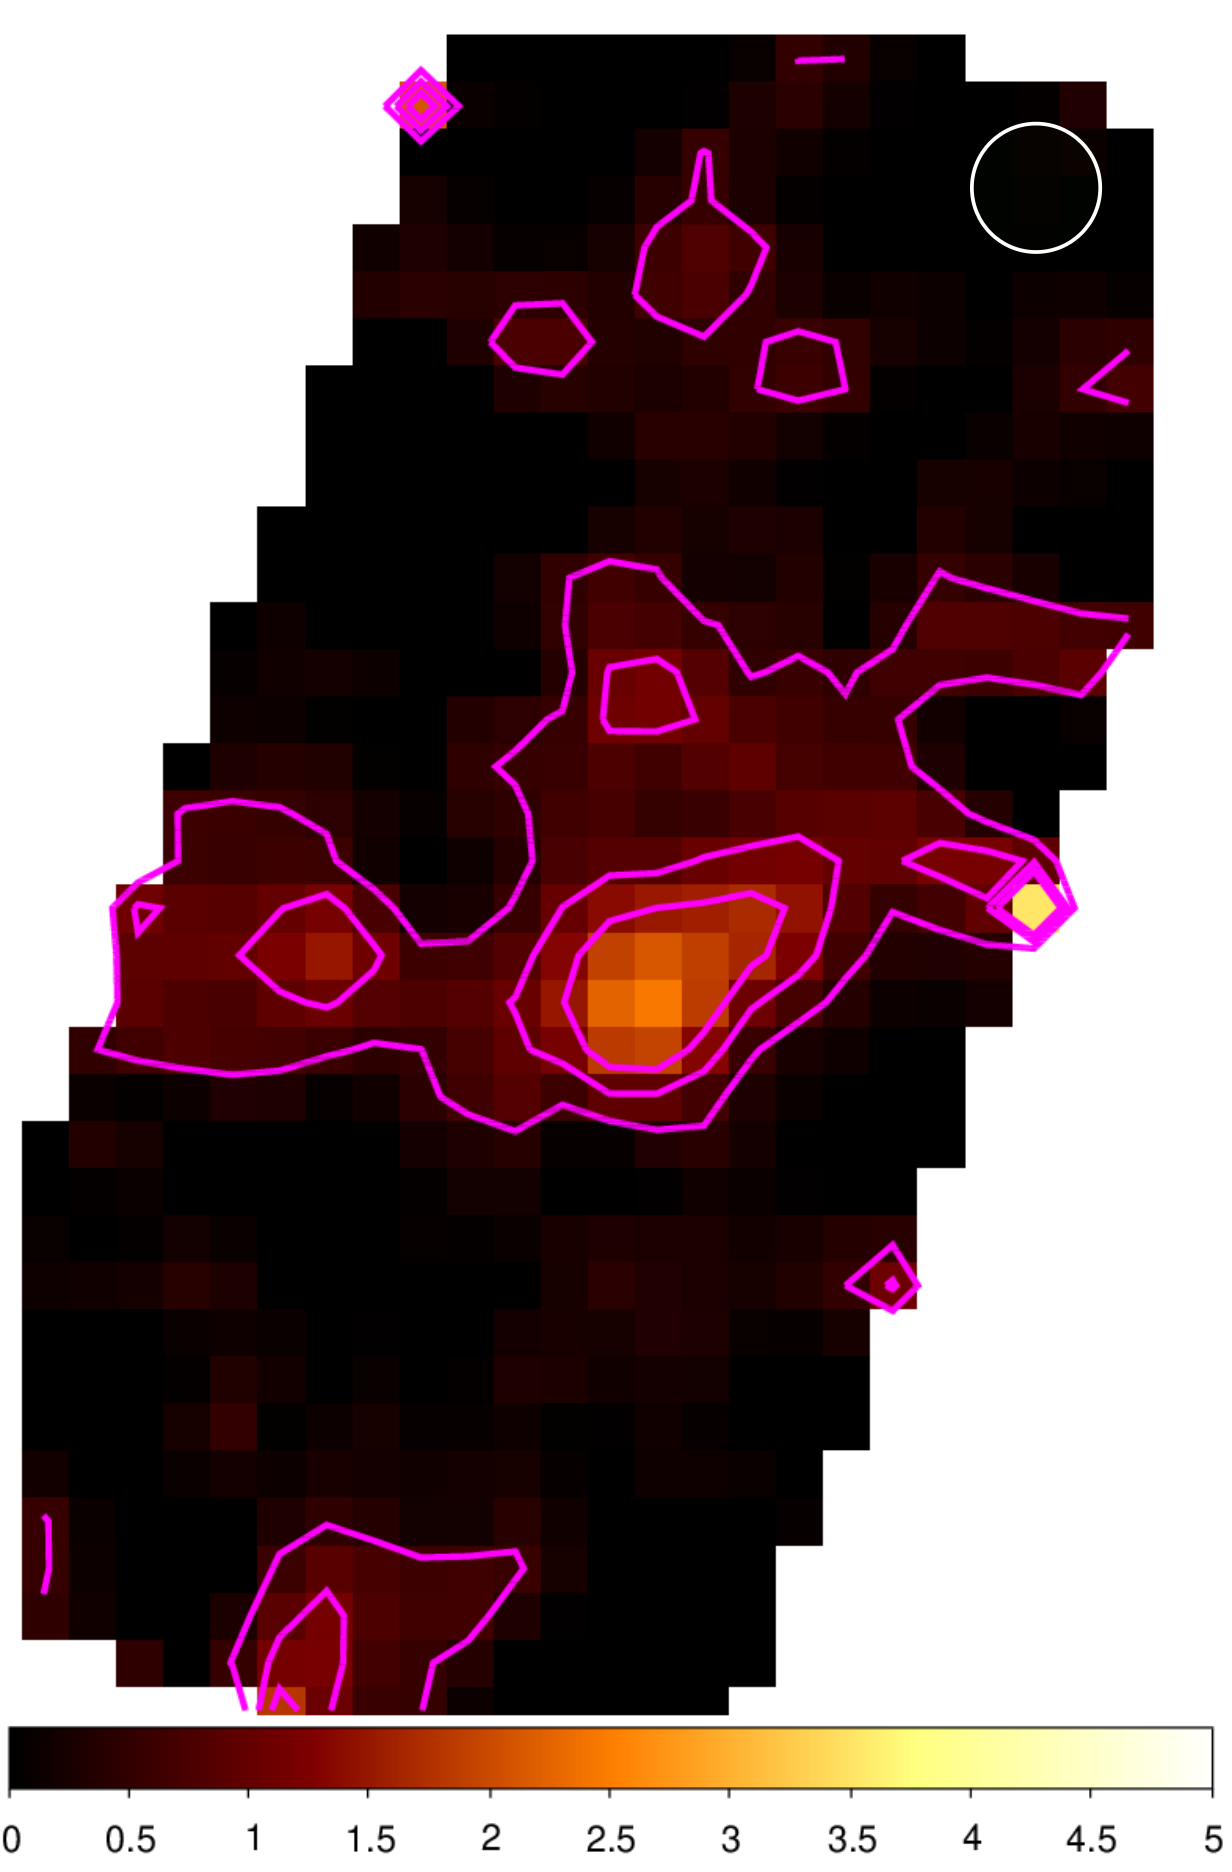
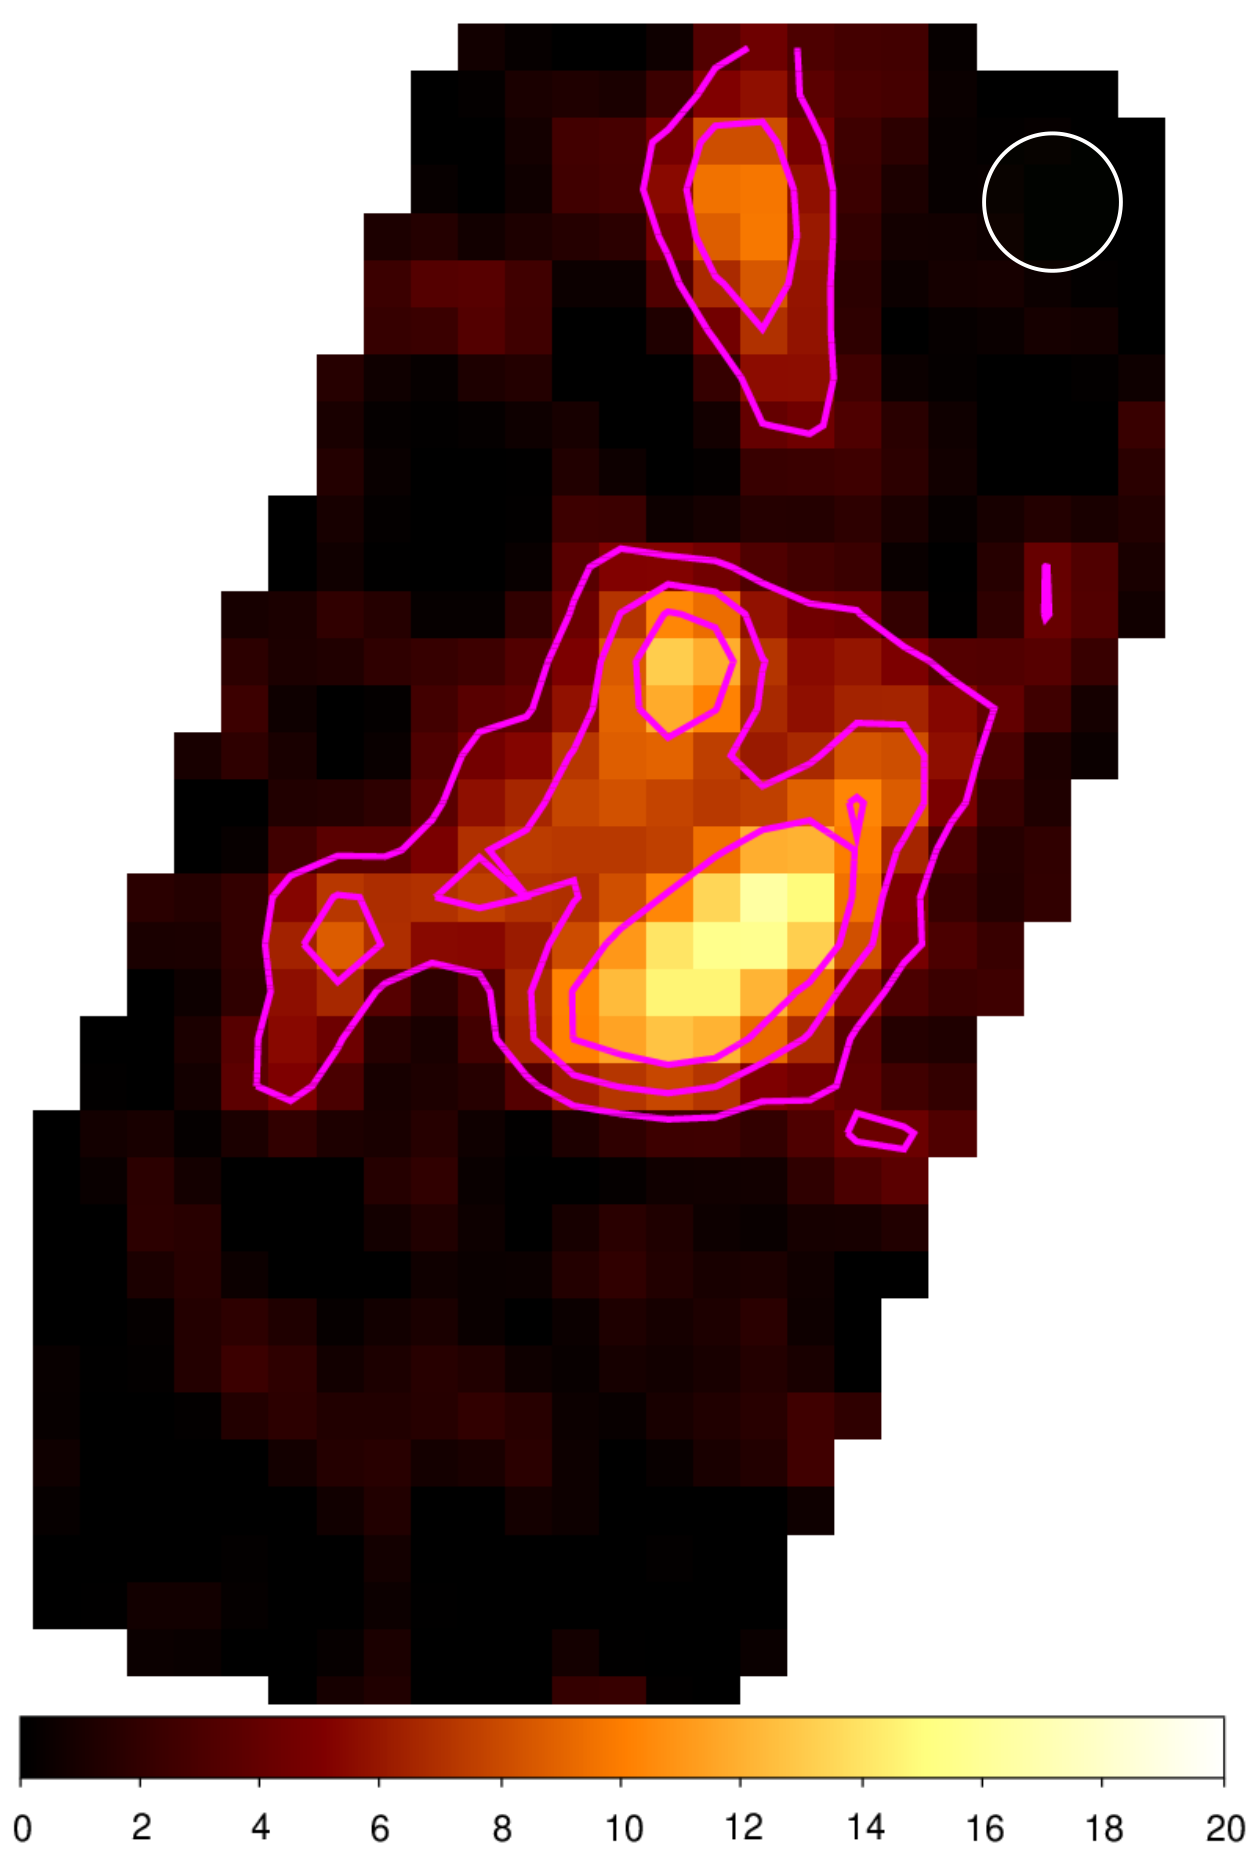
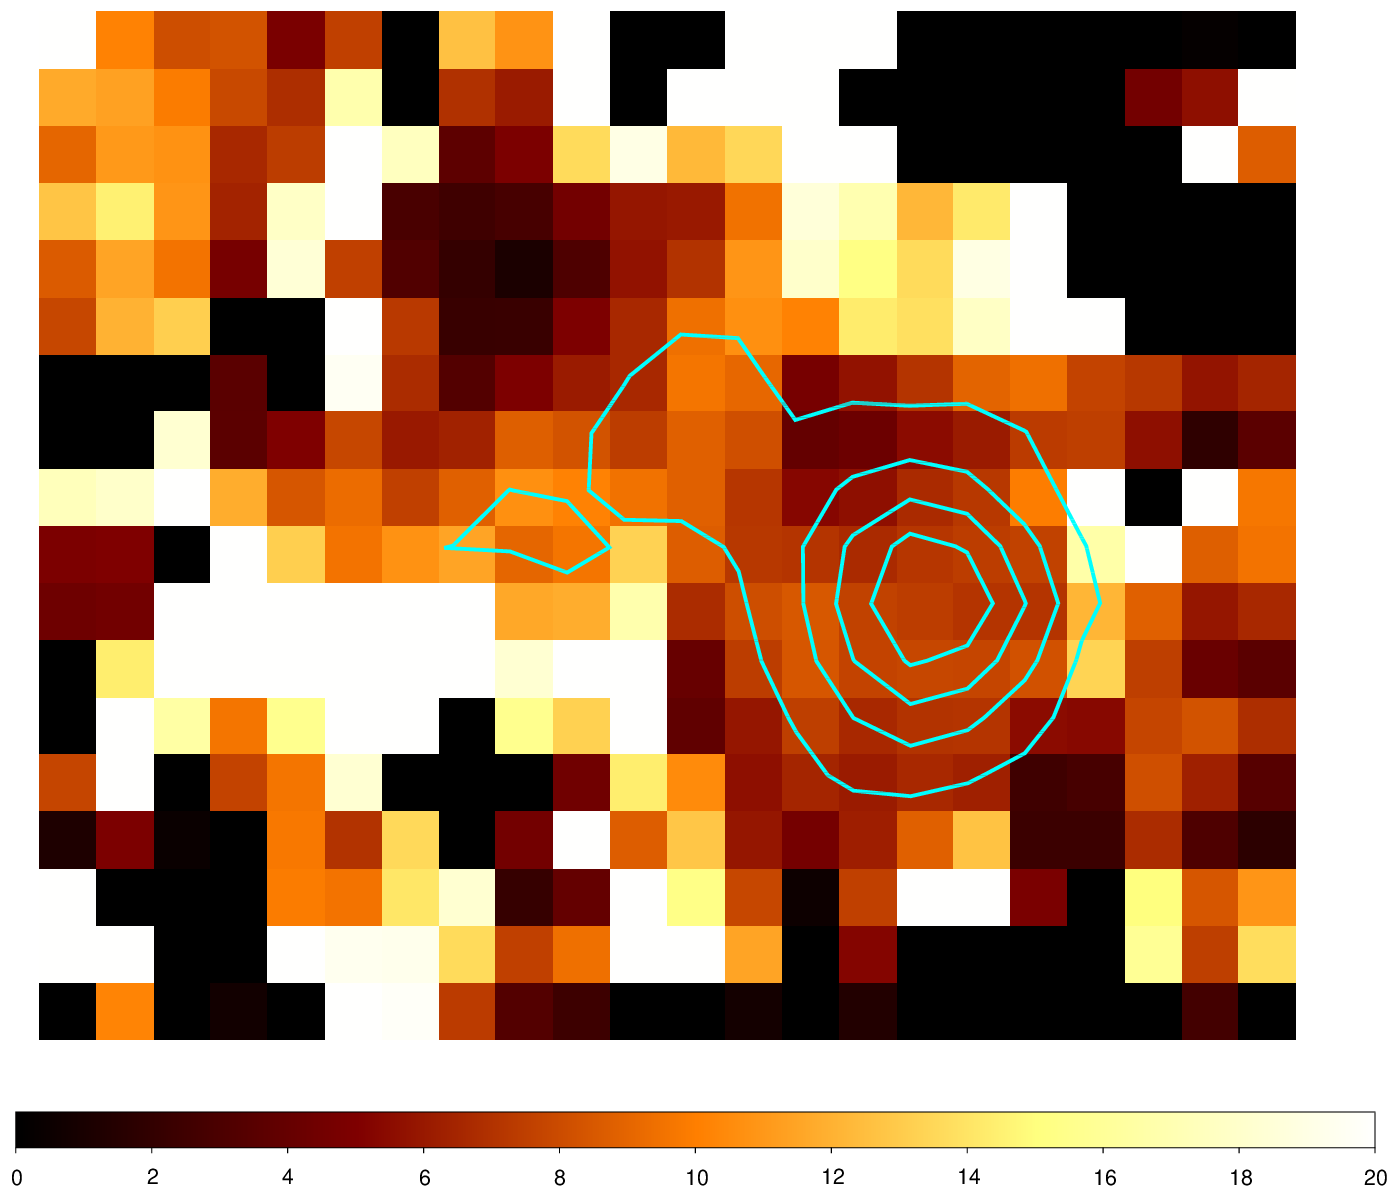
In the Figures. We also included maps of the integrated line ratio 12CO/13CO for each region (see Figures 5, 6 and 7). In the Figures it is also included contours of the integrated 12CO J=3–2 for reference. The average ratios obtained towards the regions delimited by the 12CO contours are 10 in N11B, and 8 in N11D and N11I.
These results are in agreement with values obtained towards other regions in the LMC (Israel et al., 2003; Israel, F. P. and de Graauw, 1991) and are somewhat larger than the typical values measuered in our Galaxy (Burton et al., 2013).
3.1 Molecular mass of the studied regions
Taking into account the morphology of each molecular cloud observed in the 13CO J=3-2 line (Figures 2, 3, and 4), and assuming local thermodinamic equilibrium (LTE), we roughly estimate the mass of each cloud. Using the typical LTE formulae (see for example Buckle et al. 2010) and assuming an isotopic abundance ratio X = 50 (Wang et al., 2009) we estimate the 13CO column densities for each cloud. Then assuming CO]= (Garay, G. and Johansson, L. E. B., 2002) we derived the corresponding column densities, from which, finally the cloud masses were estimated. The parameters obtained and used in this procedure are presented in Table 1: the optical depths ( and ), excitation temperatures (Tex), 13CO column density (N(13CO)), and the cloud masses. The masses presented in Table 1 for the regions N11B, N11D and N11I are approximately 104 M⊙, which are consistent with the results obtained by Herrera and Rubio (2013).
| N11B | N11D | N11I | |
|---|---|---|---|
| 9.5 | 10.6 | 8.8 | |
| 0.1 | 0.2 | 0.1 | |
| Tex [K] | 12.9 | 11.2 | 9.7 |
| N(13CO) [cm-2] | 1.3 | 1.4 | 2.2 |
| Mass(H2) [M⊙] | 1.1 | 1.3 | 2.0 |
4 Acknowledgement
This work was partially supported by Argentina grants awarded by UBA (UBACyT), CONICET and ANPCYT. M.R. wishes to acknowledge support from CONICYT(CHILE) through FONDECYT grant No1140839 and partial support from project BASAL PFB-06. M.C acknowledges support from FONDECYT grant No1140839.
References
- Buckle et al. [2010] Buckle, J. V., Curtis, and Roberts. The jcmt legacy survey of the gould belt: a first look at orion b with harp. MNRAS, 401:18, 2010. URL http://adsabs.harvard.edu/abs/2010MNRAS.401..204B.
- Burton et al. [2013] Burton, Michael G., and Hawkes. The mopra southern galactic plane co survey. Publications of the Astronomical Society of Australia, 30:44, 2013.
- Garay, G. and Johansson, L. E. B. [2002] Garay, G. and Johansson, L. E. B. Results of the sest key programme: Co in the magellanic clouds* - viii. the giant molecular complex no. 37 of the lmc. Astronomy and Astrophyics, 389(3):977–992, 2002. doi: 10.1051/0004-6361:20020397. URL https://doi.org/10.1051/0004-6361:20020397.
- Herrera and Rubio [2013] C. Herrera and M. Rubio. Millimeter dust emission compared with other mass estimates in N11 molecular clouds in the LMC. Astronomy & Astrophysics, 554:A91, June 2013. doi: 10.1051/0004-6361/201219381.
- Israel et al. [2003] F. P. Israel, T. de Graauw, L. E. B. Johansson, R. S. Booth, F. Boulanger, G. Garay, M. L. Kutner, J. Lequeux, L.-A. Nyman, and M. Rubio. Results of the ESO-SEST Key Programme on CO in the Magellanic Clouds. IX. The giant LMC HII region complex N 11. Astronomy & Astrophysics, 401:99–111, April 2003. doi: 10.1051/0004-6361:20021582.
- Israel, F. P. and de Graauw [1991] Israel, F. P. and T. de Graauw. Carbon Monoxide in the Magellanic Clouds. In R. Haynes and D. Milne, editors, The Magellanic Clouds, volume 148 of IAU Symposium, page 45, 1991.
- Keller and Wood [2006] S. C. Keller and P. R. Wood. Bump cepheids in the magellanic clouds: Metallicities, the distances to the lmc and smc, and the pulsation-evolution mass discrepancy. The Astrophysical Journal, 642(2):834, 2006. URL http://stacks.iop.org/0004-637X/642/i=2/a=834.
- Persson et al. [2004] S. E. Persson, Barry F. Madore, W. Krzemiński, Wendy L. Freedman, M. Roth, and D. C. Murphy. New cepheid period-luminosity relations for the large magellanic cloud: 92 near-infrared light curves. The Astronomical Journal, 128(5):2239, 2004. URL http://stacks.iop.org/1538-3881/128/i=5/a=2239.
- Wang et al. [2009] M. Wang, Y. N. Chin, C. Henkel, J. B. Whiteoak, and M. Cunningham. Abundances and isotope ratios in the magellanic clouds: The star-forming environment of n 113. The Astrophysical Journal, 690(1):580, 2009. URL http://stacks.iop.org/0004-637X/690/i=1/a=580.