11email: andrea.melandri@brera.inaf.it 22institutetext: INAF - Osservatorio di Astrofisica e Scienza dello Spazio di Bologna, Via Piero Gobetti 93/3, I-40129, Bologna, Italy 33institutetext: INAF - Osservatorio Astronomico di Padova, Vicolo dell’Osservatorio 5, I-35122, Padova, Italy 44institutetext: ASI - Science Data Centre, Via del Politecnico snc, I-00133, Roma, Italy 55institutetext: INAF - Osservatorio Astronomico di Roma, Via di Frascati, 33, I-00040 Monteporzio Catone, Italy 66institutetext: Department of Physics, University of Warwick, Coventry, CV4 7AL, UK 77institutetext: Gran Sasso Science Institute, Viale F. Crispi 7, I-67100, L’Aquila, Italy 88institutetext: INFN - Laboratori Nazionali del Gran Sasso, I-67100 L’Aquila, Italy 99institutetext: Instituto de Astrofísica de Andalucía (IAA-CSIC), Glorieta de la Astronomıa, s/n, E-18008, Granada, Spain 1010institutetext: INAF - Osservatorio Astronomico d’Abruzzo, Via Mentore Maggini, I-64100, Teramo, Italy 1111institutetext: Department of Physics and Astronomy, University of Leicester, Leicester, LE1 7RH, UK 1212institutetext: INAF - Osservatorio Astronomico di Capodimonte, Salita Moiariello 16, I-80131, Napoli, Italy 1313institutetext: Steward Observatory, The University of Arizona, 933 North Cherry Avenue, Tucson, AZ 85721-0065, USA 1414institutetext: Department of Physics, University of Notre Dame, Notre Dame, IN 46556, USA 1515institutetext: Urbino University, Via Santa Chiara 27, I-61027, Urbino, Italy 1616institutetext: Dark Cosmology Centre, Niels Bohr Institute, University of Copenhagen, Juliane Maries Vej 30, DK-2100, Copenhagen, Denmark 1717institutetext: Departamento de Ciencias Físicas, Universidad Andrés Bello, Fernández Concha 700, Las Condes, Santiago, Chile 1818institutetext: INFN - Sezione Milano Bicocca, Gruppo Collegato di Parma, Parco Area delle Scienze 7/A, I-43124, Parma, Italy 1919institutetext: Dipartimento di Fisica, Universitá degli Studi di Milano Bicocca, Piazza della Scienza 3, I-20126, Milano, Italy 2020institutetext: INAF - IASF Milano, Via E. Bassini 15, I-20133, Milano, Italy 2121institutetext: Astronomical Institute, Academy of Sciences of the Czech Republic, Bocni II 1401, CZ-141 00 Prague, Czech Republic 2222institutetext: Space Telescope Science Institute, 3700 San Martin Drive, Baltimore, MD 21218, USA 2323institutetext: Department of Physics, University of Trieste, and INFN, sezione di Trieste, Via Valerio 2, I-34127, Trieste, Italy 2424institutetext: INAF - Osservatorio Astronomico di Torino, Strada Osservatorio 20, I-10025 Pino Torinese, Italy 2525institutetext: Special Astrophysical Observatory, Nizhnij Arkhyz, Karachai-Cherkessian Republic, 369167, Russia
Unveiling the enigma of ATLAS17aeu††thanks: Based on observations made with Copernico, the TNG (under programme A34TAC24), the GTC (under programmes GTCMULTIPLE2D-16B and GTCMULTIPLE2G-17A), the LBT (under programme 2016201719), and with the HST (under programme GO14270) telescopes.
Abstract
Aims. The unusual transient ATLAS17aeu was serendipitously detected within the sky localisation of the gravitational wave trigger GW 170104. The importance of a possible association with gravitational waves coming from a binary black hole merger led to an extensive follow-up campaign, with the aim of assessing a possible connection with GW 170104.
Methods. With several telescopes, we carried out both photometric and spectroscopic observations of ATLAS17aeu, for several epochs, between and days after the first detection.
Results. We studied in detail the temporal and spectroscopic properties of ATLAS17aeu and its host galaxy. We detected spectral features similar to those of a broad lined supernova superposed to an otherwise typical long-GRB afterglow. Based on analysis of the optical light curve, spectrum and host galaxy SED, we conclude that the redshift of the source is probably .
Conclusions. While the redshift range we have determined is marginally compatible with that of the gravitational wave event, the presence of a supernova component and the consistency of this transient with the Ep-Eiso correlation support the conclusion that ATLAS17aeu was associated with the long gamma-ray burst GRB 170105A. This rules out the association of the GRB 170105A/ATLAS17aeu transient with the gravitational wave event GW 170104, which was due to a binary black hole merger.
Key Words.:
Gamma-ray burst: individual: GRB 170105A; supernovae: general; Gravitational waves: GW 1701041 Introduction
The first direct observation of gravitational waves by the Advanced LIGO interferometers came from the coalescence of a binary system of black holes (Abbott et al., 2016a), opening the era of gravitational-wave astronomy. Gravitational-wave signals from binary systems of black holes were detected several times during the first and second run of observations of the advanced detectors (Abbott et al., 2017a, b, c, 2016b). They provided us with information about their rate and mass distribution, and probed their formation and evolution. The first gravitational-wave signal from the inspiral of a binary neutron star system GW 170817 (Abbott et al., 2017d) was observed on August 17, 2017 by the Advanced LIGO and Virgo network, starting the era of multi-messenger astronomy (Abbott et al., 2017e).
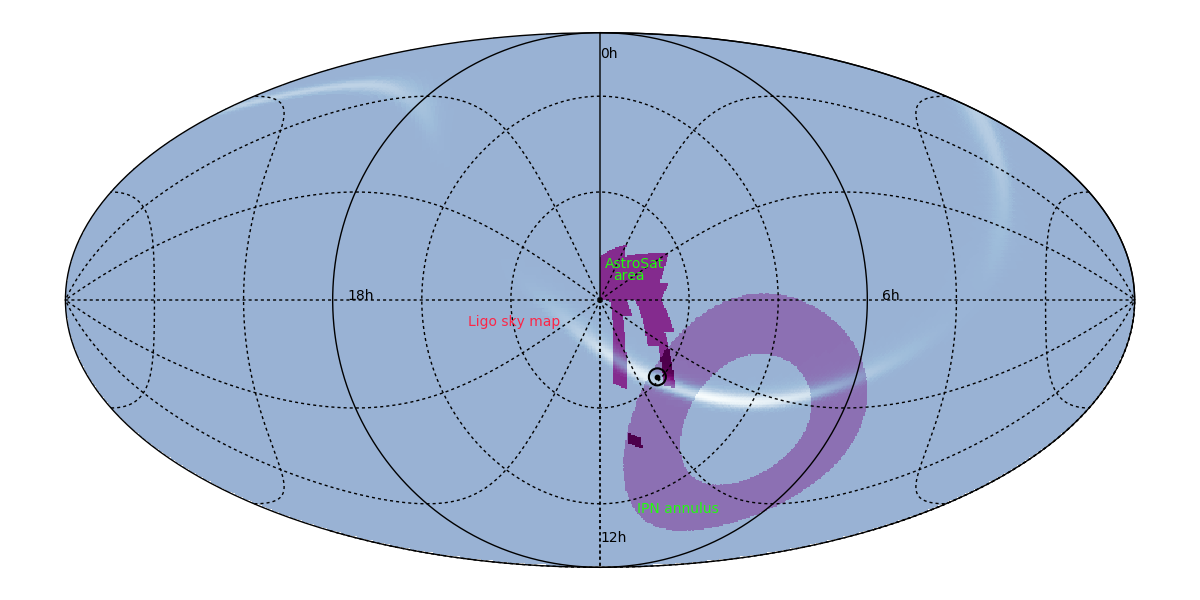
On January 4, 2017 at 10:11:58.6 UTC the Advanced LIGO detectors revealed the signal from a binary black-hole coalescence, GW 170104 (Abbott et al., 2017a). The system was made of component black-hole of masses M⊙ and M⊙ (at the 90% confidence level) at a luminosity distance of Mpc corresponding to a redshift of (Abbott et al., 2017a). An alert with an initial source localization ( 1600 deg2 at the 90% confidence level) was distributed to collaborating astronomers (LIGO-Virgo Collaborations, 2017). During the electromagnetic counterpart follow-up search, the ATLAS and Pan-STARRS surveys discovered ATLAS17aeu (Tonry et al., 2017), 23.1 hr after GW 170104, which was a rapidly fading transient within the inner 16% sky-localization probability contour (see Fig. 1). The transient, with a decay similar to a GRB afterglow, was also detected in X-rays by Swift and in the radio at 6 and 15 GHz by the VLA and the AMI large array, respectively Evans et al. (2017a, b); Corsi et al. (2017); Mooley et al. (2017b).
By fitting a power law to the optical decay, the time zero was found consistent with the gamma-ray burst GRB 170105A (Kasliwal et al., 2017) detected by the POLAR instrument onboard the Chinese space laboratory Tiangong-2 (Marcinkowski et al., 2017), AstroSat-CZTI (Sharma et al., 2017), Konus-Wind, and INTEGRAL-SPIACS (Svinkin et al., 2017) 20.04 hr after GW 170104. Temporal and spatial consistency led to the conclusion that ATLAS17aeu was the afterglow of GRB 170105A and unrelated to GW 170104 (Bhalerao et al., 2017b). Considering all the multi-wavelength observations of ATLAS17aeu, Stalder et al. (2017) concluded that the GRB 170105A is compatible with a classical long-GRB at redshift 1 2.9 and that ATLAS17aeu is statistically likely the associated afterglow. However, they evaluated a small but non-negligible probability of association of ATLAS17aeu and the GW signal, which only a direct redshift measurement of the host galaxy of ATLAS17aeu could exclude.
We present optical observations of ATLAS17aeu transient and its possible host galaxy taken with the 1.8-m Asiago Copernico telescope, the 3.6-m Telescopio Nazionale Galileo (TNG), the 8.4-m Large Binocular telescope (LBT), the 10.4-m Gran Telescopio Canarias (GTC), and the Hubble Space Telescope (HST) over 230 days from the GRB 170105A trigger time. Together with the radio and X-ray observations, the connection between the transient ATLAS17aeu and the long gamma-ray burst GRB 170105A is discussed.
2 ATLAS17aeu
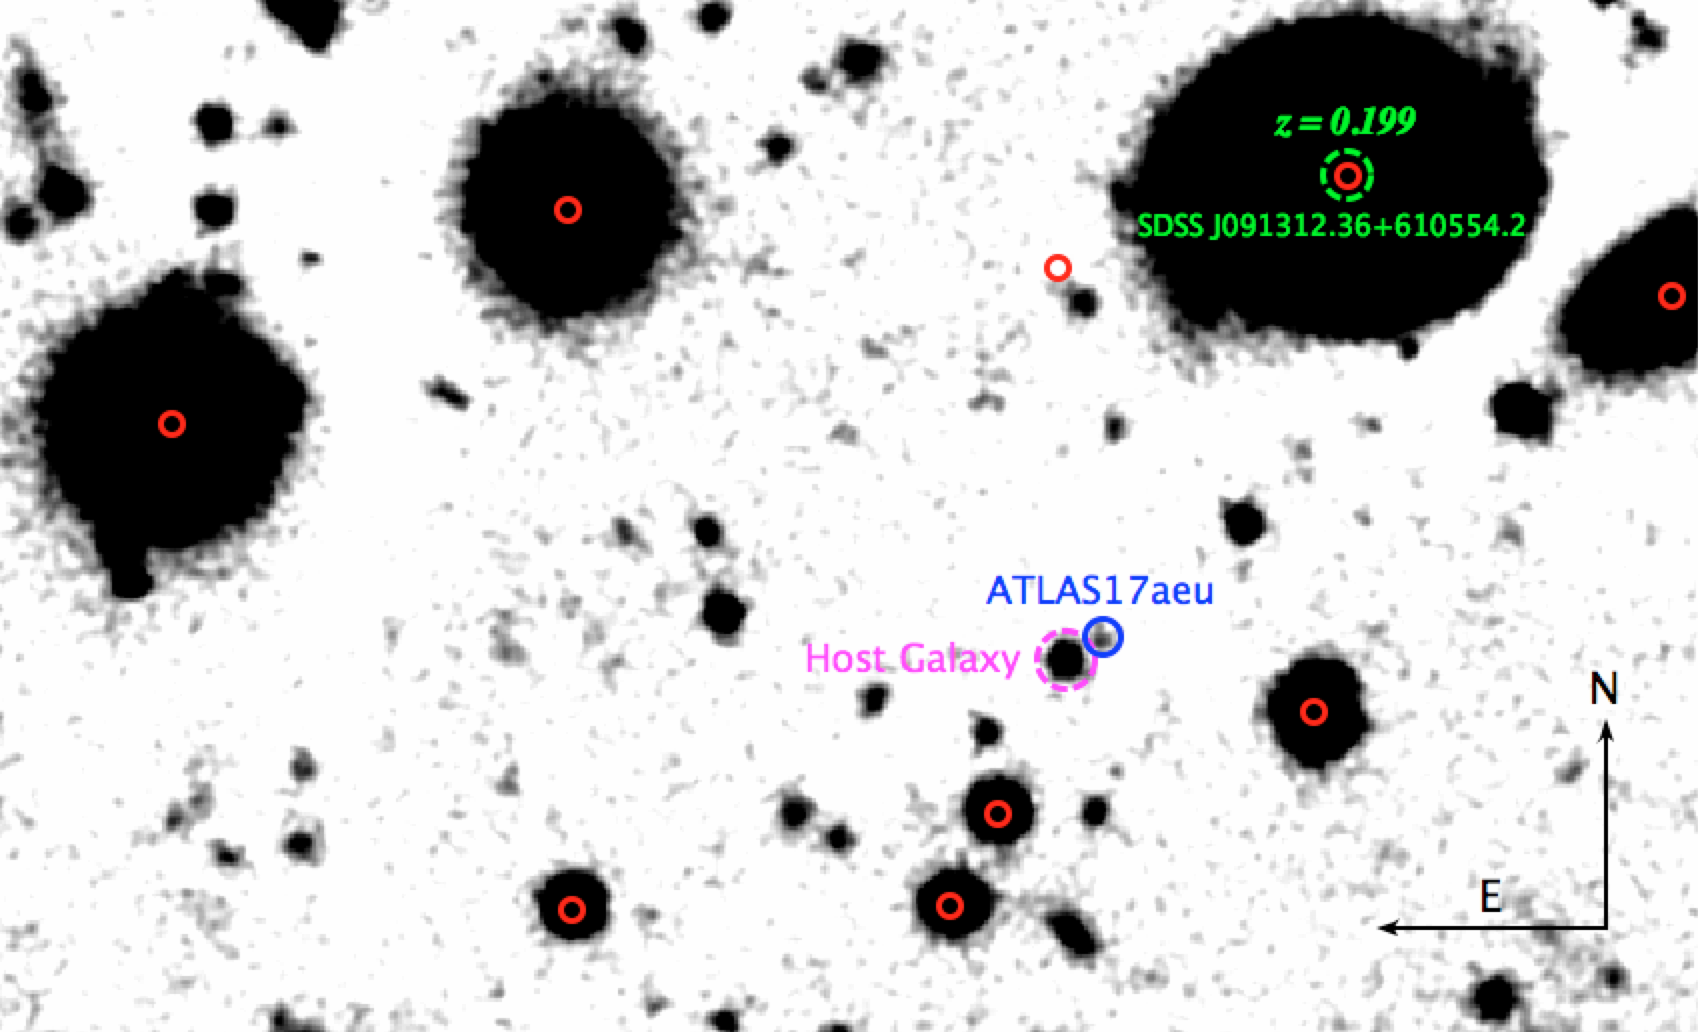
The rapidly fading transient ATLAS17aeu (Tonry et al., 2017), identified within the localization of GW 170104 (LIGO-Virgo Collaborations, 2017), was only 20′′ away from the SDSS galaxy J091312.36+610554.2, with a spectroscopic redshift () consistent with the distance inferred for GW 170104. Considering this galaxy as possible host of ATLAS17aeu, the position and distance consistency of ATLAS17aeu and GW 70104 led to many multi-wavelength observations to probe the possible association of ATLAS17aeu with the gravitational signal.
Within the GRAWITA111GRAvitational Wave Inaf TeAm: https://www.grawita.inaf.it/ framework, we monitored the light curve of the source between 1.65 and 88.7 days after the GRB trigger with the Asiago and TNG telescopes. In addition, we obtained two multi-filters epochs () with the GTC telescope between 3.92 and 78.7 days after the GRB trigger. Finally, we observed the field with the LBT telescope in imaging mode () at days after the gamma-ray burst trigger, GRB 170105A. Image reduction was carried out following standard procedures and the optical data were calibrated using a common set of selected catalogued stars of the SDSS catalog present in the field of view.
Two spectra were also acquired with the GTC telescope, one at days and a second one secured at days after the burst event. GTC spectroscopy was carried out using the OSIRIS camera in slit mode, with the R1000B (, spectral range Å) and R2500I (, spectral range Å) grisms. The slit width was set to . The data were optimally extracted (Horne, 1986) and reduced following standard procedures using ESO MIDAS222http://www.eso.org/projects/esomidas/ and IRAF333http://iraf.noao.edu/ software.
In addition, three further optical spectra were collected on April 14, 2017, on January 25, 2018, and on March 19, 2018 with LBT, using the two Multi-Object Double Spectrograph (MODS, Pogge et al., 2010). All observations were obtained in the spectral range 32009500 Å with a 1′′ slit ( 2000). MODS uses two red- and blue-optimized channels with a spectral range of Å and Å, respectively. The first two epochs were taken with the one grating for each channel which has the advantage to avoid a gap at Å between the two channels but doubles the observing time. Therefore, the last epochs were taken with the dual grating mode in which the light is separated by a dichroic into red- and blue-channels. A 2x2 binning was set in the second epoch, but it caused read-out artifacts and thus in the final epoch we adopted a 1x2 binning. The last observation was obtained under the best conditions (seeing , airmass ) for a total exposure time of s. Data reduction was performed at the Italian LBT Spectroscopic Reduction Center444http://www.iasf-milano.inaf.it/Research/lbt_rg.html by means of scripts optimized for LBT data. Steps of the data reduction of each two-dimensional spectral image are the correction for dark and bias, bad-pixel mapping, flat-fielding, sky background subtraction, and extraction of one-dimensional spectrum by integrating the stellar trace along the spatial direction. Wavelength calibration was obtained from the spectra of arc lamps, while calibration was obtained using catalogued spectrophotometric standards.
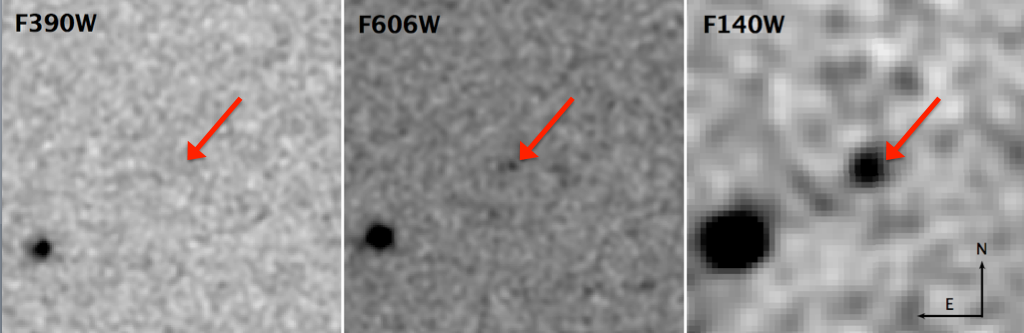
The location of ATLAS17aeu was subsequently observed with the HST-WFC on August 22, 2017 ( 229 days after the burst event). At this point, observations were obtained in the UVIS arm F390W, F606W and the IR arm with F140W555HST observations have been cross-calibrated with the , , and J bands, respectively.. Observations were reduced by astrodrizzle in the standard fashion. At the location of ATLAS17aeu, we clearly detect a source in both F606W and F140W, but there is no detection in F390W (Fig. 3). The position of the ATLAS17aeu transient is RA = 09:13:13.89, Dec = +61:05:32.54 with an error of 0.06 .
For our UVIS observations, we measure the AB magnitudes (or upper limits) within a 0.1″ aperture and correct them with the published encircled energy curves666http://www.stsci.edu/hst/wfc3/phot_zp_lbn. We determine that F390W mag () and F606W=27.64 0.21 mag. In the IR we use a 0.2″ aperture due to the poorer PSF, and measure F140W=25.87 0.14 mag. There is no sign of extension in the images, and the sources appear point-like. However, at this faint magnitude the detection of extension is challenging. We consider the source located S-E with respect to ATLAS17aeu as its host galaxy. The separation between the two objects is 1.8 (Fig. 3).
The summary of our photometric and spectroscopic observations is reported in Tables 1 and 2, respectively. Data have not been corrected for Galactic extinction (E mag, Schlafly & Finkbeiner, 2011).
3 GRB 170105A
GRB 170105A was detected at 06:14:07.0 UT (T0, corresponding to MJD=57758.259803) with a total duration T90 = 2.0 0.5 s. The burst event was also detected by INTEGRAL-SPIACS, Konus-Wind, and AstroSat-CZTI (Sharma et al., 2017) with a measured duration T 2.9 s. Its fluence derived from the Konus-Wind observation is S erg cm-2 and it displayed longer emission (with a duration of about 20 seconds) in the 18-70 keV soft channel of Konus-Wind (Svinkin et al., 2017; Stalder et al., 2017).
In Fig. 1 we show the localisation areas (AstroSat and IPN) for this event, together with the LVC sky map for GW 170104 and the most accurate position for ATLAS17aeu. As it can be seen ATLAS17aeu is slightly outside the 1 AstroSat/CZTI localisation area, well within the LVC probability contours. The temporal and spatial coincidence between ATLAS17aeu and GRB 170105A indicated that the two events were most likely associated (Kasliwal et al., 2017; Bhalerao et al., 2017a, b) while it remained unclear the association with the GW 170104 due to the lack of a firm ATLAS17aeu distance determination.
The GRB 170105A fluence is consistent with a long-soft, under-energetic GRB. In fact, assuming the distance inferred for GW 170104 () the estimated isotropic energy of the GRB event would be E erg, and at larger distances up to 1, the isotropic energy remains still consistent with the faint end of the Eiso distribution for long GRBs (Nava et al., 2012; D’Avanzo et al., 2012).
4 Results and discussion
4.1 Temporal analysis
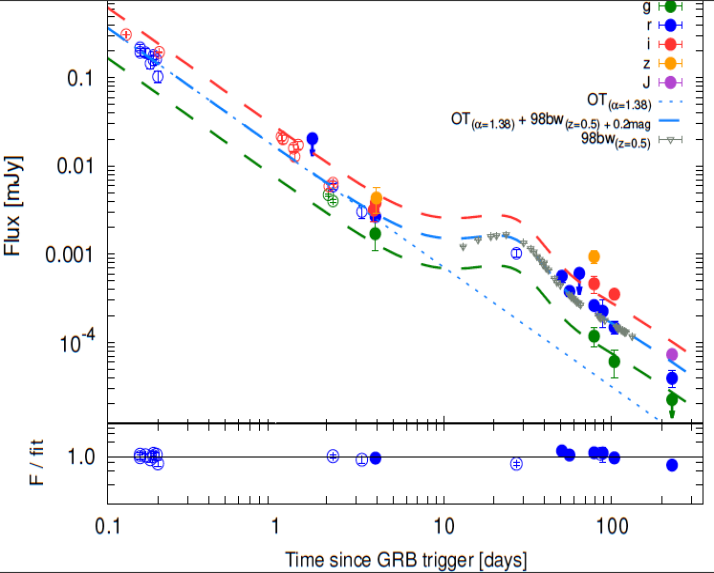
The early time optical light curve of ATLAS17aeu (Fig. 4) can be described by a single power-law decay (). At a later time ( 10 days) a significant deviation from that decay is detected, unveiling the presence of a possible supernova component (Fig. 4).
Many known under-energetic long-duration gamma-ray bursts and X-ray flashes have an associated highly stripped-envelope core-collapse supernova (Type Ib/c). At low redshifts () the supernova component is well identified both photometrically and spectroscopically (Galama et al., 1998; Patat et al., 2001; Hjorth et al., 2003; Malesani et al., 2004; Ferrero et al., 2006; Pian et al., 2006; Cano et al., 2011a; Bufano et al., 2012; Melandri et al., 2012; Schulze et al., 2014; Melandri et al., 2014; D’Elia et al., 2015), while at higher redshifts () the presence of the supernova is inferred from the detection of a re-brightening in the late afterglow light curve (Bloom et al., 1999; Castro-Tirado Gorosabel, 1999; Galama et al., 2000; Castro-Tirado et al., 2001; Della Valle et al., 2003; Greiner et al., 2003; Zeh et al., 2004; Della Valle et al., 2006; Soderberg et al., 2006; Cano et al., 2011b; Sparre et al., 2011; Jin et al., 2013). The supernova origin for the re-brightening observed in the afterglows of high- GRBs is further sometime enhanced by sporadic spectroscopic observations of the ”bumps” which reveal supernova features (e.g. Jin et al., 2013). Our Fig. 4 shows a faint optical light curve of ATLAS17aeu suggesting 0.3 and the signature of an emerging supernova which starts to outshine the GRB afterglow from 10-12 days.
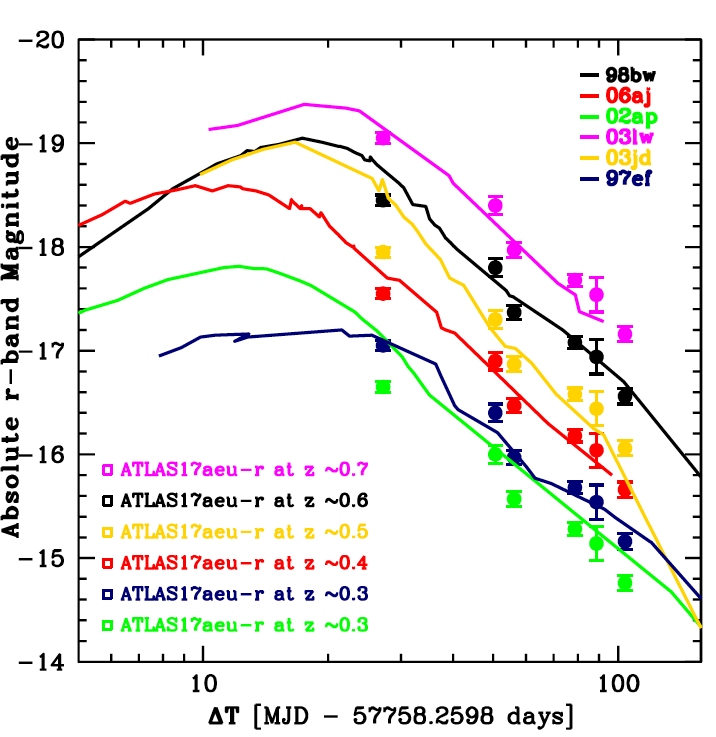
In order to have additional information about the possible SN component we rescaled the absolute -band magnitudes of ATLAS17aeu to the distance of several well-known Type Ib/c SNe, and compared our data with their light curves that cover a wide range of brightness (Fig. 5). This results in a possible range of distances that can explain the observed late time afterglow re-brightening (0.28 0.72) of ATLAS17aeu. The best match is obtained with SN 1998bw (a typical Type Ib/c SN associated with the sub-luminous gamma-ray burst GRB 980425) assuming a redshift of 0.6 (see Fig. 4). We note that even in the case of the match with the brightest known SN associated with a GRB (SN 2003lw) we obtain . The hypothesis of a higher redshift would require a much more luminous SN, that has never been observed in association with a long GRB.
4.2 Spectral analysis
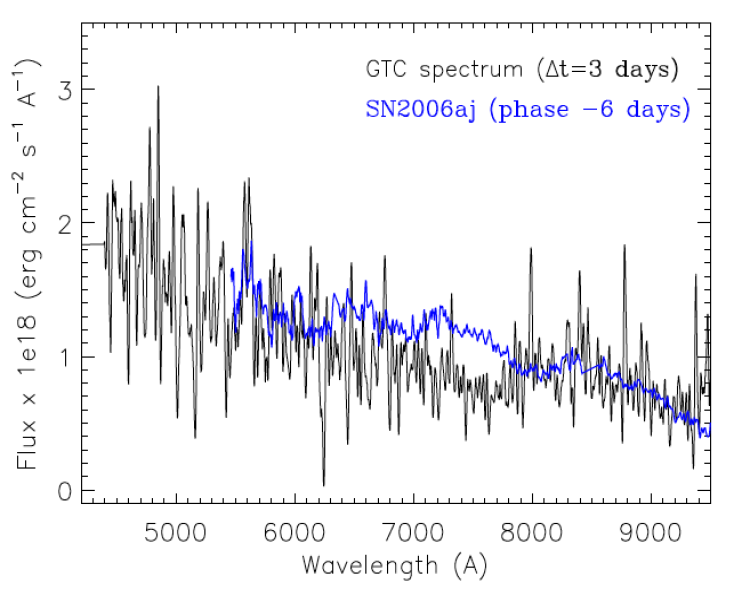
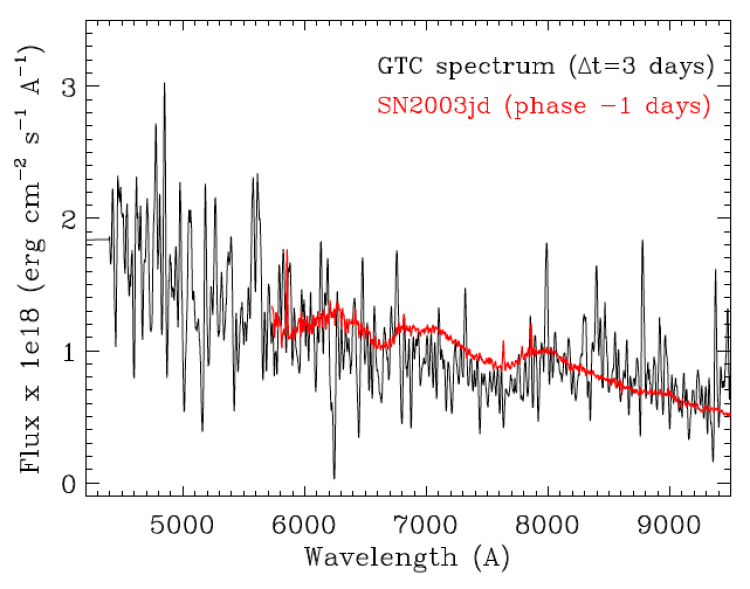
To investigate the possible connection between ATLAS17aeu and GRB 170105A, the early time spectrum obtained with GTC was compared with several Type Ib/c supernova templates. A good match is found with the Type Ic SN 2003jd (Valenti et al., 2008), reproducing well the overall shape of the spectrum. A satisfactory comparison is also obtained with SN 2006aj (Pian et al., 2006; Mirabal et al., 2006; Sollerman et al., 2006), a well-studied supernova (Fig. 6) associated with an under-energetic long-duration GRB 060218 (Campana et al., 2006). Our analysis showed a possible supernova (SN) signal if a redshift is assumed.
A similar value for the redshift is also found when comparing the late time LBT spectrum of the host galaxy with the template of a star-forming galaxy, by identifying several Balmer transitions at redshift . The red region of the spectrum (which is the one with the higher signal-to-noise ratio) shows a correspondence between the observed lines (H, HK, H and Gband+H+Fe4383 Å) and the model. These spectral comparisons indicated a plausible redshift for ATLAS17aeu of .
4.3 Spectral energy distribution of the afterglow
In order to study the transient, we modeled and investigated the data-set separately at different wavelength ranges: radio, optical and X-rays. We then interpolate the data to two common epochs and performed a broad band analysis.
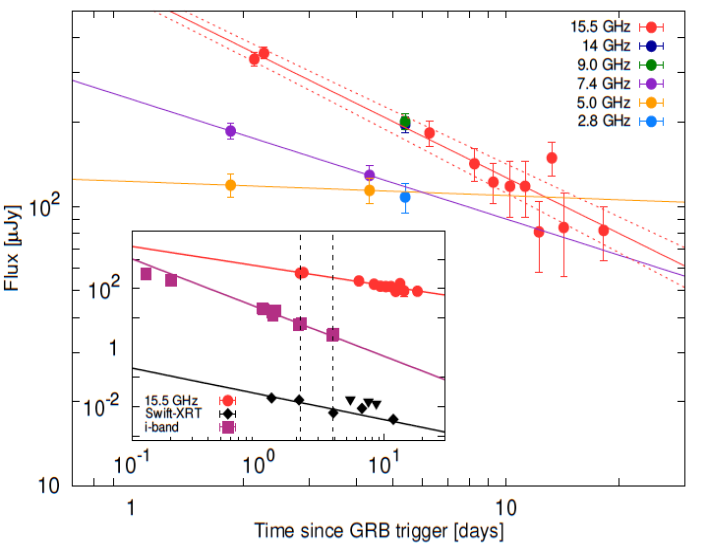
We first fitted the radio light curve, for which there are observations at different frequencies, with most of the data at 15.5 GHz and only a couple of detections at 7.4 and 5.0 GHz (Bhalerao et al., 2017b). The light curve has a different behaviour in the different bands, and it is decaying more rapidly at higher frequencies (Fig. 7, left panel). When we modeled the data with a power-law fit, we obtained decaying indices of , and at 15.5, 7.4 and 5.0 GHz, respectively. Note that for the latter two indexes the data points are as many as the parameters, and no uncertainty can be provided. The different decays in the radio bands might be due to colour evolution, which can only be explained by the presence of a spectral break moving from higher to lower frequencies.
Then, to study the behaviour in the optical band, we considered the data up to 5 days after the trigger, when only the afterglow is contributing to the observed flux. Data were corrected for foreground Galactic extinction. The light curve is best followed up in the and filters, with and bands data starting only 2 days after the trigger. We studied the spectral energy distribution of the afterglow at 3.93 days for which we have detections in all the optical bands. We find that the data are best modeled by a power-law with spectral index and negligible dust extinction along the line of sight. Afterwards, we modeled all optical light curves together and sampled the time and wavelength plane with a two variable power-law , and fixed to the value reported above. This approach is only possible given the negligible dust extinction. In this way, we find an optical decay common to all optical bands of .
Afterward, we studied the -XRT data. The data span the interval between 1 and 15 days and can be best modeled by a single power-law model with a decay . The X-ray spectrum is rather poor and can be fitted using Xspec v12.9.0 with a simple power-law with , fixed foreground Galactic absorption ( cm-2; Willingale et al. 2013) and negligible host gas absorption.
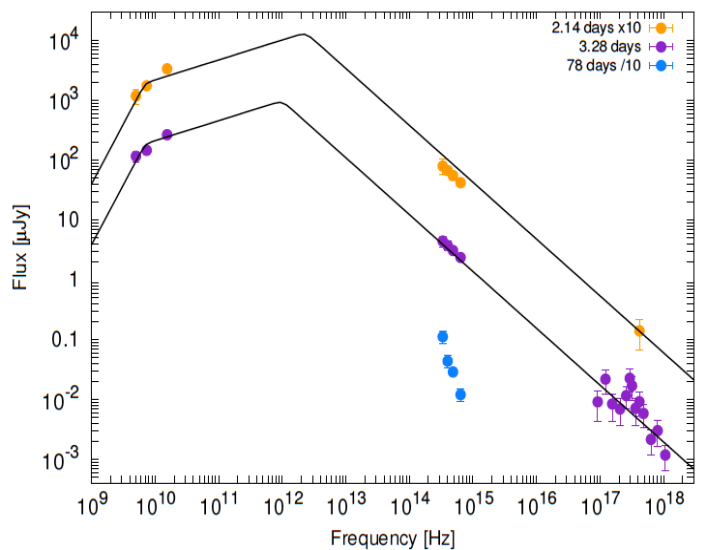
Finally, we modeled all optical, radio and X-ray spectral energy distribution (SED) at the logarithmic-mean time of the XRT observations, i.e. 3.28 days. We also selected another epoch at 2.14 days, for which we have optical detections. We interpolated radio and optical data to the first epoch, and radio and XRT data to the second epoch. In the following we fixed the optical spectral slope to the value found above. We modeled the SED at 3.28 days with a double broken power-law, and we find two spectral breaks: a first spectral break in the radio bands at () Hz and a second break between radio and optical bands at () Hz. Following the standard synchrotron theory under slow cooling regime (Sari et al., 1998), we identify the first break in the radio to be the absorption frequency and the break between optical and radio to be the injection frequency . The slope between and is fixed to the value of . It is important to note here that the first break is evolving with time and that the decay below the break is almost negligible. This behaviour can be interpreted within the jet scenario (Sari et al., 1999) and the slow cooling regime, which indeed predicts for and . Thus, to obtain the model at 2.14 days we followed Sari et al. (1999) and used the relations and .
In Fig. 8 we show the radio, optical and X-ray SEDs at different epochs. The fit is acceptable, but we must note that the model does not perfectly match the optical data at the first epoch and the jet scenario would predict more rapid decay in optical and X-rays bands. This suggests the presence of a second break between optical and X-rays and thus a more sophisticated analysis is needed to fully understand the afterglow behaviour. This can be seen in Fig. 7 (right panel) which shows radio, optical, and X-rays light curves. In particular, while the radio and the X-rays light curves agree within 1 (due to the large uncertainty of ), the optical light curve is not consistent with the others. We interpret this as the presence of another spectral break between optical and X-ray bands. An evolving break between optical and X-rays can be seen in the jet scenario without sideways expansion if the circumburst medium has a wind profile, and the synchrotron cooling frequency lies in between optical and X-rays bands implying , consistent with the values reported above (e.g., Racusin et al., 2009; Schulze et al., 2011). It is also expected that , and indeed doing so the two decay indexes are consistent within 2.
4.4 Spectral energy distribution of the host galaxy
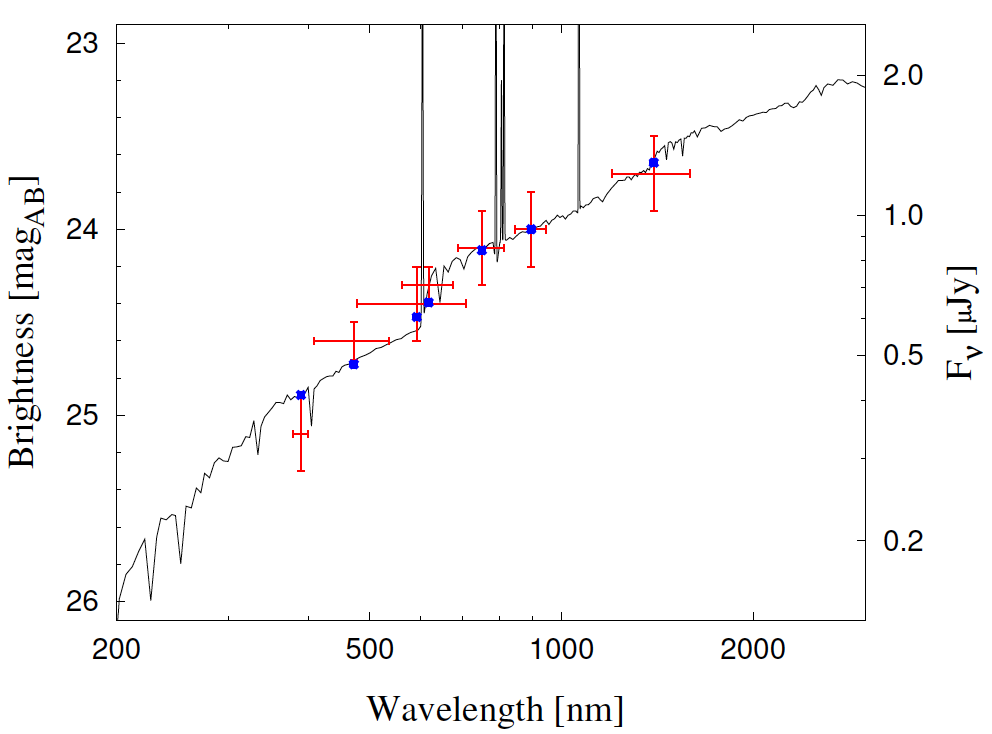
We used the photometric SED-fitting code LePHARE777http://www.cfht.hawaii.edu/ãrnouts/LEPHARE. (Arnouts, et al., 1999; Ilbert et al., 2006) to determine host-galaxy parameters from the detections. After fixing the redshift to the most plausible value found in our spectral and temporal analysis ( 0.62, see Sections 4.1 and 4.2), we found that the host is a low-mass (M = 10 M⊙), galaxy with low global extinction (E mag using Calzetti et al. 2000 extinction law), and low star-formation rate (SFR = 0.9 M⊙ yr-1). The inferred low mass is in agreement with the mass of typical long GRB hosts at these redshifts (Vergani et al., 2015).
Despite the low SFR, the low mass does not qualify this galaxy as an early type, which would be very unusual for the host of a long GRB (but see Rossi et al., 2014). In fact, the main stellar population is moderately young (age = Gyr) and the galaxy has a high specific SFR of yr-1 in agreement with other GRB hosts and star-forming galaxies (Hunt et al., 2014; Japelj et al., 2016). The result of our fit is shown in Fig. 9. It is worth noting that if we do not fix the redshift we can use photometric data to constraint it between , which is well expected given the featureless SED and still inconsistent with the inferred distance of GW 170104.
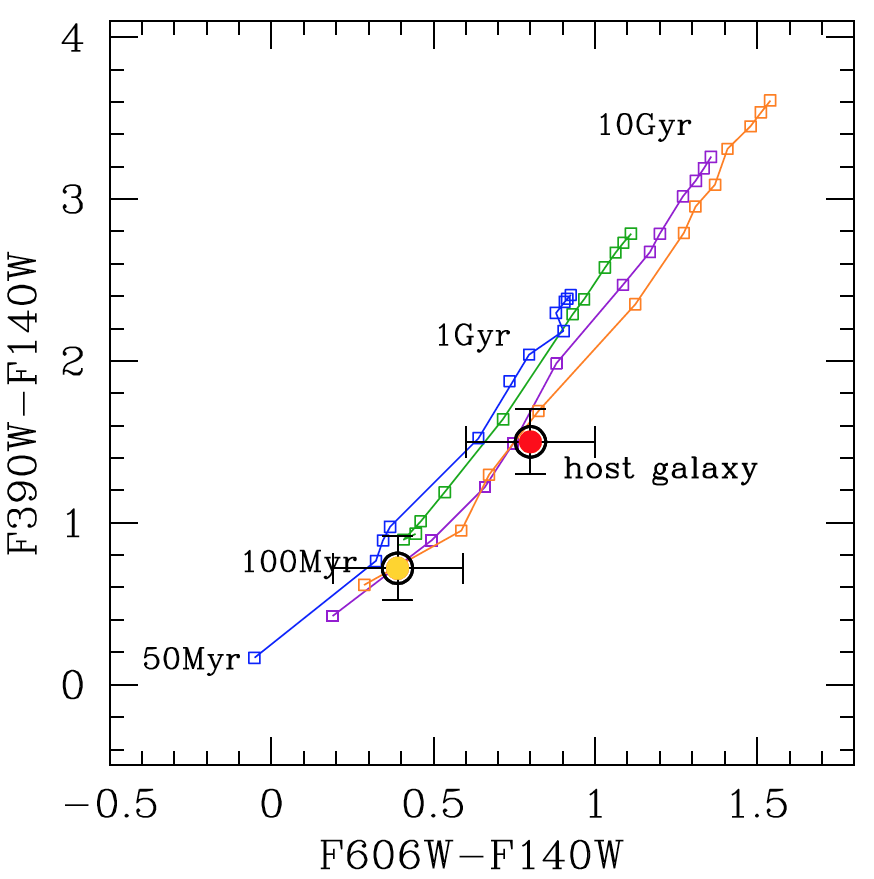
To give some indications on the properties of the host galaxy, in Fig. 10 we also plot the (F390-F140W) colour versus the (F606-F140W) colour of the host galaxy, together with stellar population models. The integrated colour predictions shown in the figure are based on the Stellar Population Tools (SPoT) code for single-age, single-metallicity stellar population (SSP) models (Brocato et al., 1999; Raimondo, 2009), updated for this study using higher total stellar masses, and new spectral libraries for cool and hot stars. Models suggest that the main component of the stellar population in the galaxy is as young as few ten of Myr or younger, in agreement with a high specific SFR (e.g. Feulner et al., 2005). This is mildly in agreement with the results of our photometric host-galaxy SED-fitting. The model and data uncertainties do not permit clear indications on the chemical composition of the stellar content.
| MJD | t888This time is estimated from T0. | texp | Filt. | Mag (err) | Tel. |
| d | d | min | |||
| 57762.179 | 3.92 | 8 | 23.53 (0.08) | GTC | |
| 57836.964 | 78.7 | 10 | 26.34 (0.26) | GTC | |
| 57862.194 | 103.9 | 60 | 27.05 (0.31) | LBT | |
| 57987.330 | 229.1 | 45.6 | F390W | 28.1 | HST |
| 57820.050 | 61.8 | 80 | 22.6 | TNG | |
| 57759.914 | 1.65 | 15 | 20.7 | Asiago | |
| 57762.187 | 3.93 | 10 | 23.13 (0.06) | GTC | |
| 57808.852 | 50.6 | 70 | 24.65 (0.18) | TNG | |
| 57814.436 | 56.2 | 65 | 25.03 (0.15) | TNG | |
| 57822.567 | 64.3 | 90 | 25.0 | TNG | |
| 57836.973 | 78.7 | 10 | 25.43 (0.12) | GTC | |
| 57846.960 | 88.7 | 140 | 25.48 (0.29) | TNG | |
| 57862.194 | 103.9 | 60 | 26.05 (0.15) | LBT | |
| 57987.330 | 229.1 | 24.4 | F606W | 27.64 (0.21) | HST |
| 57761.093 | 3.84 | 16 | 22.52 (0.32) | TNG | |
| 57762.197 | 3.94 | 10 | 22.85 (0.10) | GTC | |
| 57836.953 | 78.7 | 12 | 24.98 (0.26) | GTC | |
| 57862.178 | 103.9 | 60 | 25.13 (0.12) | LBT | |
| 57762.205 | 3.94 | 7 | 22.67 (0.13) | GTC | |
| 57836.980 | 78.7 | 8 | 24.01 (0.24) | GTC | |
| 57987.330 | 229.1 | 16.8 | F140W | 25.87 (0.14) | HST |
| MJD | t999This time is estimated from T0. | texp | grism | seeing | Tel. |
|---|---|---|---|---|---|
| d | d | min | [′′] | ||
| 57761.110 | 2.89 | 2x20 | R1000B | 1.5 | GTC |
| 57761.153 | 2.93 | 2x20 | R2500I | 1.5 | GTC |
| 57858.210 | 99.99 | 3x30 | blue | 0.9 | LBT |
| 57858.210 | 99.99 | 3x30 | red | 0.9 | LBT |
| 57873.903 | 115.68 | 2x20 | R1000B | 0.8 | GTC |
| 57873.924 | 115.70 | 1x20 | R2500I | 0.8 | GTC |
| 58142.431 | 384.21 | 4x10 | blue | 1.2 | LBT |
| 58142.431 | 384.21 | 4x10 | red | 1.2 | LBT |
| 58196.273 | 438.05 | 8x10 | dual-grating | 0.7 | LBT |
| Filter | Magnitude (error) | Telescope |
|---|---|---|
| F390W | 25.2 0.2 | HST |
| 24.69 0.11 | LBT | |
| F606W | 24.5 0.2 | HST |
| 24.38 0.08 | LBT | |
| 24.14 0.06 | LBT | |
| 24.02 0.04 | GTC | |
| F140W | 23.7 0.2 | HST |
5 Conclusion
Our optical observations allowed us to comprehensively describe the temporal behaviour of the unusual transient ATLAS17aeu from early to very late phases. The detection of spectral absorption features reminiscent of broad-lined Ic supernova confirms that ATLAS17aeu is indeed the optical afterglow of the long-duration under-energetic GRB 170105A, and definitely not associated with the gravitational wave signal GW 170104, which was due to a binary BH merger (Abbott et al., 2017a).
The presence of the supernova is in fact confirmed at early times in our first spectrum ( days after the burst event) and at later times by the typical bump in the light curve already seen in many other light curves of GRBs connected SNe. Despite the fact that the redshift for this event is not strongly constrained by the data, we can confidently define a small range of possible values, that is . The temporal behaviour of such a supernova is similar to the observed evolution of the prototype supernova associated with long GRBs (SN 1998bw), peaking at similar time after the burst event ( days). In fact, as for SN 1998bw, that was associated with a sub-luminous gamma-ray burst (GRB 980425), also ATLAS17aeu resulted to be associated with a long under-energetic event (GRB 170105A). All our observations including the host galaxy ones point to the scenario of a long GRB at 0.5 unrelated to gravitational wave signal.
By assuming the fluence measured by Konus-WIND and, based on the soft spectrum inferred from the measurements by Konus-WIND, POLAR and AstroSat-CZTI, a rest-frame spectral peak energy Ep of 5025 keV, we find that GRB 170105A would be consistent with the Ep-Eiso correlation of long GRBs (Amati et al., 2002; Amati, 2006) only for 0.4-0.5 (implying an isotropic energy for this event of E 1051 erg). This finding further supports the above conclusion that this event came from a larger distance with respect to GW 170104, and is well consistent with its association with a supernova at 0.5.
Acknowledgements.
We thank P. Shawhan for useful comments. AM acknowledges the support from the ASI grant I/004/11/3. AR acknowledges support from Premiale LBT 2013. AJCT thanks the Spanish Ministry Project AYA2015-71718-R (including FEDER funds). LT, SB are partially supported by the PRIN-INAF 2016 with the project ”Toward the SKA and CTA era: discovery, localisation, and physics of transient sources”. Partially based on observations collected at Copernico 1.82m telescope (Asiago, Italy) of the INAF - Osservatorio Astronomico di Padova. JH was supported by a VILLUM FONDEN Investigator grant (project number 16599). AFV is thankful to the Russian Science Foundation (grant 14-50-00043). This work made use of observations obtained with the Italian 3.6m Telescopio Nazionale Galileo (TNG) and the 10.4m Gran Telescopio Canarias (GTC), operated on the island of La Palma by the Fundación Galileo Galilei of the Instituto Nazionale di Astrofisica (INAF) at the Spanish Observatorio del Roque de los Muchachos of the Instituto de Astrofísica de Canarias, and also of observations made with the 8.4m Large Binocular Telescope (LBT). The LBT is an international collaboration among institutions in Italy, United States, and Germany. LBT Corporation partners are: Istituto Nazionale di Astrofisica, Italy; The University of Arizona on behalf of the Arizona university system; LBT Beteiligungsgesellschaft, Germany, representing the Max-Planck Society, the Astrophysical Institute Potsdam, and Heidelberg University; The Ohio State University; and The Research Corporation, on behalf of The University of Notre Dame, University of Minnesota, and University of Virginia. We thank the TNG staff, in particular G. Andreuzzi, G. Mainella, A. Harutyunyan, and the LBT staff, in particular A. Gargiulo, for their valuable support with TNG and LBT observations and data reduction. We also acknowledge INAF financial support of the project ”Gravitational Wave Astronomy with the first detections of adLIGO and adVIRGO experiments.References
- Abbott et al. (2017a) Abbott, B. P., Abbott, R., Abbott, T. D., et al. 2017a, Physical Review Letters, 118, 221101
- Abbott et al. (2017b) Abbott, B. P., Abbott, R., Abbott, T. D., et al. 2017b, Physical Review Letters, 119, 141101
- Abbott et al. (2017c) Abbott, B. P., Abbott, R., Abbott, T. D., et al. 2017c, ApJ, 851, L35
- Abbott et al. (2017d) Abbott, B. P., Abbott, R., Abbott, T. D., et al. 2017d, Physical Review Letters, 119, 161101
- Abbott et al. (2017e) Abbott, B. P., Abbott, R., Abbott, T. D., et al. 2017e, ApJ, 848, L12
- Abbott et al. (2016a) Abbott, B. P., Abbott, R., Abbott, T. D., et al. 2016a, Physical Review Letters, 116, 061102
- Abbott et al. (2016b) Abbott, B. P., Abbott, R., Abbott, T. D., et al. 2016b, Physical Review Letters, 116, 241103
- Amati et al. (2002) Amati, L., et al. 2002, AA, 390, 81
- Amati (2006) Amati, L. 2006, MNRAS, 372, 233
- Arnouts, et al. (1999) Arnouts, S., Cristiani, S., Moscardini, L., et al. 1999, MNRAS, 310, 540.
- Bhalerao et al. (2017a) Bhalerao, V., Battacharya, D., Rao, A.R., Vadawale, S., 2017a, GRB Coordinates Network, 20412
- Bhalerao et al. (2017b) Bhalerao, V., Kasliwal, M. M., Battacharya, D., et al. 2017b, ApJ, 845, 152
- Bloom et al. (1999) Bloom, J. S., Kulkarni, S. R., Djorgovski, S. G., et al. 1999, Nature, 401, 453
- Brocato et al. (1999) Brocato, E., et al. 1999, ApJ, 527, 230
- Bufano et al. (2012) Bufano, F., Pian, E., Sollerman, J., et al. 2012, ApJ, 753, 67
- Calzetti et al. (2000) Calzetti, D., Armus, L., Bohlin, R. C., et al. 2000, ApJ, 533, 682
- Campana et al. (2006) Campana, S., Mangano, V., Blustin, A. J., et al. 2006, Nature, 442 1008
- Cano et al. (2011a) Cano, Z., Bersier, D., Guidorzi, C., et al. 2011a, ApJ, 740, 41
- Cano et al. (2011b) Cano, Z., Bersier, D., Guidorzi, C., et al. 2011b, MNRAS, 413, 669
- Castro-Tirado Gorosabel (1999) Castro-Tirado, A. J., Gorosabel, J. 1999, AAS, 138, 449
- Castro-Tirado et al. (2001) Castro-Tirado, A. J., Sokolov, V. V., Gorosabel, J., et al. 2001, AA, 370, 398
- Corsi et al. (2017) Corsi, A., et al. 2017, GRB Circular Network, 20396, 1
- D’Avanzo et al. (2012) D’Avanzo, P., Salvaterra, R., Sbarufatti, B., et al. 2012, MNRAS, 425, 506
- Della Valle et al. (2003) Della Valle, M., Malesani, D., Benetti, S., et al. 2003, AA, 406, L33
- Della Valle et al. (2006) Della Valle, M., Malesani, D., Bloom, J. S., et al. 2006, ApJ, 642, 103
- D’Elia et al. (2015) D’Elia, V., Pian, E., Melandri, A., et al. 2015, AA, 577, 116
- Evans et al. (2017a) Evans, P. A., et al. 2017a, GRB Circular Network, 20390, 1
- Evans et al. (2017b) Evans, P. A., et al. 2017b, GRB Circular Network, 20415, 1
- Ferrero et al. (2006) Ferrero, P., Kann, D. A., Zeh, A., et al. 2006, AA, 457, 857
- Feulner et al. (2005) Feulner, G., et al. 2005, MNRAS, 358, 1
- Galama et al. (1998) Galama, T. J., Vreeswijk, P. M., van Paradijs, J., et al. 1998, Nature, 395, 670
- Galama et al. (2000) Galama, T. J., Tanvir, N., Vreeswijk, P. M., et al. 2000, ApJ, 536, 185
- Greiner et al. (2003) Greiner, J., Klose, S., Salvato, M., et al. 2003, ApJ 599, 1223
- Hjorth et al. (2003) Hjorth, J., Sollerman, J., Moller, P., et al. 2003, Nature, 423, 847
- Horne (1986) Horne, K. 1986, PASP, 98, 609
- Hunt et al. (2014) Hunt, L. K., Palazzi, E., Michałowski, M. J., et al. 2014, A&A, 565, A112
- Ilbert et al. (2006) Ilbert, O., Arnouts, S., McCracken, H. J., et al. 2006, A&A, 457, 841
- Japelj et al. (2016) Japelj, J., Vergani, S. D., Salvaterra, R., et al. 2016, AA, 590, 129
- Jin et al. (2013) Jin, Z.-P., Covino, S., Della Valle, M., et al. 2013, ApJ, 774, 114
- Kasliwal et al. (2017) Kasliwal, M., Adams, S., Vedantham, H., et al. 2017, GRB Coordinates Network, 20393
- Komatsu et al. (2011) Komatsu, E., Smith, K. M., Dunkley, J., et al. 2011, ApJS, 192, 18
- Larson et al. (2011) Larson, D., Dunkley, J., Hinshaw, G., et al. 2011, ApJS, 192, 16
- LIGO-Virgo Collaborations (2017) The LIGO Scientific Collaboration and Virgo Collaboration, 2017, GRB Coordinates Network, Circular Service, 20364
- Malesani et al. (2004) Malesani, D., Tagliaferri, G., Chincarini, G., et al. 2004, ApJ, 609, 5
- Marcinkowski et al. (2017) Marcinkovski, R., Xiao, H., Hajdas, W., 2017, GRB Coordinates Network, Circular Service, 20387
- Melandri et al. (2012) Melandri, A., Pian, E., Ferrero, P., et al. 2012, AA, 547, A82
- Melandri et al. (2014) Melandri, A., Pian, E., D’Elia, V., et al. 2014, AA, 567, 29
- Mirabal et al. (2006) Mirabal, N., Halpern, J. P., An, D., Thorstensen, J. R., Terndrup, D. M., ApJ, 643, 99
- Mooley et al. (2017b) Mooley, K. P., et al. 2017, GRB Circular Network, 20425, 1
- Nava et al. (2012) Nava, L., Salvaterra, R., Ghirlanda, G., et al. 2012, MNRAS, 421, 1256
- Patat et al. (2001) Patat, F., Cappellaro, E., Danziger, J., et al. 2001, ApJ, 555, 900
- Pian et al. (2006) Pian, E., Mazzali, P. A., Masetti, N., et al. 2006, Nature, 442, 1011
- Pogge et al. (2010) Pogge, R. W., Atwood, B., Brewer, D. F., et al. 2010, Proc. SPIE, 7735, 77350A
- Racusin et al. (2009) Racusin, J. L., Liang, E. W., Burrows, D. N., et al. 2009, ApJ, 698, 43
- Raimondo (2009) Raimondo, G. 2009, ApJ, 700, 1247
- Rossi et al. (2014) Rossi, A., Piranomonte, S., Savaglio, S., et al. 2014, A&A, 572, A47
- Sari et al. (1998) Sari, R., Piran, T., & Narayan, R. 1998, ApJ, 497, L17
- Sari et al. (1999) Sari, R., Piran, T., & Halpern, J. P. 1999, ApJ, 519, L17
- Schlafly & Finkbeiner (2011) Schlafly, E. F., & Finkbeiner, D. P. 2011, ApJ, 737, 103
- Schulze et al. (2011) Schulze, S., Klose, S., Björnsson, G., et al. 2011, A&A, 526, A23
- Schulze et al. (2014) Schulze, S., Malesani, D., Cucchiara, A., et al. 2014, AA, 566, A102
- Sharma et al. (2017) Sharma, V., Bhalerao, V., Battacharya, D., Rao, A.R., Vadawale, S., 2017, GRB Coordinates Network, Circular Service, 20389
- Soderberg et al. (2006) Soderberg, A. M., Kulkarni, S. R., Price, P. A., et al. 2006, ApJ, 636, 391
- Sollerman et al. (2006) Sollerman, J., Jaunsen, A. O., Fynbo, J. P. U., et al. 2006, AA, 454, 503
- Sparre et al. (2011) Sparre, M., Sollerman, J., Fynbo, J. P. U., et al. 2011, ApJ, 735, 24
- Stalder et al. (2017) Stalder, B., Tonry, J., Smartt, S. J., et al. 2017, ApJ, 850, 149
- Svinkin et al. (2017) Svinkin, D., et al., 2017, LIGO/Virgo Coordinates Network, Circular Service, 20406
- Tonry et al. (2017) Tonry, J., et al., 2017, LIGO/Virgo Coordinates Network, Circular Service, 20382
- Valenti et al. (2008) Valenti, S., Benetti, S., Cappellaro, E., et al. 2008, MNRAS, 383, 1485
- Vergani et al. (2015) Vergani, S. D., Salvaterra, R., Japelj, J., et al. 2015, AA, 581, 102
- Waters et al. (2006) Waters, C. Z., Zepf, S. E., Lauer, T. R., et al. 2006, ApJ, 650, 885
- Willingale et al. (2013) Willingale, R., Starling, R. L. C., Beardmore, A. P., Tanvir, N. R., & O’Brien, P. T. 2013, MNRAS, 431, 394
- Zeh et al. (2004) Zeh, A., Klose, S., Hartmann, D. H. 2004, ApJ, 609, 952