X-shooting GRBs at high redshift: probing dust production history††thanks: Based on observations collected at the European Organisation for Astronomical Research in the Southern Hemisphere, 8.2 m Very Large Telescope (VLT) with the X-shooter instrument mounted at UT2 under ESO programmes 087.A-0055(B), 088.A-0051(B), 089.A-0067(B), 090.A-0088(C), 092.D-0633(E), 093.A-0069(A), 096.A-0079(A), and 098.A-0055(A).
Abstract
Evolved asymptotic giant branch (AGB) stars and Type Ia supernovae (SNe) are important contributors to the elements that form dust in the interstellar medium of galaxies, in particular, carbon and iron. However, they require at least a Gyr to start producing these elements, therefore, a change in dust quantity or properties may appear at high redshifts. In this work, we use extinction of -ray burst (GRB) afterglows as a tool to look for variations in dust properties at . We use a spectroscopically selected sample of GRB afterglows observed with the VLT/X-shooter instrument to determine extinction curves out to high redshifts. We present ten new X-shooter GRBs of which six are dusty. Combining these with individual extinction curves of three previously known GRBs, we find an average extinction curve consistent with the SMC-Bar. A comparison with spectroscopically selected GRBs at all redshifts indicates a drop in visual extinction () at with no moderate or high extinction bursts. We check for observational bias using template spectra and find that GRBs up to are detectable with X-shooter up to mag. Although other biases are noted, a uniformly low dust content above indicates a real drop, suggesting a transition in dust properties and/or available dust building blocks. The remarkable increase in dust content at could arise due to carbon and possibly iron production by the first carbon-rich AGB and Type Ia SNe, respectively. Alternatively, dust drop could be the result of low stellar masses of GRB host galaxies.
keywords:
Galaxies: high-redshift - ISM: dust, extinction - Stars: Gamma-ray burst: general1 Introduction
The evolution of dust in the early Universe is highly debated. Different formation mechanisms have been proposed to dominate the dust production at high redshifts, including core-collapse supernovae (CCSNe; Todini & Ferrara, 2001; Morgan & Edmunds, 2003; Hirashita et al., 2005; Dwek et al., 2007), massive asymptotic giant branch (AGB) stars (Valiante et al., 2009; Hirashita et al., 2014), and interstellar medium (ISM) grain growth (Draine & Fraisse, 2009; Michałowski, 2015; Mattsson et al., 2014). All of these mechanisms suffer from serious difficulties: Formation and dust production of AGB stars takes too long to explain dusty galaxies (Michałowski, 2015), and also they appear to be minor dust contributors even in the local universe (Matsuura et al., 2009; Meixner et al., 2006), ISM grain growth needs to be extremely rapid, and may be hindered by the formation of surface ices (Ferrara et al., 2017), and CCSNe require time to build up dust and metals. While CCSNe are clearly shown to produce dust (Matsuura et al., 2009; Gomez et al., 2012; De Looze et al., 2016; Wesson et al., 2010; Bevan & Barlow, 2016; Temim et al., 2017), CCSN dust production is at the same time expected to be counteracted by the destructive effects of supernova shocks (Nozawa et al., 2007; Schneider et al., 2012), apparently destroying dust so efficiently that the existence of dusty, star-forming galaxies in the early universe (e.g. Cooray et al., 2014; Watson et al., 2015; Laporte et al., 2017) is something of a mystery (Michałowski et al., 2012; Rowlands et al., 2014). While there are potentially ways out of some of these difficulties (e.g. Gall et al., 2014), it is obviously vital to constrain observationally the nature of the dust at all redshifts to solve this mystery.
The energetic afterglows of long-duration -ray bursts (GRBs) are powerful probes with which to study the ISM of galaxies into the epoch of reionisation (e.g., Tanvir et al., 2009; Gehrels et al., 2009). Their association with the explosions of massive stars (e.g., Woosley, 1993; Galama et al., 1998; Hjorth et al., 2003; Cano et al., 2017) and their simple spectral shapes (Sari et al., 1998; Granot & Sari, 2002) make them unique probes to study dust extinction in star-forming regions at cosmological distances (e.g., Watson et al., 2006; Kann et al., 2010; Greiner et al., 2011; Zafar et al., 2011a; Schady et al., 2012; Zafar et al., 2018b). While quasars can also be used to determine extinction, their selection criteria strongly favour low extinction sightlines, and the complexity of quasar spectra and the uncertainty of their intrinsic slopes leads to a degeneracy in derived dust properties, especially at high redshifts (e.g. Maiolino et al., 2004; Gallerani et al., 2010; Hjorth et al., 2013).
Currently, average extinction laws from the Milky Way (MW) and the Large and Small Magellanic Clouds (LMC and SMC) are often used to quantify dust properties of the environments that existed around or at the epoch of reionisation (Zafar et al., 2012; Tanvir et al., 2017; Zafar et al., 2018a). It is important to derive the individual extinction curves of high redshift sources to determine the grain properties and content of dust in the early Universe and to understand the appearance and formation of the first stars and galaxies. It is important here to recall that in case of a simple back-lit dust screen, an extinction curve infers the light loss due to scattering and absorption by the dust. In the more commonly encountered situation of an integrated geometry where the dust is mixed with the stars and ionised gas, an attenuation curve defines the relative distribution of dust and emitting sources. For star-forming galaxies, the effective reddening of the galaxy is determined by a Calzetti attenuation law (Calzetti et al., 1994) which is greyer than the MW, LMC, and SMC extinction curves. However, attenuation law through dust mixed with emitting sources and with SMC-type dust can lead to Calzetti-law attenuation (Gordon et al., 1997; Inoue, 2005).
The Neil Gehrels Swift Observatory (Gehrels et al., 2004), enables discovery of GRBs up to the epoch of reionisation (Tanvir et al., 2009, 2017). The fast response and tremendous efforts of the follow-up teams ensure that simultaneous ground-based photometric and spectroscopic data are acquired to affirm high-redshift GRB afterglow discoveries. In the present generation of instruments, the VLT/X-shooter spectrograph (Vernet et al., 2011) with its sensitivity, medium resolution, and wide-band from the ultraviolet (UV) to the near-infrared (NIR) is highly efficient and suitable to study dust properties of high redshift GRBs. Modelling of the X-ray to the NIR spectroscopic spectral energy distributions (SEDs) provides individual extinction curves of GRB afterglows to understand dust properties at high redshifts.
Previously, Zafar et al. (2011a) reported a sudden drop in dust content in GRB afterglows above with a lack of mag extinguished events. Recently, Bolmer et al. (2018) found that on average GRBs at contain less dust than at . They claim it is an observational bias to not easily detect bursts with mag at with the Gamma-Ray burst Optical and Near-Infrared Detector (GROND) mounted at the 2.2-m MPG telescope. Such a drop in dustiness at is also reported by McLure et al. (2013); Dunlop et al. (2017) through the Atacama Large Millimeter Array (ALMA) observations of the Hubble Ultra Deep Field and through SCUBA-2 observations on the James Clerk Maxwell Telescope (Koprowski et al., 2017). A similar drop in the fraction of dusty ultra-luminous infrared galaxies (ULIRGs) in Ly emission selected samples at redshifts larger than 2.5 was reported by Nilsson & Møller (2009), while at the same time a faint dusty galaxy with mag has been confirmed (Watson et al., 2015). Atek et al. (2014) and Hayes et al. (2011) reported a decrease in dust and increase in Ly escape fraction with increasing redshift up to for Ly emitters, a decrease which is detectable already between redshifts of 2 and 3 (Nilsson et al., 2009). There is thus a large body of evidence for an evolution of the dust content of the Universe with cosmic time. Here we aim to investigate the exact redshift of the drop in dust content and how large the variation is. This is done by measuring the amount of dust in GRBs at to pinpoint the epoch of the transition phase.
In this work, we selected GRBs above that were observed with the X-shooter instrument and have simultaneous photometric data available. In §2 we present our X-shooter high redshift sample and provide details about the multi-wavelength data taken for each case. In §3 we describe our dust model and SED analysis. The results and discussions are provided in §4 and §5. The conclusions of our high redshift dust analysis are given in §6. Throughout the paper, errors denote 1 uncertainties and 3 limits are provided.
| GRB | ||||
|---|---|---|---|---|
| mag | 1020 cm-2 | hours | ||
| 110818A | 3.360 | 0.03 | 2.93 | 6.200 |
| 111123A | 3.152 | 0.05 | 6.90 | 13.37 |
| 120712A | 4.175 | 0.04 | 4.12 | 10.43 |
| 121201A | 3.385 | 0.01 | 2.05 | 12.00 |
| 130408A | 3.758 | 0.22 | 32.0 | 1.500 |
| 140311A | 4.954 | 0.03 | 2.80 | 27.89 |
| 140515A | 6.327 | 0.02 | 2.54 | 16.83 |
| 140614A | 4.233 | 0.11 | 12.6 | 3.150 |
| 151027B | 4.062 | 0.18 | 9.43 | 8.011 |
| 170202A | 3.645 | 0.02 | 1.98 | 16.00 |
2 Ensemble selection
A large sample of GRB afterglow spectra has been acquired with the VLT/X-shooter instrument under target of opportunity (ToO) programs. From March 2009 until March 2017, 121 spectra have been taken with X-shooter, eight of these being short-duration GRBs and the remaining 113 are long duration bursts. X-shooter has three spectroscopic arms (UVB: 300-550 nm, VIS: 550-1,000 nm, and NIR: 1,000-2,500 nm) and for these arms, GRB afterglow spectra are usually taken with 1.0′′ (UVB), 0.9′′ (VIS), and 0.9′′ (NIR) slit widths. The afterglow spectra are reduced and flux calibrated using the standard X-shooter pipeline (version 2.0; Modigliani et al. 2010). More details on the reduction and flux calibration, including background subtraction and extraction of each GRB afterglow observed under the X-shooter GRB legacy sample are provided in Selsing et al. (2018).
Out of 113 long-duration GRBs, only 20 GRBs were discovered at (Selsing et al., 2018). The SED analysis of six GRB afterglows has already been presented in Zafar et al. (2018b). In addition, one case was excluded as being a host galaxy observation. We targeted the remaining 13 GRB afterglows to perform SED analysis which relies on robust flux calibration. Due to the usage of a broader 5.0′′ wide slit for the flux standard star observations and malfunction of the Atmospheric Dispersion Correctors (ADC) for the UVB and VIS arms, the GRB afterglow spectra have sub-optimal flux calibration primarily due to slit-losses. However, note that after the ADC malfunctioning, the observations were always taken at the parallactic angle to minimise any effect of differential slit loss (see Selsing et al., 2018, for more details). We required photometric data around the X-shooter observations to have optimal flux calibration for each case (see Japelj et al., 2015). Our dedicated search in the literature resulted in finding 10 new GRBs with simultaneous photometric observations. We constructed the SEDs for each of these 10 cases to derive individual extinction curves at .


2.1 X-shooter data
The X-shooter spectra and available multi-band photometric data were corrected for the foreground Galactic extinction using the maps of Schlafly & Finkbeiner (2011). For each case, the Galactic extinction value is provided in Table 1 and the uncertainties on are very small and would have a negligible effect on our results. Only in the case of GRB 151027B, the uncertainty is 0.03 mag and could alter our results by 10% but that case is consistent with no dust (see §4.9). The SEDs are generated at photometric mid-times, t, and the X-shooter spectra are scaled to the photometric observations. Usually the photometric and spectroscopic data are comparable, however, sometimes they differ up to 15%. We used the HEAsoft software (version 6.19) tool flx2xsp to convert X-shooter data to the XSPEC (version12.9; Arnaud 1996) readable spectral (PHA) and response matrices (RSP) files. The data around and below the damped Ly absorber, metal absorption lines, atmospheric telluric absorption, and spikes originating from sky subtraction residuals were masked out. The masking file, PHA, and RSP files were grouped using the grppha tool and individual data channels (representing the spectral binning) were kept and no additional re-binning is applied.
2.2 X-ray data
The X-ray data for each GRB afterglow is obtained from the Swift X-ray Telescope (XRT, Burrows et al. 2005). The XRT lightcurves were gathered from the Swift online repository (Evans et al., 2009) and a time decay model (Beuermann et al., 1999) is fitted to the data. The X-ray spectrum for each GRB afterglow is reduced using the HEAsoft software in the 0.3–10.0 keV energy range around the SED mid-time (which is the photometric midpoint). We used photon counting (PC) mode observations and selected data around the region of no spectral evolution. The X-ray data are extracted using the XSELECT (version 2.4) tool and RSP files were used from the Swift XRT calibrations. The X-ray PHA and RSP files were grouped to 20 counts per energy channel using the grppha tool. This is done to have a better handle on the X-ray slopes. The X-ray lightcurves were then used to estimate a ratio of the SED mid-time and the photon weighted mean time of the X-ray spectrum was further applied to normalise the X-ray spectra.
3 SED and dust fitting procedure
Theoretically, GRBs are defined by the ‘fireball model’ (e.g, Mészáros & Rees, 1997), suggesting GRB afterglows originate from synchrotron radiation caused by the interaction between the ultra-relativistic jet and the ISM. Cooling of electrons, in the GRB postshock, produces a break in the synchrotron spectrum. This cooling break is sometimes located between the optical and X-ray bands (see Fig.1 of Sari et al., 1998) with a well-defined change in spectral slope of . This fixed change in the slope is supported by analysis of both spectroscopic (Zafar et al., 2011a) and photometric (Greiner et al., 2011) GRB SEDs.
We followed the SED and dust fitting method described in Zafar et al. (2018b). We briefly outline the method here. For a full description we refer the reader to Zafar et al. (2018b). We used the spectral fitting package XSPEC to fit the restframe X-ray to the optical/NIR SEDs of GRB afterglows. A single or broken power-law together with a parametric extinction law is used to model the SEDs. In case of a single power-law, the intrinsic spectral shape is defined by the slope . In case of a broken power law a cooling break () is required. In those cases the intrinsic slopes, (optical slope) and (X-ray slope), were fitted such that the change in slope () was fixed at 0.5 (Sari et al. 1998, see also Zafar et al. 2011a; Greiner et al. 2011).
For the X-ray data, the total Galactic equivalent neutral hydrogen column density () was fixed within XSPEC using to the values estimated from Willingale et al. (2013). Willingale et al. (2013) values include atomic hydrogen column density (Kalberla et al., 2005) and contributions from molecular hydrogen (Wilms et al., 2000) and Galactic dust (Schlegel et al., 1998). The soft X-ray absorption indicating the restframe host galaxy equivalent neutral hydrogen column density, , is left as a free parameter using . We used the XSPEC default solar abundances of Anders & Grevesse (1989) following the discussions of Watson (2011) and Watson et al. (2013).
The observed spectra are changed due to dust scattering and absorption and given as: , where is described by the Fitzpatrick & Massa (1990) dust model. The Fitzpatrick & Massa (1990) law provides more freedom in fitting the extinction curves using two components: a UV linear component defined by (intercept) and (slope) parameters with providing the far-UV curvature with far-UV term and a Drude component specifying the 2175 Å extinction bump by (bump strength), (central wavelength), and (bump width) parameters. The wavelength-dependent extinction, , is thus given as:
| (1) |
Where for m-1 and for m-1. We initially fitted the data with the Drude component to search for a 2175 Å bump but in all cases, the bump strength was consistent with zero. Therefore, we fixed the Drude component to , , and . This was done to avoid degeneracies and to allow a better constraint for other parameters, following the discussions of Zafar et al. (2015).
Finally, for the GRB SED analysis within XSPEC, , , , , , (), , and spectral indices of the continuum ( and ), were fitted as free parameters. We refer the reader to Zafar et al. (2018b) for discussions about correlated parameters and their errors. The broken power-law model is considered a better fit for the cases where the F-test probability is smaller than 5%. In Table 2, the best fit results for both single and broken power-laws, resulting reduced (derived using errors in the optical and X-ray spectra), and the null hypothesis probability for each case are provided.
4 Results
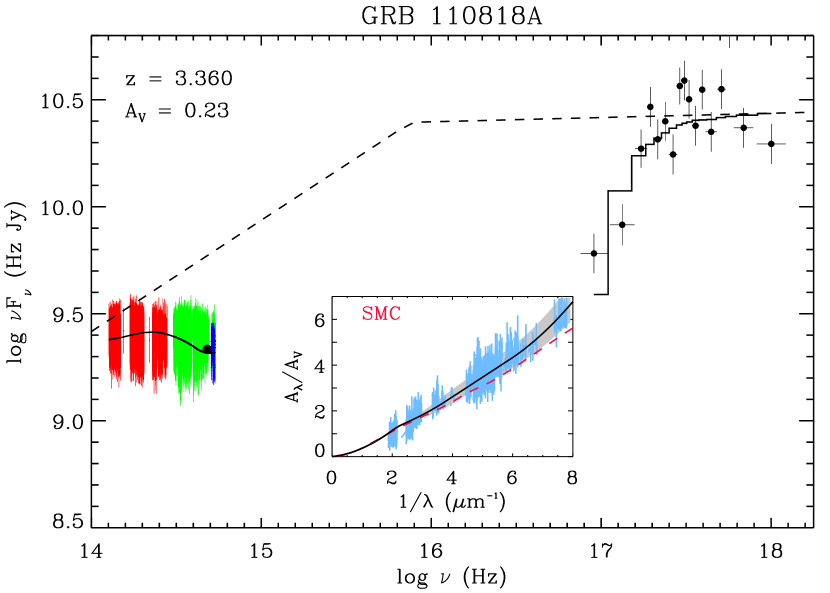
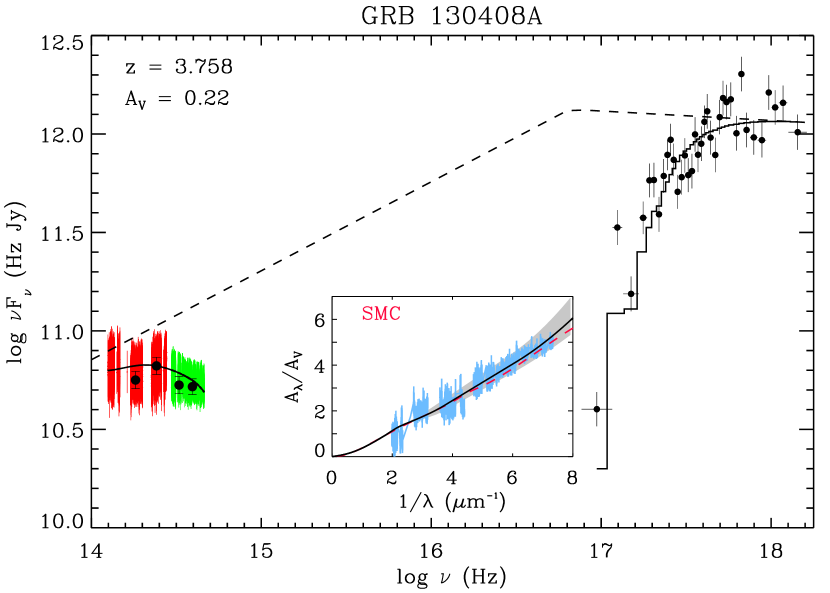
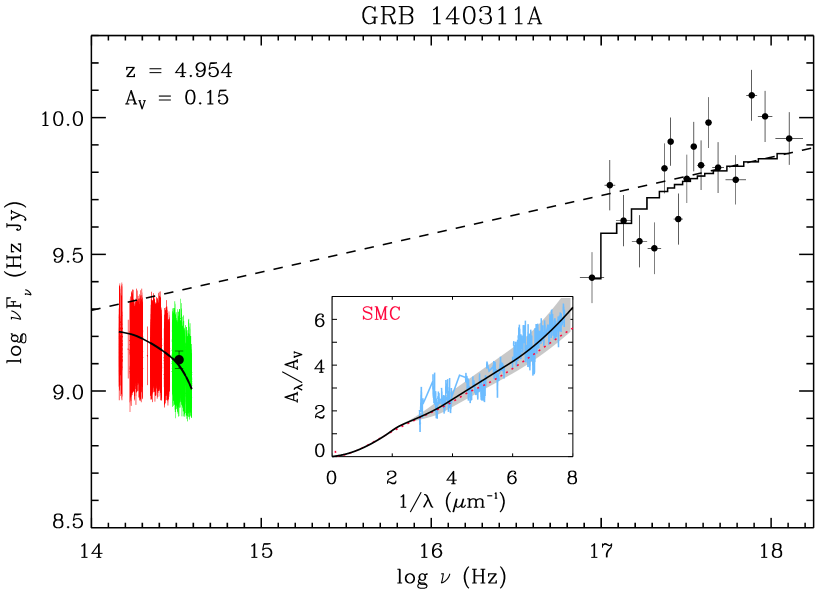
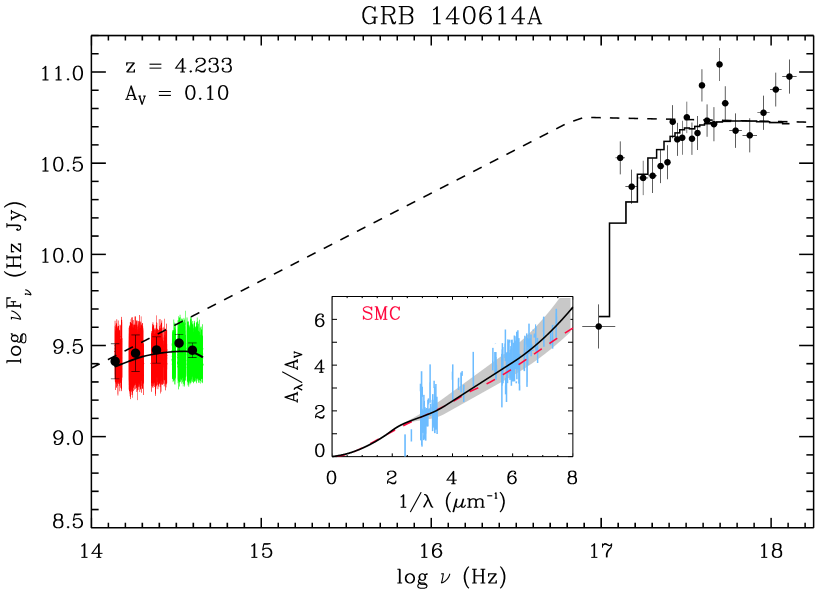
In this section, we provide details of the spectroscopic and photometric data collection and SED construction for each case. The SED fitting is performed on the X-shooter data and XRT data. The photometric data are not included in the SED analysis and only used for correcting the sub-optimal flux-calibration of X-shooter. The best-fit models of each GRB afterglow and extinction curves for the dusty cases are shown in Fig. 1.
4.1 GRB 110818A
The X-shooter spectra of the GRB 110818A () afterglow were carried out at 6.2 hours after the burst trigger. The only available photometric measurement in the -band is from the X-shooter acquisition camera (D’Avanzo et al., 2011). We used the -band observation for the X-shooter-XRT SED normalisation. The SED prefers a broken power-law and a featureless extinction curve () with mag.
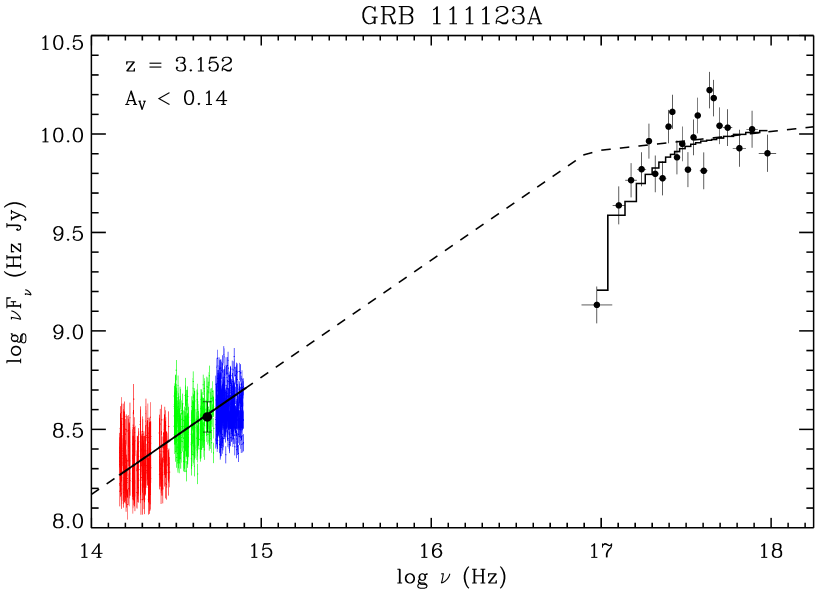
4.2 GRB 111123A
The X-shooter spectra of the GRB 111123A () afterglow were taken at 13.92 hours after the burst trigger. The afterglow was detected by GROND only in the band and was undetected in the remaining bands (see also Rossi et al., 2011). We used that band data for the X-shooter-XRT SED normalisation. The SED prefers a broken power-law and no dust extinction with mag.
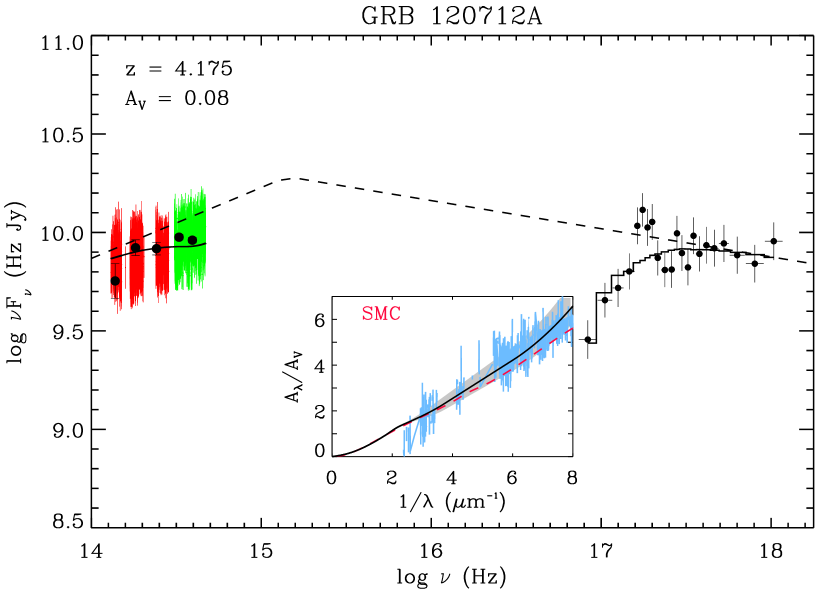
4.3 GRB 120712A
The X-shooter spectra of GRB 120712A () were obtained at 11.04 hours after the burst trigger. Photometric data are obtained from Bolmer et al. (2018) in the and bands from GROND at 10.43 hours after the burst. The and -band data are used to scale the VIS and NIR arm spectra, respectively. The SED is fit well with a broken power-law and an SMC-like extinction curve () with mag. Due to the shape of the photometric data, we also attempted to fit the GROND-XRT SED using a fixed Pei (1992) SMC law. The photometric SED is fit well with a broken power-law and mag. Previously, Bolmer et al. (2018) find that the photometric SED at 10.6 hrs is fit well with a broken power-law and an SMC curve with mag, consistent with our findings.
| GRB | log | /dof | NHP% | ||||||||
|---|---|---|---|---|---|---|---|---|---|---|---|
| 1022 cm-2 | Hz | m | m2 | mag | prob. | ||||||
| 110818A | 1.02/34827 | 0.40 | |||||||||
| 0.98/34825 | 100† | ||||||||||
| 111123A | 0.99/37065 | 91.0 | |||||||||
| 0.41 | 0.99/37063 | 97.0† | |||||||||
| 120712A | 1.24/29055 | ||||||||||
| 0.99/29053 | 96.0† | ||||||||||
| 121201A | 1.00/32050 | ||||||||||
| 0.95/32048 | 100† | ||||||||||
| 130408A | 1.01/26868 | 23.0 | |||||||||
| 1.01/26866 | 26.0† | ||||||||||
| 140311A | 0.75/15536 | 100† | |||||||||
| 1.21/15538 | 0.00 | ||||||||||
| 140515A | 0.97/19553 | 100† | |||||||||
| 1.14/19555 | 0.00 | ||||||||||
| 140614A | 1.02/20516 | ||||||||||
| 0.93/20514 | 100† | ||||||||||
| 151027B | 1.07/28725 | ||||||||||
| 1.01/28723 | † | ||||||||||
| 170202A | 1.06/26322 | ||||||||||
| 1.02/26320 | † | ||||||||||
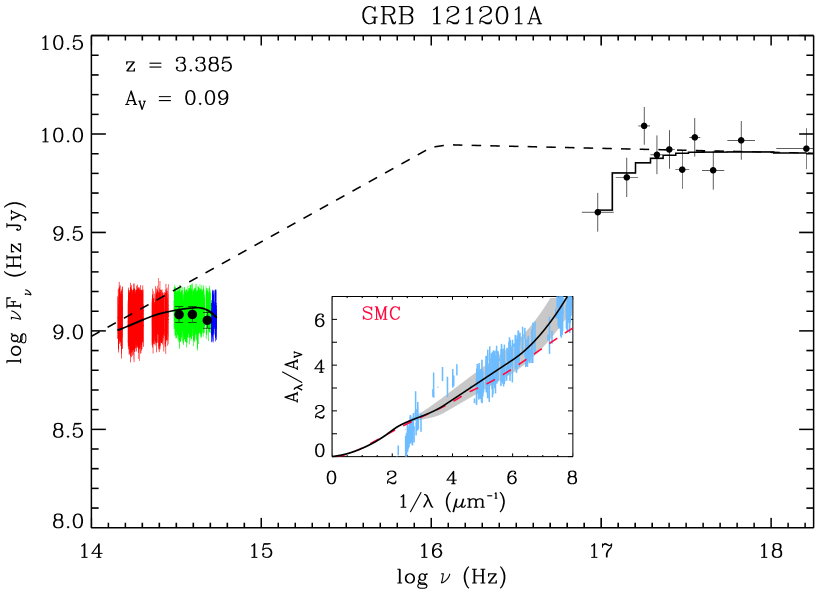
4.4 GRB 121201A
The X-shooter spectra of GRB 121201A () were obtained at 12.87 hours after the burst trigger. Photometric data were taken with GROND in the and bands from Krühler et al. (2012a). We used the -band magnitude for the SED normalisation. The X-ray to the NIR SED is fit well with a broken power-law and and a featureless extinction curve () with mag.
4.5 GRB 130408A
The X-shooter spectra of the afterglow of GRB 130408A () were taken at hours after the burst. Photometric data from GROND are reported at 1.5 hours after the burst (Sudilovsky et al., 2013) in the and bands. We used the and -band data to normalise the VIS and NIR arm spectra, respectively. The SED provides a good fit with a broken power-law and a featureless extinction curve () with mag. The GROND-XRT SED alone suggests a broken power-law with mag (using a fixed Pei 1992 SMC extinction curve) describe the data well. Previously, Wiseman et al. (2017) reported mag for this burst, consistent with our results.
4.6 GRB 140311A
The X-shooter spectra of GRB 140311A () were taken at 32.5 hours after the burst trigger. Nordic Optical Telescope (NOT) photometry in the band is available at 27.89 hours after the burst from Malesani et al. (2014). We normalised the X-shooter spectra to the level of the NOT photometry to fit the intrinsic extinction curve. The SED prefers a single power-law and a featureless steep extinction curve () with mag. Bolmer et al. (2018) found that GROND-XRT data at 9.8 hours are fit well with a single power-law and an SMC extinction curve with mag, consistent within 2. However, Laskar et al. (2018) found that the X-ray to optical SED is best described by the extinction of mag at 0.4 days after the burst.
4.7 GRB 140515A
The spectra of the highest redshift burst () of our sample were taken with X-shooter at hours after the burst trigger. At 16.83 hours after the burst, photometric data in the and bands were taken with GROND by Bolmer et al. (2018). We normalised the X-shooter observations to the -band photometric data. The SED at 16.83 hours after the burst is fit well with a single power-law and no extinction with mag. The GROND-XRT SED also suggests a best-fit with a single power-law and mag. Bolmer et al. (2018) reported no dust extinction with mag from the GROND-XRT analysis at 14.6 hours after the burst, consistent with our findings. Previously, Melandri et al. (2015) found the SED of this burst prefers an SMC-type extinction curve with a small amount of extinction of mag. However, McGuire et al. (2016) found no dust for this burst with mag.
4.8 GRB 140614A
The X-shooter spectra of GRB 140614A () were obtained at 3.9 hours after the burst trigger. GROND photometric data were obtained from Bolmer et al. (2018) in the and bands at 3.15 hours after the burst. We used the and -band data to scale the VIS and NIR arm spectra, respectively. The X-shooter and X-ray spectra are scaled to the photometry. The SED is fit well with a broken power-law and a featureless SMC-like extinction curve () with mag. The GROND-XRT SED fit well with a broken power-law and mag. Previously Bolmer et al. (2018) found the best fit with a broken power-law and an SMC-type extinction curve with mag for this burst at 4.1 hours after the burst, suggesting consistent results.
4.9 GRB 151027B
The X-shooter spectra of GRB 151027B () were acquired at 5.4 hours after the burst. Photometric data at 8.01 hours were obtained with GROND in the and bands (Bolmer et al., 2018). We used the and -band photometry to normalise the VIS and NIR arm spectra, respectively. The SED is fit well with a broken power-law and no dust extinction with mag. The GROND-XRT SED is also fit well with a broken power-law and mag. Previously, Bolmer et al. (2018) found the SED at 8.8 hours for this burst to be well fitted a broken power-law and no extinction with mag, suggesting consistent results. Recently, Greiner et al. (2018) reported that the SED of this burst could be well-explained by a single power-law and a negligible amount of dust with mag.
4.10 GRB 170202A
The X-shooter spectra of the GRB 170202A () afterglow were taken at 9.7 hours after the burst trigger. Suitable photometric observations in the and bands were taken from the 2.1m Otto Struve telescope at the McDonald Observatory at 16 hours after the burst (Im et al., 2017). The band photometry is used for the X-shooter spectra normalisation. The SED prefers a broken power-law and no dust extinction with mag.
4.11 X-ray analysis
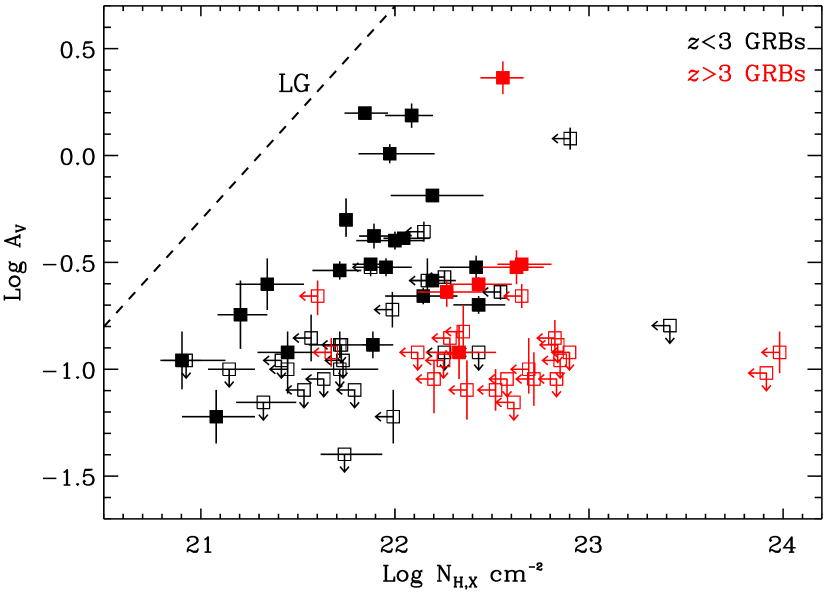
The equivalent hydrogen column densities () derived through the simultaneous X-shooter to X-ray SED fitting for each GRB case are reported in Table 2. We obtained a significant measurement for a single burst in our sample. We combined our and results with other values derived through the spectroscopic optical/NIR to X-ray SED analyses and reported in Zafar et al. (2011a, b, 2018b). We split the data in redshift below and above . The results indicate an increase in the equivalent hydrogen column densities at . Previously, Campana et al. (2012); Starling et al. (2013); Campana et al. (2015) suggested an evolution of with increasing redshift. This increase is interpreted to be due to the growing intergalactic medium absorption at larger distances. In contrast, Buchner et al. (2017) claimed no evolution of with redshift and find that the distribution is an axisymmetric ellipsoid of gas having randomly distributed sources within. Fig. 2 shows the variation below and above . Such an evolution of with redshift has been found by Watson et al. (2013), suggesting helium in H ii regions or metals ejected by the star could be the dominant X-ray absorber. The increase in could also simply be explained by a larger gas column density in GRB hosts at higher redshifts (Heintz et al., 2018).
5 Discussion
5.1 GRB extinction curve
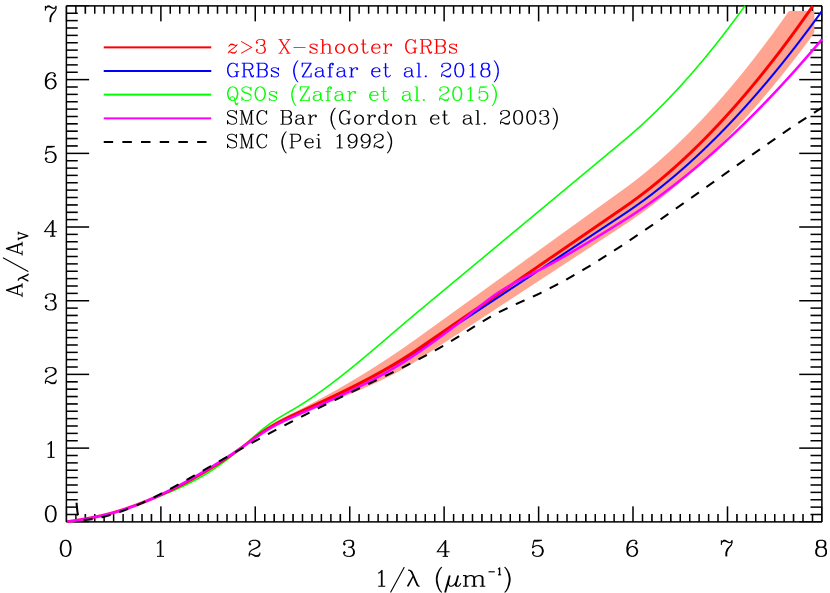
Six GRBs in our sample are extinguished and their best-fit extinction parameters are provided in Table 2. We calculated the weighted mean () values and standard deviations of our extinction curve parameters (see last row of Table 2). The of our sample is found to be (with a scatter of 0.22), consistent with the value of by Zafar et al. (2018b) for bursts at all redshifts. We combined our six best-fit extinction curve results with the three dusty X-shooter GRBs (GRB 090313, GRB 100219A, and GRB 111008A) presented in the sample of Zafar et al. (2018b). This is done to generate an intrinsic extinction curve for X-shooter GRBs, resulting in , , and and . The resultant extinction curve for all X-shooter selected GRB afterglows is shown in Fig. 3 with its 1 error as shaded area. The extinction curve is further compared with the previously selected X-shooter GRB sample (Zafar et al., 2018b), a sub-sample of dusty quasars (QSOs; Zafar et al. 2015) found through the High quasar (HAQ; Krogager et al. 2015) survey, SMC Bar (Gordon et al., 2003) and the typically used SMC-type Pei (1992) extinction curves. Using the Kolmogorov-Smirnov statistics, the GRB extinction curve deviates from the canonical SMC-type curve at % confidence level but is consistent at % confidence level with the SMC-Bar extinction curve. For this reason, we suggest to use the SMC Bar extinction curve (Gordon et al., 2003) rather than the Pei (1992) SMC law for fitting the data with featureless extinction curves.
5.2 Dust at high-redshift
The restframe visual extinction for seven dusty GRBs in our sample ranges from to mag. The remaining five are consistent with no extinction within their 3 limits given in Table 2. We combined our sample with the spectroscopic GRB samples of Zafar et al. (2011a, b, 2018b) and Zafar et al. (2018a). This was done to be consistent throughout to compare samples where dust content is estimated using the spectroscopic SEDs. In Fig. 4 we plot the visual extinction of this ‘full redshift coverage’ sample versus redshift. It is seen that there appears to be an absence of GRB afterglows in the upper right quarter of that figure, i.e. an under-density of sighlines with moderate and higher ( mag) visual extinction at . A similar dearth of high detections at was previously reported by Zafar et al. (2011b), Bolmer et al. (2018). It is clear, however, that both high redshift and extinction will work towards making objects fainter and therefore more difficult to detect. To determine if the distribution of objects in Fig. 4 can be fully explained by the two dimming effects we proceeded as follows.
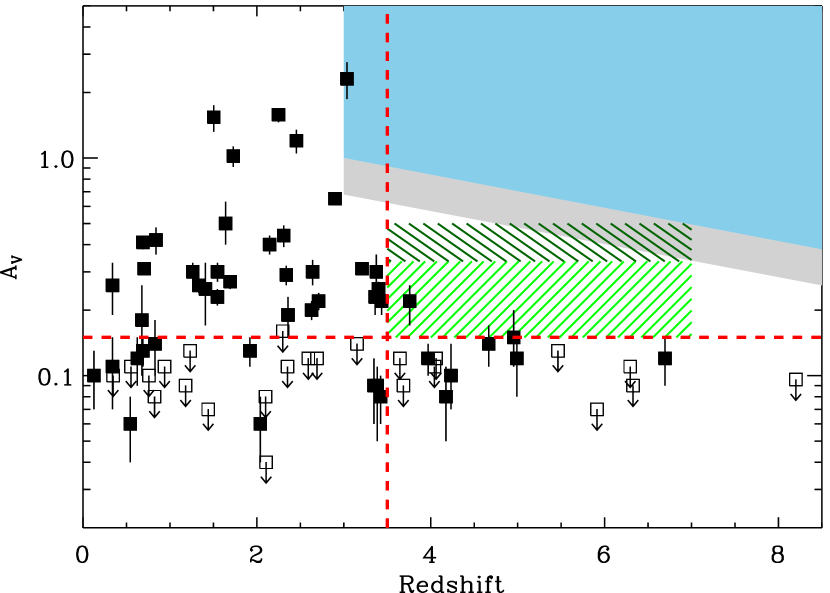
We selected the spectra of GRB 140311A and GRB 140614A as templates to bracket our sample. The former has a steep optical slope () and a single power-law while the latter has a flatter slope () and a broken power-law. We then used the online VLT/X-shooter exposure time calculator (ETC) to calculate the X-shooter detection thresholds. Specifically we calculated the limiting magnitudes for one hour of observation with the same setup as used for the X-shooter ToO GRBs, and found that we would reach magnitudes of 23 and 22 in X-shooter bands and H, respectively. For each of the two template spectra we then redshifted them to a set of redshifts in the range 3 8.5, and for each redshift determined the which would dim the target to the detection threshold. The resulting limits on detectability in the two cases are represented by the two differently shaded (blue and grey) regions in Fig. 4. We find that a moderately bright burst, such as the template of GRB 140311A, is still detectable with an mag at and with an mag back to . However, for the somewhat fainter burst GRB 140614A an of 0.7 and 0.3 mag will form the detection limits at and 8.5, respectively. In other words, for the pessimistic case with objects like GRB 140614A we would expect to find objects in the trapeze shaped area above and to the right of the dashed red lines, but below the lower limit of the grey bar. For the optimistic case (GRB 140311A) we would expect to find objects all the way up to the lower edge of the blue shaded area. To get conservative estimates of the expected number of afterglows which should have been detected in each of the two cases we consider now only the box-shaped hashed areas in Fig. 4. The green hashed box makes up about 60% of the area below the lowest limit, the green+grey hashed box makes up about 60% of the area below the blue limit. For a simple prediction of the expected number we simply scale from the three other quarters. The total number of bursts with below 0.15 mag and is 40, 15 of those found above . In other words, in the right box we have 0.6 times the bursts in the left. We shall assume the same ratio (intrinsically) above mag. In the range corresponding to the green box (between 0.15 and 0.34) we have 20 below and therefore expect 200.6 = 12 in the green box. In the more optimistic case of the larger box ( between 0.15 and 0.50 mag) we expect 250.6 = 15. In both cases we observe only a single burst. Our simple assumption of a constant distribution is therefore rejected at high significance, even in the very conservative case.
Spectroscopic follow-ups are carried out usually on the basis of -band observations and the IGM drop occurring in the -band for bursts leads to many cases not being spectroscopically observed. The number of detected high redshift GRBs will increase with the forthcoming Space Variable Object Monitor (SVOM) mission (Wei et al., 2016). Note that GRB 080607 (Prochaska et al., 2009) is one of the extremely bright cases detected at with mag. Our study is also biased towards having simultaneous spectroscopic and photometric observations. Still a uniformly low dust content indicates a real decrease. Such a real decrease in dust content is a clue towards a change in dust properties at , but could also in part be caused by a not well-understood (though likely small) bias. Bolmer et al. (2018) using GROND photometric observations of GRBs concluded that theoretically they are able to detect mag bursts but on average they find less dusty bursts. However, with their smaller photometric sample they were not able to completely exclude statistical effects.
It is worth mentioning that sub-mm observations of quasars have revealed large dust masses (Beelen et al., 2006; Wang et al., 2013; Willott et al., 2015; Venemans et al., 2017). These high redshift massive quasars are rare objects and not representative of the star-forming galaxy population. And while a few more normal galaxies have been detected in the epoch of reionisation with significant dust (Watson et al., 2015; Laporte et al., 2017), GRBs probe dust in star-forming regions of galaxies well down the faint end slope of the galaxy luminosity function (Tanvir et al., 2017).
5.3 Dust and host galaxy stellar masses
Several studies have shown that a relation exists between stellar mass and dust attenuation of star-forming galaxies (e.g., Pannella et al., 2015; Álvarez-Márquez et al., 2016; McLure et al., 2018). In particular, Dunlop et al. (2017) found the ratio of obscured to un-obscured star-formation activity to be correlated with the stellar mass for galaxies at (see their Fig. 13), suggesting that the drop-off in dust-obscured star-formation density at high redshifts is due to lower number of high-mass galaxies at those redshifts (see Bouwens et al., 2012, 2014, 2016).
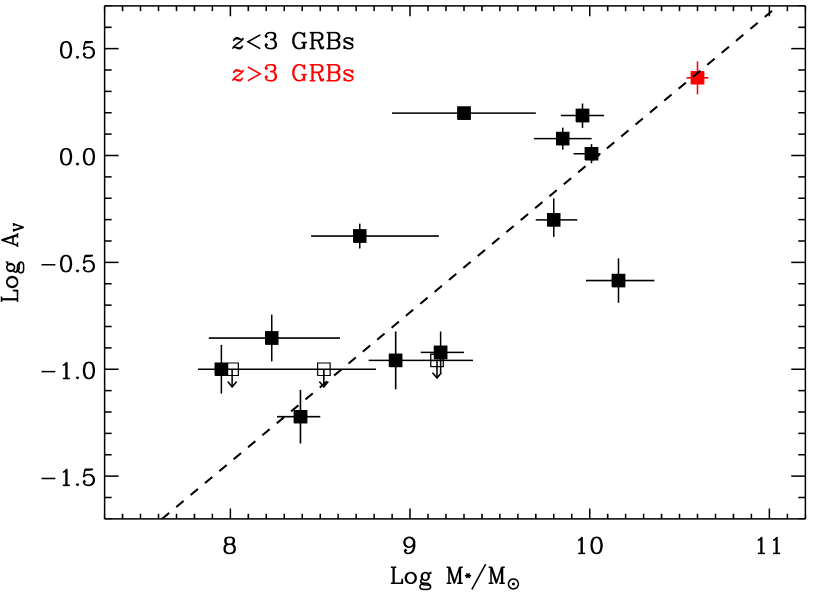
We investigate a possible link between the drop in the values of our GRB host sample at as reported in §5.2 and the redshift dependent galaxy luminosity function which predicts a small number of massive galaxies at those redshifts, we searched the literature for stellar mass measurements of the GRB host sample presented in Fig. 4. These measurements are available for 16 GRB hosts (see http://www.grbhosts.org; Arabsalmani et al., 2018, and references therein), spanning a range between over a redshift range of . We find a clear correlation (Pearson correlation coefficient ), with (obtained for single sightline using GRB afterglows) rising with stellar mass from at , to at (Fig. 5). We therefore conclude that the drop-off in for our GRB hosts at could simple reflect that the stellar masses of GRB host galaxies at those redshifts are smaller than those of GRB host galaxies at lower redshifts. (see also Tanvir et al., 2012; McGuire et al., 2016; Corre et al., 2018). However, note that GRB host observations are biased against dust.
There is a population of GRBs (%) which do not have identified optical afterglows and are referred to as “dark” GRBs (e.g. Fynbo et al., 2009). This optical bias removes GRBs that are very faint, at very high redshift, or in dusty environments. These ‘dark’ GRBs are found to reside mostly in dusty and massive galaxies galaxies (Rossi et al., 2012; Krühler et al., 2012b; Perley et al., 2013; Krühler et al., 2015; Perley et al., 2016). This also suggests that the dust drop at higher redshift is indicative of the presence of lower stellar mass galaxies at those redshifts.
5.4 Dust producers
In the young Universe at , dust production in CCSN ejecta is one viable source of dust (Todini & Ferrara, 2001; Morgan & Edmunds, 2003; Marchenko, 2006; Hirashita et al., 2005; Dwek et al., 2007). However, dust destruction by the SN reverse shock (Nozawa et al., 2007; Bianchi & Schneider, 2007; Schneider et al., 2012; Lakićević et al., 2015) and a contribution from AGB stars at high redshift (Valiante et al., 2009; Hirashita et al., 2014) is still under debate. Observations of local CCSN remnants suggest dust production of several tenths of a solar mass per remnant, close to maximal dust production from all of the refractory elements synthesised in the core collapse (Lucy et al., 1989; Wooden et al., 1993; Sakon et al., 2009; Gomez et al., 2012; De Looze et al., 2017). SNe Ia, on the other hand, appear to produce no significant dust directly (Gomez et al., 2009). Finally, there is significant evidence of dust growth in the ISM (Jenkins, 2009; De Cia et al., 2016). Whatever the origin of the dust, the elements must first be synthesised.
Evolved, lower mass stars, either as AGB stars or Type Ia SNe, are thought to be the major contributors to the two elements that make up at least half the dust mass in the local universe: carbon and iron (Gehrz, 1989; Dwek et al., 2007). The low and intermediate mass AGB stars (with initial masses ) require 1 Gyr to evolve and produce carbon (Dwek et al., 2007). Similarly, Type Ia SNe begin to be important at (Strolger et al., 2005). The first stars – the so-called Pop III stars, free of heavy elements – are thought to form Myr after the Big Bang (Bromm et al., 1999; Abel et al., 2002; Karlsson et al., 2013).
A debate about the primordial initial mass function means that we still do not know the distribution of stellar masses in the early Universe (Gall et al., 2011). There could be both low and high (7–8 M⊙) mass AGB stars present. AGB stars with masses exceeding about 2 M⊙ are expected to experience hot bottom burning (hereafter HBB, Siess et al. 2002; Constantino et al. 2014) and hence most of the carbon produced during the AGB phase is burned into (primary) nitrogen. However, as the envelope mass decreases, HBB stops but dredge-up continues (Frost et al., 1998; Tashibu et al., 2017) with the result that these massive stars spend a brief period as C-stars near the ends of their lives. Hence even these massive AGB stars can contribute to the carbon content in the early universe. Further, super-AGB stars of very low metallicity can also produce substantial amounts of silicon isotopes (Gil Pons, private communication). Their short lives mean that they can form from the ejecta of early Pop III SNe and possibly contribute to the production of silicate dust in the early universe.
Calculations show that primordial stars of 1.5 M⊙ have lifetimes of about 1.6 Gyr (Marigo et al., 2001; Siess et al., 2002). These stars become carbon stars during their AGB phase and when they reach the end of their lives they produce carbonaceous dust. But more importantly they are expected to produce significant amounts of elemental carbon, which is required even for non-stellar sources of dust production. Further, at the first Type Ia supernovae start to appear. These are expected to be a significant source of iron, a major component of the dust in the ISM.
Thus we hypothesise that the large injection of carbon and iron could be the cause of the increase in dust content at lower redshifts. It is at this redshift that the ISM begins to be enriched in ejecta from the first Type Ia supernovae, as well as the first stars that do not experience HBB, i.e. the sudden increase in dust content is enabled by new stellar sources of carbon and iron. Specifically we suggest that the carbon is produced by normal, albeit Pop III, AGB stars of masses about 1.6–2 M⊙, and the iron is provided by the first Type Ia supernovae. One caveat to this hypothesis is that GRB host galaxies are star-forming–dominated galaxies with young stellar ages (Schulze et al., 2015). However, this does not preclude earlier generations of stars in these galaxies.
It may also be feasible that the transition we observe to greater dust in star-forming regions at and the one detected in dust-emitting galaxies (Dunlop et al., 2017), is a more gradual process, simply due to increasing overall metallicity in the star-forming galaxies caused by greater numbers of CCSNe.
6 Conclusions
In this work, we derive individual extinction curves of GRB afterglows to study dust properties at . We use a sample of GRBs observed with the VLT/X-shooter, finding 10 new cases where simultaneous photometric observations are available. After correcting sub-optimal flux calibration through photometry and generating SEDs, we find that six out of 10 GRBs are dusty. We combine the individual extinction curves of all GRBs observed with X-shooter. The mean GRB extinction curve is consistent with the SMC-Bar curve from Gordon et al. (2003). We compare visual extinctions of spectroscopically-selected GRBs at all redshifts, indicating a decrease at , with no moderately extinguished event. We further check for observational biases using template spectra, up to a burst is detectable with an hour of X-shooter time with an mag with dust content increasing towards lower redshifts. This suggests that the lack of high redshift moderately extinguished GRBs is not due to instrument sensitivity, although there are other observational biases noted. The uniformly low dust values indicate a decrease in dust content for suggesting a transition in the nature of dust producers. Evolved low and intermediate mass AGB stars require Gyr to produce the carbon that plays such an important role in the formation of dust. We postulate that the dramatic increase in dust content at is enabled by the production of elements from two lower mass stellar sources occurring at the same time and for the first time: carbon from the death of the first AGB stars that are not massive enough for HBB, i.e. from the death of primordial carbon stars, and iron from the first Type Ia SNe. Alternatively, the dust content drop at could be the result of the low stellar mass of the GRB host galaxies at such redshifts.
Acknowledgements
We are thankful to James Dunlop for a useful referee report. TZ is thankful to Maryam Arabsalmani for helpful discussions. The X-ray data for this work are obtained from the UK Swift Science Data Center at the University of Leicester. We are thankful to Pilar Gil Pons and Carolyn Doherty for useful discussions. DW is supported by Independent Research Fund Denmark grant DFF - 7014-00017. JJ acknowledges support from NOVA and NWO-FAPESP grant for advanced instrumentation in astronomy.
References
- Abel et al. (2002) Abel, T., Bryan, G. L., & Norman, M. L. 2002, Science, 295, 93
- Álvarez-Márquez et al. (2016) Álvarez-Márquez, J., Burgarella, D., Heinis, S., et al. 2016, A&A, 587, A122
- Anders & Grevesse (1989) Anders, E. & Grevesse, N. 1989, Geochim. Cosmochim. Acta, 53, 197
- Arabsalmani et al. (2018) Arabsalmani, M., Møller, P., Perley, D. A., et al. 2018, MNRAS, 473, 3312
- Arnaud (1996) Arnaud, K. A. 1996, in Astronomical Society of the Pacific Conference Series, Vol. 101, Astronomical Data Analysis Software and Systems V, ed. G. H. Jacoby & J. Barnes, 17
- Atek et al. (2014) Atek, H., Kunth, D., Schaerer, D., et al. 2014, A&A, 561, A89
- Beelen et al. (2006) Beelen, A., Cox, P., Benford, D. J., et al. 2006, ApJ, 642, 694
- Beuermann et al. (1999) Beuermann, K., Hessman, F. V., Reinsch, K., et al. 1999, A&A, 352, L26
- Bevan & Barlow (2016) Bevan, A. & Barlow, M. J. 2016, MNRAS, 456, 1269
- Bianchi & Schneider (2007) Bianchi, S. & Schneider, R. 2007, MNRAS, 378, 973
- Bolmer et al. (2018) Bolmer, J., Greiner, J., Krühler, T., et al. 2018, A&A, 609, A62
- Bouwens et al. (2016) Bouwens, R. J., Aravena, M., Decarli, R., et al. 2016, ApJ, 833, 72
- Bouwens et al. (2012) Bouwens, R. J., Illingworth, G. D., Oesch, P. A., et al. 2012, ApJ, 754, 83
- Bouwens et al. (2014) Bouwens, R. J., Illingworth, G. D., Oesch, P. A., et al. 2014, ApJ, 793, 115
- Bromm et al. (1999) Bromm, V., Coppi, P. S., & Larson, R. B. 1999, ApJL, 527, L5
- Buchner et al. (2017) Buchner, J., Schulze, S., & Bauer, F. E. 2017, MNRAS, 464, 4545
- Burrows et al. (2005) Burrows, D. N., Hill, J. E., Nousek, J. A., et al. 2005, Space Sci. Rev., 120, 165
- Calzetti et al. (1994) Calzetti, D., Kinney, A. L., & Storchi-Bergmann, T. 1994, ApJ, 429, 582
- Campana et al. (2015) Campana, S., Salvaterra, R., Ferrara, A., & Pallottini, A. 2015, A&A, 575, A43
- Campana et al. (2012) Campana, S., Salvaterra, R., Melandri, A., et al. 2012, MNRAS, 421, 1697
- Cano et al. (2017) Cano, Z., Wang, S.-Q., Dai, Z.-G., & Wu, X.-F. 2017, Advances in Astronomy, 2017, 8929054
- Constantino et al. (2014) Constantino, T., Campbell, S., Gil-Pons, P., & Lattanzio, J. 2014, ApJ, 784, 56
- Cooray et al. (2014) Cooray, A., Calanog, J., Wardlow, J. L., et al. 2014, ApJ, 790, 40
- Corre et al. (2018) Corre, D., Buat, V., Basa, S., et al. 2018, arXiv:1807.00635
- D’Avanzo et al. (2011) D’Avanzo, P., Sparre, M., Watson, D., et al. 2011, GRB Coordinates Network,, 12284
- De Cia et al. (2016) De Cia, A., Ledoux, C., Mattsson, L., et al. 2016, A&A, 596, A97
- De Looze et al. (2016) De Looze, I., Baes, M., Bendo, G. J., et al. 2016, MNRAS, 459, 3900
- De Looze et al. (2017) De Looze, I., Barlow, M. J., Swinyard, B. M., et al. 2017, MNRAS, 465, 3309
- Draine & Fraisse (2009) Draine, B. T. & Fraisse, A. A. 2009, ApJ, 696, 1
- Dunlop et al. (2017) Dunlop, J. S., McLure, R. J., Biggs, A. D., et al. 2017, MNRAS, 466, 861
- Dwek et al. (2007) Dwek, E., Galliano, F., & Jones, A. P. 2007, ApJ, 662, 927
- Evans et al. (2009) Evans, P. A., Beardmore, A. P., Page, K. L., et al. 2009, MNRAS, 397, 1177
- Ferrara et al. (2017) Ferrara, A., Hirashita, H., Ouchi, M., & Fujimoto, S. 2017, MNRAS, 471, 5018
- Fitzpatrick & Massa (1990) Fitzpatrick, E. L. & Massa, D. 1990, ApJS, 72, 163
- Frost et al. (1998) Frost, C. A., Cannon, R. C., Lattanzio, J. C., Wood, P. R., & Forestini, M. 1998, A&A, 332, L17
- Fynbo et al. (2009) Fynbo, J. P. U., Jakobsson, P., Prochaska, J. X., et al. 2009, ApJS, 185, 526
- Galama et al. (1998) Galama, T. J., Vreeswijk, P. M., van Paradijs, J., et al. 1998, Nature, 395, 670
- Gall et al. (2011) Gall, C., Hjorth, J., & Andersen, A. C. 2011, A&ARv, 19, 43
- Gall et al. (2014) Gall, C., Hjorth, J., Watson, D., et al. 2014, Nature, 511, 326
- Gallerani et al. (2010) Gallerani, S., Maiolino, R., Juarez, Y., et al. 2010, A&A, 523, A85
- Gehrels et al. (2004) Gehrels, N., Chincarini, G., Giommi, P., et al. 2004, ApJ, 611, 1005
- Gehrels et al. (2009) Gehrels, N., Ramirez-Ruiz, E., & Fox, D. B. 2009, ARAA, 47, 567
- Gehrz (1989) Gehrz, R. 1989, in IAU Symposium, Vol. 135, Interstellar Dust, ed. L. J. Allamandola & A. G. G. M. Tielens, 445
- Gomez et al. (2009) Gomez, H. L., Dunne, L., Ivison, R. J., et al. 2009, MNRAS, 397, 1621
- Gomez et al. (2012) Gomez, H. L., Krause, O., Barlow, M. J., et al. 2012, ApJ, 760, 96
- Gordon et al. (1997) Gordon, K. D., Calzetti, D., & Witt, A. N. 1997, ApJ, 487, 625
- Gordon et al. (2003) Gordon, K. D., Clayton, G. C., Misselt, K. A., Landolt, A. U., & Wolff, M. J. 2003, ApJ, 594, 279
- Granot & Sari (2002) Granot, J. & Sari, R. 2002, ApJ, 568, 820
- Greiner et al. (2018) Greiner, J., Bolmer, J., Wieringa, M., et al. 2018, A&A, 614, A29
- Greiner et al. (2011) Greiner, J., Krühler, T., Klose, S., et al. 2011, A&A, 526, A30
- Hayes et al. (2011) Hayes, M., Schaerer, D., Östlin, G., et al. 2011, ApJ, 730, 8
- Heintz et al. (2018) Heintz, K. E., Watson, D., Jakobsson, P., et al. 2018, MNRAS
- Hirashita et al. (2014) Hirashita, H., Ferrara, A., Dayal, P., & Ouchi, M. 2014, MNRAS, 443, 1704
- Hirashita et al. (2005) Hirashita, H., Nozawa, T., Kozasa, T., Ishii, T. T., & Takeuchi, T. T. 2005, MNRAS, 357, 1077
- Hjorth et al. (2003) Hjorth, J., Sollerman, J., Møller, P., et al. 2003, Nature, 423, 847
- Hjorth et al. (2013) Hjorth, J., Vreeswijk, P. M., Gall, C., & Watson, D. 2013, ApJ, 768, 173
- Im et al. (2017) Im, M., Kim, Y., Kim, J., Struve, O., & McDonald. 2017, GRB Coordinates Network,, 20594
- Inoue (2005) Inoue, A. K. 2005, MNRAS, 359, 171
- Japelj et al. (2015) Japelj, J., Covino, S., Gomboc, A., et al. 2015, A&A, 579, A74
- Jenkins (2009) Jenkins, E. B. 2009, ApJ, 700, 1299
- Kalberla et al. (2005) Kalberla, P. M. W., Burton, W. B., Hartmann, D., et al. 2005, A&A, 440, 775
- Kann et al. (2010) Kann, D. A., Klose, S., Zhang, B., et al. 2010, ApJ, 720, 1513
- Karlsson et al. (2013) Karlsson, T., Bromm, V., & Bland-Hawthorn, J. 2013, Reviews of Modern Physics, 85, 809
- Koprowski et al. (2017) Koprowski, M. P., Dunlop, J. S., Michałowski, M. J., et al. 2017, MNRAS, 471, 4155
- Krogager et al. (2015) Krogager, J.-K., Geier, S., Fynbo, J. P. U., et al. 2015, ApJS, 217, 5
- Krühler et al. (2012a) Krühler, T., Klose, S., & Greiner, J. 2012a, GRB Coordinates Network,, 14031
- Krühler et al. (2015) Krühler, T., Malesani, D., Fynbo, J. P. U., et al. 2015, A&A, 581, A125
- Krühler et al. (2012b) Krühler, T., Malesani, D., Milvang-Jensen, B., et al. 2012b, ApJ, 758, 46
- Lakićević et al. (2015) Lakićević, M., van Loon, J. T., Meixner, M., et al. 2015, ApJ, 799, 50
- Laporte et al. (2017) Laporte, N., Ellis, R. S., Boone, F., et al. 2017, ApJL, 837, L21
- Laskar et al. (2018) Laskar, T., Berger, E., Chornock, R., et al. 2018, ApJ, 858, 65
- Lucy et al. (1989) Lucy, L. B., Danziger, I. J., Gouiffes, C., & Bouchet, P. 1989, in Lecture Notes in Physics, Berlin Springer Verlag, Vol. 350, IAU Colloq. 120: Structure and Dynamics of the Interstellar Medium, ed. G. Tenorio-Tagle, M. Moles, & J. Melnick, 164
- Maiolino et al. (2004) Maiolino, R., Schneider, R., Oliva, E., et al. 2004, Nature, 431, 533
- Malesani et al. (2014) Malesani, D., D’Avanzo, P., & Martinez Osorio, Y. F. 2014, GRB Coordinates Network,, 15980
- Marchenko (2006) Marchenko, S. V. 2006, in Astronomical Society of the Pacific Conference Series, Vol. 353, Stellar Evolution at Low Metallicity: Mass Loss, Explosions, Cosmology, ed. H. J. G. L. M. Lamers, N. Langer, T. Nugis, & K. Annuk, 299
- Marigo et al. (2001) Marigo, P., Girardi, L., Chiosi, C., & Wood, P. R. 2001, A&A, 371, 152
- Matsuura et al. (2009) Matsuura, M., Barlow, M. J., Zijlstra, A. A., et al. 2009, MNRAS, 396, 918
- Mattsson et al. (2014) Mattsson, L., De Cia, A., Andersen, A. C., & Zafar, T. 2014, MNRAS, 440, 1562
- McGuire et al. (2016) McGuire, J. T. W., Tanvir, N. R., Levan, A. J., et al. 2016, ApJ, 825, 135
- McLure et al. (2013) McLure, R. J., Dunlop, J. S., Bowler, R. A. A., et al. 2013, MNRAS, 432, 2696
- McLure et al. (2018) McLure, R. J., Dunlop, J. S., Cullen, F., et al. 2018, MNRAS, 476, 3991
- Meixner et al. (2006) Meixner, M., Gordon, K. D., Indebetouw, R., et al. 2006, AJ, 132, 2268
- Melandri et al. (2015) Melandri, A., Bernardini, M. G., D’Avanzo, P., et al. 2015, A&A, 581, A86
- Mészáros & Rees (1997) Mészáros, P. & Rees, M. J. 1997, ApJ, 476, 232
- Michałowski (2015) Michałowski, M. J. 2015, A&A, 577, A80
- Michałowski et al. (2012) Michałowski, M. J., Dunlop, J. S., Cirasuolo, M., et al. 2012, A&A, 541, A85
- Modigliani et al. (2010) Modigliani, A., Goldoni, P., Royer, F., et al. 2010, in Proc. SPIE, Vol. 7737, Observatory Operations: Strategies, Processes, and Systems III, 773728
- Morgan & Edmunds (2003) Morgan, H. L. & Edmunds, M. G. 2003, MNRAS, 343, 427
- Nilsson & Møller (2009) Nilsson, K. K. & Møller, P. 2009, A&A, 508, L21
- Nilsson et al. (2009) Nilsson, K. K., Tapken, C., Møller, P., et al. 2009, A&A, 498, 13
- Nozawa et al. (2007) Nozawa, T., Kozasa, T., Habe, A., et al. 2007, ApJ, 666, 955
- Pannella et al. (2015) Pannella, M., Elbaz, D., Daddi, E., et al. 2015, ApJ, 807, 141
- Pei (1992) Pei, Y. C. 1992, ApJ, 395, 130
- Perley et al. (2016) Perley, D. A., Krühler, T., Schulze, S., et al. 2016, ApJ, 817, 7
- Perley et al. (2013) Perley, D. A., Levan, A. J., Tanvir, N. R., et al. 2013, ApJ, 778, 128
- Prochaska et al. (2009) Prochaska, J. X., Sheffer, Y., Perley, D. A., et al. 2009, ApJL, 691, L27
- Rossi et al. (2012) Rossi, A., Klose, S., Ferrero, P., et al. 2012, A&A, 545, A77
- Rossi et al. (2011) Rossi, A., Nicuesa Guelbenzu, A., Klose, S., Afonso, P., & Greiner, J. 2011, GRB Coordinates Network,, 12595
- Rowlands et al. (2014) Rowlands, K., Gomez, H. L., Dunne, L., et al. 2014, MNRAS, 441, 1040
- Sakon et al. (2009) Sakon, I., Onaka, T., Wada, T., et al. 2009, ApJ, 692, 546
- Sari et al. (1998) Sari, R., Piran, T., & Narayan, R. 1998, ApJL, 497, L17
- Schady et al. (2012) Schady, P., Dwelly, T., Page, M. J., et al. 2012, A&A, 537, A15
- Schlafly & Finkbeiner (2011) Schlafly, E. F. & Finkbeiner, D. P. 2011, ApJ, 737, 103
- Schlegel et al. (1998) Schlegel, D. J., Finkbeiner, D. P., & Davis, M. 1998, ApJ, 500, 525
- Schneider et al. (2012) Schneider, R., Omukai, K., Bianchi, S., & Valiante, R. 2012, MNRAS, 419, 1566
- Schulze et al. (2015) Schulze, S., Chapman, R., Hjorth, J., et al. 2015, ApJ, 808, 73
- Selsing et al. (2018) Selsing, J., Malesani, D., Goldoni, P., et al. 2018, arXiv:1802.07727
- Siess et al. (2002) Siess, L., Livio, M., & Lattanzio, J. 2002, ApJ, 570, 329
- Starling et al. (2013) Starling, R. L. C., Willingale, R., Tanvir, N. R., et al. 2013, MNRAS, 431, 3159
- Strolger et al. (2005) Strolger, L.-G., Riess, A. G., & Dahlen, T. 2005, in Astronomical Society of the Pacific Conference Series, Vol. 342, 1604-2004: Supernovae as Cosmological Lighthouses, ed. M. Turatto, S. Benetti, L. Zampieri, & W. Shea, 471
- Sudilovsky et al. (2013) Sudilovsky, V., Nicuesa Guelbenzu, A., & Greiner, J. 2013, GRB Coordinates Network,, 14364
- Tanvir et al. (2009) Tanvir, N. R., Fox, D. B., Levan, A. J., et al. 2009, Nature, 461, 1254
- Tanvir et al. (2017) Tanvir, N. R., Laskar, T., Levan, A. J., et al. 2017, arXiv:1703.09052
- Tanvir et al. (2012) Tanvir, N. R., Levan, A. J., Fruchter, A. S., et al. 2012, ApJ, 754, 46
- Tashibu et al. (2017) Tashibu, S., Yasuda, Y., & Kozasa, T. 2017, MNRAS, 466, 1709
- Temim et al. (2017) Temim, T., Dwek, E., Arendt, R. G., et al. 2017, ApJ, 836, 129
- Todini & Ferrara (2001) Todini, P. & Ferrara, A. 2001, MNRAS, 325, 726
- Valiante et al. (2009) Valiante, R., Schneider, R., Bianchi, S., & Andersen, A. C. 2009, MNRAS, 397, 1661
- Venemans et al. (2017) Venemans, B. P., Walter, F., Decarli, R., et al. 2017, ApJL, 851, L8
- Vernet et al. (2011) Vernet, J., Dekker, H., D’Odorico, S., et al. 2011, A&A, 536, A105
- Wang et al. (2013) Wang, R., Wagg, J., Carilli, C. L., et al. 2013, ApJ, 773, 44
- Watson (2011) Watson, D. 2011, A&A, 533, A16
- Watson et al. (2015) Watson, D., Christensen, L., Knudsen, K. K., et al. 2015, Nature, 519, 327
- Watson et al. (2006) Watson, D., Fynbo, J. P. U., Ledoux, C., et al. 2006, ApJ, 652, 1011
- Watson et al. (2013) Watson, D., Zafar, T., Andersen, A. C., et al. 2013, ApJ, 768, 23
- Wei et al. (2016) Wei, J., Cordier, B., Antier, S., et al. 2016, arXiv:1610.06892
- Wesson et al. (2010) Wesson, R., Barlow, M. J., Ercolano, B., et al. 2010, MNRAS, 403, 474
- Willingale et al. (2013) Willingale, R., Starling, R. L. C., Beardmore, A. P., Tanvir, N. R., & O’Brien, P. T. 2013, MNRAS, 431, 394
- Willott et al. (2015) Willott, C. J., Bergeron, J., & Omont, A. 2015, ApJ, 801, 123
- Wilms et al. (2000) Wilms, J., Allen, A., & McCray, R. 2000, ApJ, 542, 914
- Wiseman et al. (2017) Wiseman, P., Schady, P., Bolmer, J., et al. 2017, A&A, 599, A24
- Wooden et al. (1993) Wooden, D. H., Rank, D. M., Bregman, J. D., et al. 1993, ApJS, 88, 477
- Woosley (1993) Woosley, S. E. 1993, ApJ, 405, 273
- Zafar et al. (2018a) Zafar, T., Heintz, K. E., Fynbo, J. P. U., et al. 2018a, ApJL, 860, L21
- Zafar et al. (2015) Zafar, T., Møller, P., Watson, D., et al. 2015, A&A, 584, A100
- Zafar et al. (2012) Zafar, T., Watson, D., Elíasdóttir, Á., et al. 2012, ApJ, 753, 82
- Zafar et al. (2011a) Zafar, T., Watson, D., Fynbo, J. P. U., et al. 2011a, A&A, 532, A143
- Zafar et al. (2018b) Zafar, T., Watson, D., Møller, P., et al. 2018b, MNRAS
- Zafar et al. (2011b) Zafar, T., Watson, D. J., Tanvir, N. R., et al. 2011b, ApJ, 735, 2