Combined limit on the production of a light gauge boson decaying into and
Abstract
We searched for the decay of a light vector gauge boson, also known as dark photon, in the process by means of the Initial State Radiation (ISR) method. We used 1.93 fb-1 of data collected by the KLOE experiment at the DANE -factory. No structures have been observed over the irreducible background. A 90% CL limit on the ratio between the dark coupling constant and the fine structure constant of has been set in the dark photon mass region between 519 MeV and 973 MeV. This new limit has been combined with the published result obtained investigating the hypothesis of the dark photon decaying into hadrons in events. The combined 90% CL limit increases the sensitivity especially in the interference region and excludes greater than . For dark photon masses greater than 600 MeV the combined limit is lower than 8 resulting more stringent than present constraints from other experiments.
keywords:
collisions , dark forces , gauge vector boson , upper limits1 Introduction
Many gravitational anomalies observed since the first decades of the twentieth century, as well as large-scale structure formation in the early Universe, can be explained by the existence of a non-baryonic matter known as dark matter (DM) [1]. Dark matter motivates extending the Standard Model of particle physics (SM) to include a dark sector consisting of fields and particles with no SM gauge charges and including extra gauge symmetries. The minimal extension of the SM consists of just one additional abelian gauge symmetry with associated a light vector gauge boson, the dark photon – known also as boson, or – as mediator of the new force, called for this reason dark force. In the simplest scenario [2], the coupling with SM particles arises from a vector portal known as kinetic mixing consisting in loops of heavy dark particles charged under both the electromagnetic and the dark force. The portal allows the mixing of the dark photon belonging to the group with the SM photon of the symmetry introducing the Lagrangian term:
| (1) |
Here is a dimensionless parameter which governs the strength of the mixing (, is the effective dark coupling constant) while and are the field strength tensors of the SM and dark gauge groups, respectively. Through the portal the boson can couple to the electromagnetic current with a strength proportional to the SM particles electric charge. The process is responsible for both production and decay of the dark photon in SM interactions thus resulting in an suppression. If the kinetic mixing appears at the one-loop level, can be estimated to be in the range allowing visible effects at high luminosity colliders [3].
During the last decade, the dark photon has been the focus of a world-wide intensive research because considered as possible explanation of many astrophysical puzzling evidences [4].
In this work we investigate the simplest hypothesis of a visibly decaying dark photon looking for resonant production of boson from the continuum, considering as allowed only decays into SM particles.
The signal should appear as a peak in the invariant mass of the final state particles with a width mainly dominated by the invariant mass resolution since the expected -decay width can be considered negligible [5].
KLOE already investigated
(dark Higgsstrahlung) [6], boson in decays of vector particles to pseudoscalars [7, 8], and
the visible decay hypothesis publishing three searches for radiative production in the process, with the boson decaying into: a) [9], using 240 pb-1 of data; b) [10], using a sample of 1.54 fb-1; c) [11] analyzing the whole KLOE data set corresponding to an integrated luminosity of 1.93 fb-1. Searches for muon and pion pairs, with the ISR photon selected at small angle (), cover approximately the same -boson mass range of 520–990 MeV, while for the electron pairs the photon selection was at large angle () allowing to reach a lowest -boson mass of 5 MeV and probing the favoured region [12].
In the present work we extend the statistics of the search to the whole data sample and update the analysis with a new estimate of the background, analogous to the one used for the search. The new search confirms no -boson signal in the dimuon invariant mass spectrum: a new 90% CL exclusion limit in is estimated. This limit is of comparable magnitude with respect to the previous ones, thus a combined search of dark photon decays into both muon and pion pairs
would increase the sensitivity of the single channel searches, particularly, it is more effective in the region of the interference where the search for loses sensitivity.
2 The KLOE detector
The KLOE detector operates at DANE[13], the Frascati -factory. DANE is an collider working at a center of mass energy GeV. Positron and electron beams collide at an angle of 25 mrad, producing mesons nearly at rest. The detector consists of a large cylindrical drift chamber (DC) [14], surrounded by a lead scintillating-fiber electromagnetic calorimeter (EMC) [15]. A superconducting coil around the EMC provides a 0.52 T magnetic field along the bisector of the colliding beams which is taken as the axis of our coordinate system.
The EMC barrel and end-caps cover 98% of the solid angle. Calorimeter modules are read out at both ends by 4880 photomultipliers. Energy and time resolutions are and , respectively. The drift chamber has only stereo wires and is m in diameter, m long. It is built out of carbon-fibers and operates with a low- gas mixture (helium with 10% isobutane). Spatial resolutions are and mm. The momentum resolution for large angle tracks is . The trigger uses both EMC and DC information. Events used in this analysis are triggered by at least two energy deposits larger than 50 MeV in two sectors of the barrel calorimeter [16].
3 data analysis
3.1 Event Selection
We selected candidates by requiring events with two oppositely-charged tracks emitted at large polar angles, , with the undetected ISR photon missing momentum pointing – according to the kinematics – at small polar angles (). The tracks are required to have the point of closest approach to the axis within a cylinder of radius 8 cm and length 15 cm centered at the interaction point. In order to ensure good reconstruction and efficiency, we selected tracks with transverse and longitudinal momentum 160 MeV or 90 MeV, respectively. This separation of track and photon selection regions in the analysis, greatly reduces the contamination from the resonant process , from the Final State Radiation (FSR) processes and , since the cross section diverges at small ISR photon angle making FSR processes and decays relatively unimportant [17, 18, 19, 20]. Consequently, since ISR-photons are mostly collinear with the beam line, a high statistics for the ISR signal events remains. The main background contributions affecting the ISR sample are the resonant process and the ISR and FSR processes.
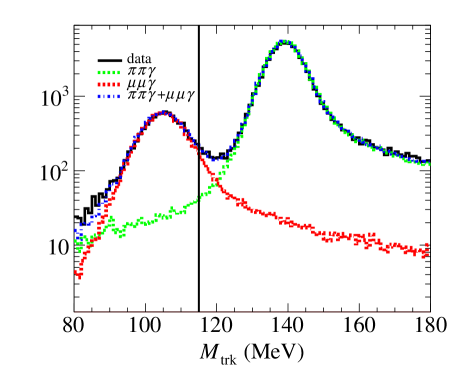
Their contributions have been evaluated by applying kinematical cuts in the , plane111 is computed from energy and momentum conservation, assuming the presence of one undetected photon and that the tracks belong to particles of the same mass: where () is the measured momentum of the positive (negative) particle, and only one of the four solutions is physical., with the invariant mass of the track pair in the pion mass hypothesis.
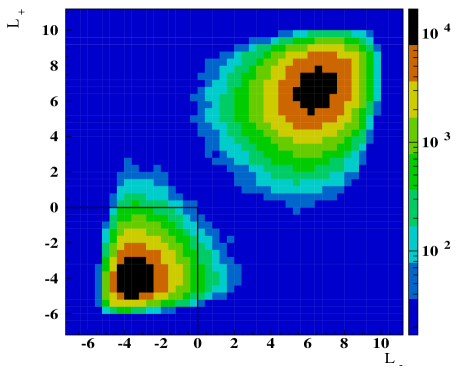
A particle identification estimator (PID), , based on a pseudo-likelihood function using the charged particles time-of-flight and energy depositions in the five calorimeter layers is used to suppress radiative Bhabha events [21, 19, 22]. Events with both tracks having are identified as events and rejected (see Figure 2).
Finally, a cut on the track-mass variable selects muons by requiring MeV as shown in Figure 1. At the end of the selection described above about 7.16 events survive.
In order to evaluate the residual background contributions, the same analysis chain was applied to simulated events for the and channels while the radiative Bhabha contribution has been evaluated directly from measured data. Distributions of the fractional residual background for each channel and their sum are shown in Figure 3 as a function of the invariant mass of the track pair in the muon mass hypothesis, .
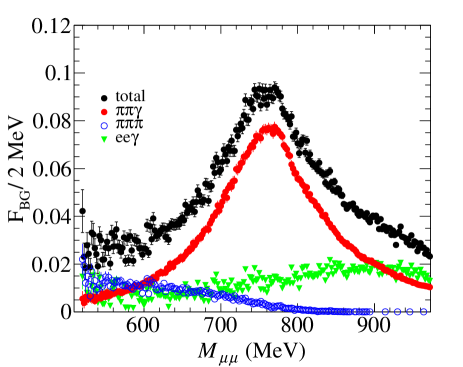
The total residual background rises up to about 9% in the region and decreases down to about 3% at low and high invariant mass values.
4 Parametrization of the irreducible background
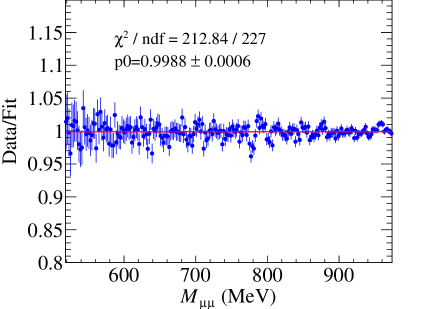
To minimize the systematic uncertainties affecting the analysis, we evaluated the irreducible background directly from the data. In Figure 4, we report the comparison between data and estimated background distributions (top panel) and their ratio (bottom panel), which are in good agreement within errors.
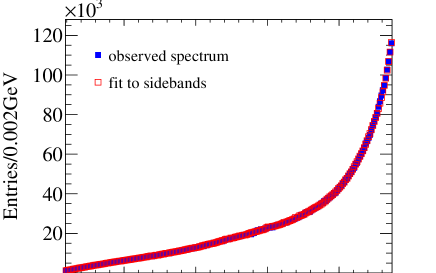
We estimated the irreducible background by using a side band fit to the observed spectrum, keeping, for each iteration, the fit with the best reduced . The fit to side bands in the whole mass range has been performed considering sub ranges wide, where is the dimuon invariant mass resolution of about 2 MeV [11]. For each U-mass hypothesis a region corresponding to is excluded from the fit. We fit the data distributions by using Chebyshev polynomials (as in Ref. [9]) up to 6th order in the mass ranges 519–757 MeV and 811–973 MeV. In the mass interval between 759 and 809 MeV, where the effect of the interference is present [23], we used another parametrization:
| (2) |
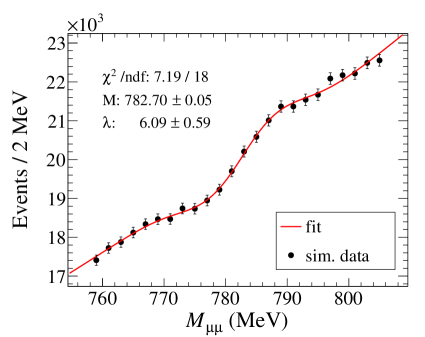
The parametrization (2) has been used because found to best fit the invariant mass simulated spectrum (PHOKHARA generator [25, 26, 27, 24] with vacuum polarisation correction included and a full description of the detector performed with the GEANFI package [28]) as shown in Figure 5. As a first step, the three coefficients of the second order polynomial pol2(x) and the parameters , and are computed by fitting the function in Eq. 2 over the full simulated spectrum: values of 782.24 MeV and 6.09 MeV were obtained for the parameters and , respectively. Then, the fits in the considered mass range (759–809 MeV) of the observed spectrum have been performed by using again the function (2), keeping the parameters and fixed at the values 782.24 MeV and 6.09 MeV, and leaving free all the other parameters.
Examples of the fits performed by using Chebyshev polynomials or the parametrization in eq. (2) are shown in Figure 6.
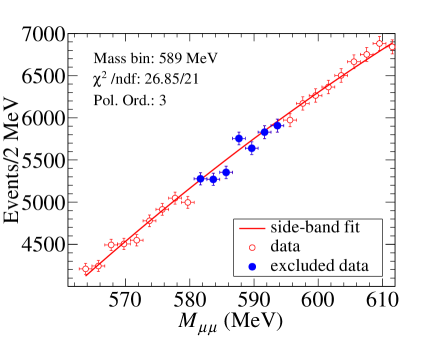
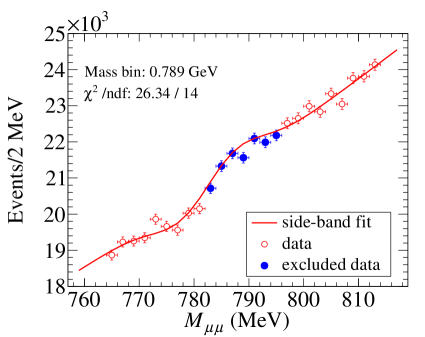
The reduced of the fit to side bands for both parameterizations remains below 2 in the whole mass range. The fit procedure is stable in the whole data range and no anomaly is observed in the fitted background.
5 Systematic uncertainties
In the following we report the systematic uncertainties affecting the analysis, mainly due to the evaluation of the irreducible background and to the event selection applied to the candidates.
5.1 Systematic uncertainties on the irreducible background
The fractional systematic error on the irreducible background is shown in Figure 7.
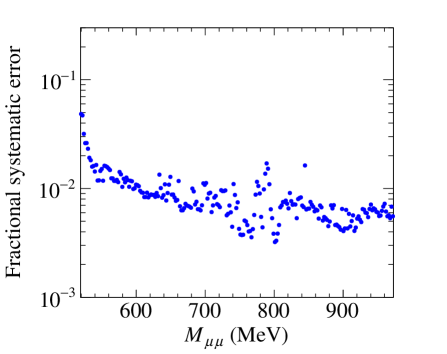
The evaluation of the systematic uncertainties has been derived for each mass bin by estimating the error of the fit. The total systematic error is less than 1% in most of the mass range.
The systematic error due to the side bands fit procedure has been also evaluated by varying the range of the fit interval of and computing the maximum difference between nominal fit and the fit derived by changing the fit interval. Its contribution is % and therefore results negligible in the whole mass range.
5.2 Systematic uncertainties of the global efficiency
Figure 8 shows the global analysis efficiency that has been evaluated from a full simulation. This efficiency includes contributions from kinematic selection, trigger, tracking, acceptance and PID-likelihood efficiencies.
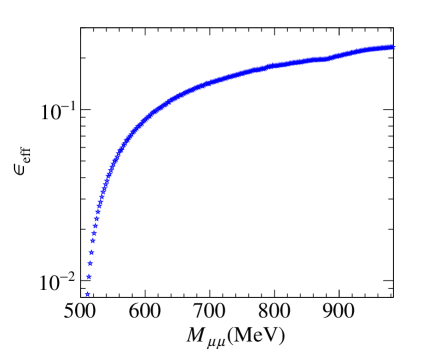
Table 1 lists all the systematic errors affecting the analysis. We evaluated the corresponding uncertainties by using the same procedures described in Ref. [9]. These systematic uncertainties do not affect the irreducible background estimation but enter in the determination of the selection efficiency and the luminosity measurement.
| Systematic source | Relative uncertainty (%) |
|---|---|
| cut | 0.4 |
| Acceptance | 0.6 – 0.1 as increases |
| Trigger | 0.1 |
| Tracking | 0.3 – 0.6 as increases |
| Generator | 0.5 |
| Luminosity | 0.3 |
| PID | negligible |
| Total | 0.98 – 0.94 as increases |
6 Limits on -boson production in events
The observed spectrum does not reveal the presence of any visible structure (see Figure 4) within the mass-dependent systematic uncertainties. For this reason, a procedure has been applied to evaluate the statistical significance of the observed data fluctuations and eventually set a limit on the process. The following subsection describes the results of the limit extraction procedure.
6.1 Upper Limit Extraction on
To extract the upper limit (UL) on we used the Confidence Level Signal (CLS) technique [29]. The procedure requires as inputs the invariant mass data spectrum, the background (the irreducible background), the -boson signal and the systematic fractional uncertainties on the background estimation for each bin. The signal has been generated with a toy MC in steps of 2 MeV for the -boson mass. At each step, a Gaussian distribution is built with a width corresponding to the invariant mass resolution of the dimuon system of about 2 MeV. The signal is then integrated over around . The number of signal events, given as input to the procedure, is initially arbitrary and very high (about ten times the square root of the estimated background value in the corresponding mass bin) and then iteratively scaled until the confidence level reaches 0.1 within 0.01. The integral of the signal corresponding to the defined level of confidence represents the limit on the number of -boson events excluded at 90% CL. Since the limit is strongly dependent on the irreducible background evaluation, the limit extraction accounts for the systematic uncertainties of the background estimate. The limit extraction procedure uses the total bin-by-bin fractional systematic uncertainty, reported in Figure 7, to perform a Gaussian smearing of the expected background given as input.
The UL on the kinetic mixing parameter has been extracted by using, for each -boson mass value, the following formula [9, 10, 11]:
| (3) |
where is the limit on the number of events, represents the global efficiency (shown in Figure 8), is the integrated luminosity (1.93 fb-1 with an uncertainty of 0.3%[18, 19]), is the radiator function calculated at QED next-to-leading-order corrections with an uncertainty of 0.5% [25, 26, 27, 30] and given by:
| (4) |
Here is the differential cross section of , is the total cross section of the process. In Eq. (3), is given by the following integral around :
| (5) |
where is the total cross section of -boson production decaying in the channel when the kinetic mixing parameter is equal to 1, . The uncertainties on , , , and , propagate to the systematic error on via eq.(3). The resulting uncertainty on is lower than 1% and has been taken into account in the estimated limit.
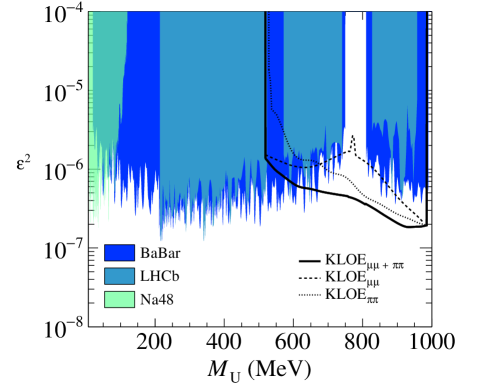
The exclusion plot on is shown as a dashed line in Figure 9 compared with the existing limits in the mass range below GeV. Our 90% CL UL ranges from to in the 519–973 MeV mass interval.
7 Combined limit on -boson production in and events
In this section we present the combination procedure of the full statistics and limits. As for the previous analyses, we use the CLS technique to estimate a 90% CL limit for the process. To extract the limit, we use the already estimated background and observed spectra for both [11] and channels in a combined way. A total systematic error on the irreducible background estimate, given by the combination of the corresponding estimated uncertainties for both -boson decay modes, is also given as input to the procedure. A combined -boson signal is generated for both decay channels taking into account the differences in global efficiency and relative branching ratio [3]. The signal inputs are generated with the same toy MC procedure performed for the limit extraction, then, each signal is integrated and normalised to the number of events estimated from Eq. (3), for a given hypothesis of the kinetic mixing parameter . The limit computation proceeds according to the following steps: it makes a hypothesis of the kinetic mixing parameter, starting from an arbitrary very low value; the corresponding number of events for and channels are generated according to Eq. (3) in order to build the signal input histogram, then, the procedure runs as before by comparing data and expected irreducible background. The search procedure ends when the estimated CLS becomes close to 0.1 within 0.01, providing directly the corresponding exclusion on .
The combined upper limit, obtained after averaging the statistical fluctuations by a smoothing procedure, excludes values of greater than in the -mass range 519–987 MeV. It is shown in Figure 9, compared to the most competitive limits. The other existing limits [34, 35, 7, 8, 9, 10, 36, 37] are not reported to make the figure more readable. The combined limit is represented by the blue area and is more stringent with respect to the already set limits in the mass region 600–987 MeV, while it is comparable to BaBar and LHCb results for masses lower than 600 MeV.
8 Conclusions
We analyzed 1.93 fb-1 of KLOE data to investigate the hypothesis of a light vector gauge boson decaying into muons and pions by means of the ISR method in the process. No -boson evidence has been found and a combined limit at 90% CL using the two -decay modes has been extracted on the kinetic mixing parameter in the energy range between 519 and 987 MeV. The new combined limit is more stringent than the already set constraints in the region between 600 and 987 MeV by excluding values of higher than .
Acknowledgments
We warmly thank our former KLOE colleagues for the access to the data collected during the KLOE data taking campaign.
We thank the DANE team for their efforts in maintaining low background running conditions and their collaboration during all data taking. We want to thank our technical staff:
G.F. Fortugno and F. Sborzacchi for their dedication in ensuring efficient operation of the KLOE computing facilities;
M. Anelli for his continuous attention to the gas system and detector safety;
A. Balla, M. Gatta, G. Corradi and G. Papalino for electronics maintenance;
C. Piscitelli for his help during major maintenance periods.
This work was supported in part
by the Polish National Science Centre through the Grants No. 2013/11/B/ST2/04245,
2014/14/E/ST2/00262,
2014/12/S/ST2/00459,
2016/21/N/ST2/01727,
2016/23/N/ST2/01293,
2017/26/M/ST2/00697.
References
- [1] C. Patrignani et al., Chin. Phys. C 40 (2016) 100001; G. Bertone, D. Hooper and J. Silk, Phys. Rept. 405 (2005) 279, [arXiv:hep-ph/0404175]; G. Bertone, “Particle Dark Matter: Observations, Models and Searches”, Cambridge University Press (2010); J. Alexander et al., arXiv:1608.08632.
- [2] B. Holdom, Phys. Lett. B 166 (1985) 196; C. Boehm, P. Fayet, Nucl. Phys. B 683 (2004) 219; P. Fayet, Phys. Rev. D 75 (2007) 115017; Y. Mambrini, J. Cosmol. Astropart. Phys. 1009 (2010) 022; M. Pospelov, A. Ritz, M.B. Voloshin, Phys. Lett. B 662 (2008) 53;
- [3] R. Essig, P. Schuster, N. Toro, Phys. Rev. 80 (2009) 015003; B. Batell, M. Pospelov, A. Ritz, Phys. Rev. D 79 (2009) 115008; M. Reece and L.T. Wang, JHEP 07 (2009) 051.
- [4] O. Adriani et al., Nature 458 (2009) 607; P. Jean et al., Astronomy Astrophysics 407 (2003) L55; J. Chang et al., Nature 456 (2008) 362; F. Aharonian et al., Phys. Rev. Lett. 101 (2008) 261104; A. A. Abdo et al., Phys. Rev. Lett. 102 (2009) 181101; R. Bernabei et al., Eur. Phys. J. C 56 (2008) 333; M. Aguilar et al., Phys. Rev. Lett. 110 (2013) 141102.
- [5] L. Barzè et al., Eur. Phys. J. C 71 (2011) 1680.
- [6] A. Anastasi et al., Phys. Lett. B 747 (2015) 365.
- [7] F. Archilli et al., Phys. Lett. B 706 (2012) 251.
- [8] D. Babusci et al., Phys. Lett. B 720 (2013) 111.
- [9] D. Babusci et al., Phys. Lett. B 736 (2014) 459.
- [10] A. Anastasi et al., Phys. Lett. B 750 (2015) 633.
- [11] A. Anastasi et al., Phys. Lett. B 757 (2016) 356.
- [12] M. Pospelov, Phys. Rev. D 80 (2009) 095002.
- [13] A. Gallo et al., DAFNE status report, Conf. Proc. C060626 (2006) 604–606.
- [14] M. Adinolfi et al., Nucl. Instrum. Meth. A 488 (2002) 51.
- [15] M. Adinolfi et al., Nucl. Instrum. Meth. A 482 (2002) 364.
- [16] M. Adinolfi,et al., Nucl. Instrum. Meth. A 492 (2002) 134.
- [17] S. Binner, J.H. Kuehn, K. Melnikov, Phys. Lett. B 459 (1999) 279.
- [18] A. Aloisio et al., Phys.Lett. B 606 (2005) 12.
- [19] F. Ambrosino et al., Phys. Lett. B 670 (2009) 285.
- [20] D. Babusci et al., Phys. Lett. B 720 (2013) 336.
- [21] D. Babusci et al., Phys. Lett. B 720 (2009) 336.
- [22] F. Ambrosino et al., Phys. Lett. B 700 (2011) 102.
- [23] A. Anastasi et al., Phys. Lett. B 767 (2017) 485.
- [24] H. Czyż , A. Grzelinska, J.H. Kühn, G. Rodrigo, Eur. Phys. J. C 39 (2005) 411.
- [25] G. Rodrigo, H. Czyż , J.H. Kühn, M. Szopa, Eur. Phys. J. C 24 (2002) 71.
- [26] H. Czyż , A. Grzelinska, J.H. Kühn, G. Rodrigo, Eur. Phys. J. C 27 (2003) 563.
- [27] H. Czyż , A. Grzelinska, J.H. Kühn, G. Rodrigo, Eur. Phys. J. C 33 (2004) 333.
- [28] F. Ambrosino et al., Nucl. Instrum. Meth. A 534 (2004) 403.
- [29] G. C. Feldman, R. D. Cousins, Phis. Rev. D 57 (1998) 3873.
- [30] S. Actis et al., Eur. Phys. J. C 66 (2010) 585.
- [31] J. P. Lees et al., Phys. Rev. Lett. 113 (2014) 201801.
- [32] J.R. Batley et al., Phys. Lett. B 746 (2015) 178.
- [33] R. Aaij et al. Phys. Rev. Lett. 120 (2018) 061801.
- [34] H. Merkel, et al., Phys. Rev. Lett. 112 (2014) 221802.
- [35] S. Abrahamyan et al., Phys. Rev. Lett. 107 (2011) 191804.
- [36] P. Adlarson et al., Phys. Lett. B 726 (2013) 187 .
- [37] G. Agakishiev et al., Phys. Lett. B 731 (2014) 265.