Multi-wavelength observations of a new redback millisecond pulsar candidate: 3FGL J0954.83948
Abstract
We present a multi-wavelength study of the unassociated Fermi-LAT source, 3FGL J0954.83948, which is likely the -ray counterpart of a 9.3-hour binary in the field. With more than 9 years of Pass 8 LAT data, we updated the -ray spectral properties and the LAT localization of the -ray source.
While the binary lies outside the cataloged 95% error ellipse, the optimized LAT ellipse is 0.1 degrees closer and encloses the binary.
The system is likely spectrally hard in X-rays (photon index ) with orbital modulations detected in optical, UV, and possibly X-rays. A steep spectrum radio counterpart (spectral index ) is also found in the TIFR GMRT Sky Survey (TGSS), implying that it is a pulsar system. We obtained a series of SOAR and Gemini spectroscopic observations in 2017/2018, which show a low-mass secondary orbiting in a close circular orbit with km s-1 under strong irradiation by the primary compact object. All the observations as well as the modelling of the X/-ray high-energy emission suggest that 3FGL J0954.83948 is a redback millisecond pulsar in a rotation-powered state.
Subject headings:
binaries: close — gamma rays: stars — pulsars: general — X-rays: binaries1. Introduction
Redback and black widow millisecond pulsars (MSPs) are unique subclasses of pulsar binaries, which have compact orbits (periods of 1 days) and very low-mass companions ( 0.1 – 0.4 for redback and for black widow; Roberts 2013; Chen et al. 2013). With separations of just a few or less, the primary pulsars are heavily ablating the secondary stars with high-power radiation and pulsar winds, potentially explaining how isolated MSPs are formed (van den Heuvel & van Paradijs 1988). They became even more interesting recently as three redback MSPs (also known as transitional MSPs), M28I (Papitto et al. 2013), PSR J1023+0038 (Archibald et al. 2009; Patruno et al. 2014; Stappers et al. 2014), and PSR J12274853 (Roy et al. 2015), have shown remarkable transitions between the low-mass X-ray binary (LMXB) state and the radio pulsar state, which could be an important piece of evidence for the recycling explanation for MSP formation (Alpar et al. 1982).
In the Fermi Large Area Telescope (LAT) third source catalog (3FGL; Acero et al. 2015), over 1000 -ray sources are without definitive associations at other wavelengths. On the basis of previous work (e.g., Abdo et al. 2013), some of these unassociated Fermi-LAT sources are likely to be redback and black widow MSPs. In fact, recent coordinated multi-wavelength searches have identified at least nine unassociated Fermi-LAT sources as promising redback/black widow candidates, including111The list does not include 2FGL J0846.0+2820 (Swihart et al. 2017) and 1FGL J1417.74407 (Strader et al. 2015), which have giant secondaries with orbital periods of 8.1 days and 5.4 days, respectively. The latter was confirmed as a MSP (PSR J14174402; Camilo et al. 2016) : 3FGL J0838.82829 (Halpern et al. 2017), 3FGL J0212.1+5320 (Li et al. 2016; Linares et al. 2017), 3FGL J0427.96704 (Strader et al. 2016), 3FGL J2039.65618 (Romani 2015; Salvetti et al. 2015), 3FGL J1544.61125 (Bogdanov & Halpern 2015), 2FGL J1653.60159 (Romani et al. 2014; Kong et al. 2014), 1FGL J0523.52529 (Strader et al. 2014), 2FGL J1311.73429 (Romani 2012; Kataoka et al. 2012), 1FGL J2339.70531 (Romani & Shaw 2011; Kong et al. 2012), at least two of which, PSR J1311-3430 (Pletsch et al. 2012) and PSR J2339-0533 (Pletsch & Clark 2015), have been confirmed as MSPs. It is also worth mentioning that 3FGL J0427.96704 and 3FGL J1544.61125 are -ray emitting low-mass X-ray binaries that are good candidates for transitional MSPs.
3FGL J0954.83948 is a bright unassociated Fermi-LAT source in 3FGL, detected in 0.1–100 GeV with a detection significance of (Acero et al. 2015). It first appeared in the Fermi-LAT first source catalog (1FGL; Abdo et al. 2010), and subsequently in the Fermi-LAT second source catalog (2FGL; Nolan et al. 2012). The -ray source resembles other -ray pulsars with low source variability (its chi-squared variability index of 51 with 47 degrees of freedom is consistent with a steady source) and a significantly curved -ray spectrum (Abdo et al. 2013). Both features suggest that 3FGL J0954.83948 could be a -ray pulsar. Indeed, Saz Parkinson et al. (2016) found that 3FGL J0954.83948 is a strong MSP candidate using statistical and machine learning techniques. Drake et al. (2017) suggested a binary with an orbital period of 9.3 hours, named SSS J095527.8394752, to be a promising counterpart to 1FGL J0955.23949. In addition, a bright radio counterpart possibly associated with the binary was independently discovered by Frail et al. (2016). However, these counterparts are later found to be outside the 3FGL error ellipse, and the association therefore remains questionable until now.
In this paper, we present multi-wavelength observations of 3FGL J0954.83948, with which we show that SSS J095527.8394752 is still likely to be the counterpart of the -ray source. Furthermore, the observed timing and spectral properties are in agreement with the suggestion of Drake et al. (2017) that 3FGL J0954.83948 is a new member of the group of redback MSPs.
2. Fermi-LAT gamma-ray analysis
| \topruleModel | 3FGL Position | Re-localization (1–100 GeV) | Best-fit Parameters (0.1–100 GeV) | ||||||||
| TS | R.A.a | Dec.a | 95% radius | TS | |||||||
| (degree) | (degree) | (degree) | (GeV) | ( cm-2 s-1) | |||||||
| PLExpCutoff | 125311.76 | 309 | 125289.08 | 355 | |||||||
| LogParabola | 125312.25 | 309 | 125289.84 | 353 | |||||||
| aThe coordinates are in the J2000 frame. | |||||||||||
Before searching for the X-ray/optical counterparts, we first re-localized 3FGL J0954.83948 in -rays taking advantage of the Pass 8 LAT data (Atwood et al. 2013) with a timespan of more than 9 years, whose performance has been much improved over the 4 years of Pass 7 data used in 3FGL. This would in principle yield a more precise -ray position with a more restricted error circle.
The LAT events and the spacecraft data were downloaded from the Fermi Science Support Center (FSSC).222http://fermi.gsfc.nasa.gov/ssc/ The dataset covers the time range of 4 Aug 2008 – 16 Dec 2017 with reconstructed energy in 0.1–100 GeV. We selected SOURCE class events (Front and Back) but excluded those with a zenith angle larger than or a rocking angle larger than to avoid the Earth limb contamination. The region of interest (ROI) was centered at , which is the 3FGL position of 3FGL J0954.83948. All the 3FGL sources located within a radius circle at the center were included to build a spatial and spectral model for the -ray emission in the field. The model also includes the latest Galactic interstellar emission model (gll_iem_v06.fits) and the isotropic emission spectrum (iso_P8R2_SOURCE_V6_v06.txt), of which the latter takes the extragalactic emission and the residual instrumental background into account (Acero et al. 2016).
With the latest instrument response function P8R2_SOURCE_V6, model fitting was performed by the maximum likelihood method (Mattox et al. 1996), which is integrated in the Fermi Science Tools available at FSSC. In addition, the package333http://fermipy.readthedocs.io/en/latest/index.html developed within the LAT collaboration was used to facilitate the analysis (Wood et al. 2017). Under the framework, the significance of a certain source is characterized by Test Statistic (TS),
where and are the logarithms of the maximum likelihood of the complete source model and of the null hypothesis model (i.e., the source model without the certain source), respectively.
The localization fit was performed at GeV to benefit from the improved angular resolution and the reduced background contamination. We first performed an initial fit with a ROI, by allowing the background diffuse components as well as all the sources located from 3FGL J0954.83948 to vary. Given the evidence for spectral curvature of 3FGL J0954.83948 in 3FGL, we employed two curved spectral models for it,
where serves as the photon index for both models, characterizes the cutoff energy for PLExpCutoff, defines the degree of curvature for LogParabola, and is a fixed scale parameter. Both models give good fits to the data and PLExpCutoff is slightly preferred over LogParabola by . Three parameter-fixed -ray sources located outside the region, 3FGL J0928.93530, 3FGL J0937.14544c and 3FGL J1007.43334 were not well modelled in the first round and a second iteration was done with their normalization parameters freed.
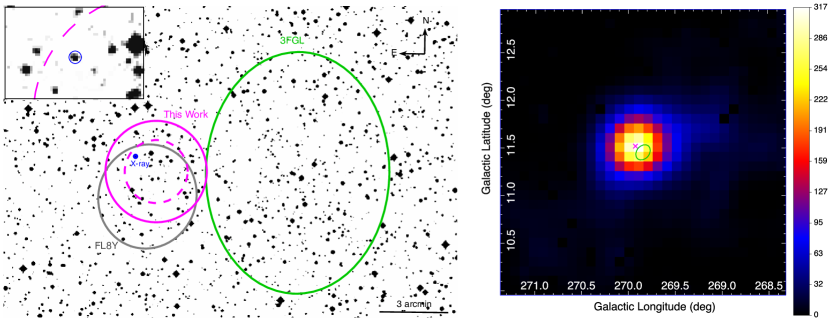
Taking the best-fit source model from the aforementioned processes as the input, we re-localized 3FGL J0954.83948 using the “Source localization” function in for both LogParabola and PLExpCutoff models. The spectral parameters of all the sources, except the Galactic/Isotropic diffuse components and 3FGL J0954.83948, were fixed during the localization, although we found that freeing the normalizations of the background diffuse components has no significant effect on the localization result. Table 1 summarizes the best localization parameters of 3FGL J0954.83948 for PLExpCutoff and LogParabola. There is no obvious difference between the localizations from LogParabola and PLExpCutoff, but the PLExpCutoff version is slightly favoured given the smaller of the best-fit. Figure 1 shows the new -ray localization of 3FGL J0954.83948 (PLExpCutoff) on the DSS1 image and the TS map of the field. Compared with the 95% error ellipse of 3FGL J0954.83948 presented in 3FGL (i.e., 53 and 40 for the semi-major and semi-minor axes, respectively), the updated LAT position is shifted by 62 to with a much improved 95% error radius of 22 (Figure 1). Using this best-fit position, broadband spectral fitting in the energy range of 0.1–100 GeV was also performed for both PLExpCutoff and LogParabola, and the best-fit parameters are listed in Table 1.
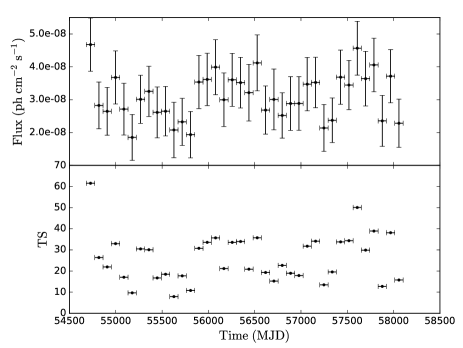
High long-term -ray flux variability is a common feature of transitional MSPs. To examine this possibility for 3FGL J0954.83948, we computed a long-term light curve with 90-day binning in the energy range of GeV (Figure 2). For each time bin, the flux was calculated independently using the likelihood analysis. In the source model used, the spectral shapes of all sources (including 3FGL J0954.83948) located within from 3FGL J0954.83948 were fixed according to their best-fit models determined previously (i.e., only normalizations were allowed to vary). Upper limits at 95% confidence level were calculated when 3FGL J0954.83948 had TS . In addition, we followed the method presented in Acero et al. (2015) to obtain the variability significance of 3FGL J0954.83948, which is just (for 37 degrees of freedom). The -ray emission is thus considered to be stable on a time scale of a few months, ruling out the possibility of 3FGL J0954.83948 being a transitional MSP within the LAT mission.
3. Neil Gehrels Swift Observations
Swift has observed the field of 3FGL J0954.83948 10 times between March 2010 and March 2017. Five of the observations taken in 2015 are with short exposure times less than 400 sec while the other five have relatively long exposures (Table 2). In the stacked XRT image, only one X-ray source at , (90% positional uncertainty: 35) is detected within the new 95% LAT error circle (Figure 1). The X-ray source is listed as 1SXPS J095527.8394750 in the Swift-XRT point source catalog (1SXPS; Evans et al. 2014), in which only part of the observations was analysed. We therefore re-analysed the source with all ten observations to improve the spectral fitting as well as the long-term X-ray light curve of the source. As the field is not crowded and no other bright X-ray source is found around the target, we simply used the Swift/XRT on-line tools444http://www.swift.ac.uk/user_objects/ provided by the Swift team (Evans et al. 2007, 2009) to perform the following XRT analyses.
While 1SXPS J095527.8394750 is significantly detected, the low photon statistics only allow a basic spectral analysis (i.e., only 32 photons collected within a 20″ radius circular region). To deal with the low-count spectrum, we used XSPEC (version 12.9.1m) with W-statistic (a modified version of C-statistic; Cash 1979) in the fitting process. In addition, we binned the spectrum accordingly so that every bin contains at least one source count as the development team suggested. A simple absorbed power-law is assumed and the best-fit parameters are cm-2, , and erg cm-2 s-1 (absorption corrected; all the uncertainties listed are in 90% confidence interval). Although it is not significant, the best-fit is a few times higher than the Galactic value of cm-2 (Kalberla et al. 2005), may indicating an intrinsic absorption of the system. If a value closer to the Galactic value is used, e.g., cm-2, the best-fit parameters change to and erg cm-2 s-1. We also tried the thermal model mekal, which requires an unreasonably high temperature of keV to describe the spectrum. Given the poor data quality of the spectrum, we did not try any complex models with two or multiple emission components.
| \topruleSwift ObsID | Date | BJD | XRT Exposure | XRT Count Ratea | UVOT Filter | Magnitudea |
| (start time) | (seconds) | ( cts s-1) | (Vega) | |||
| 00031664001 | 2010 Mar 24 | 2455279.5230275 | 3557 | UVW1 | ||
| 00084699001 | 2015 Feb 04 | 2457057.7715524 | 238 | UVW2 | ||
| 00084699002 | 2015 Feb 16 | 2457070.4008172 | 145 | UVW2 | ||
| 00084699003 | 2015 Jun 21 | 2457195.0878701 | 186 | UVM2 | ||
| 00084699004 | 2015 Aug 07 | 2457242.3099548 | 278 | UVW2 | ||
| 00084699005 | 2015 Aug 12 | 2457247.3567788 | 356 | UVM2 | ||
| 00084699006 | 2015 Aug 19 | 2457254.1462335 | 1578 | UVW2 | ||
| 00084699007 | 2015 Aug 24 | 2457258.9278091 | 1091 | UVM2 | ||
| 00034854001 | 2016 Dec 22 | 2457744.5423559 | 1785 | U | ||
| 00034854002 | 2017 Mar 09 | 2457821.8875329 | 2008 | UVW2 | ||
| aThe upper limits listed are in 95% confidence level. | ||||||
| bThe source is detected in the stacked Swift/XRT image with cts s-1. | ||||||
Five XRT observations got only low exposure (i.e., much less than 1 ksec) and the X-ray source was therefore undetected in these datasets. Surprisingly, we also found that the source was undetected in a “deep” observation taken on 2015 August 19 with an exposure time of about 1.6 ksec (Table 2). Within a 47″ radius circular region centered at the source position (corresponding to 90% of the encircled energy fraction of XRT at 1.5 keV; Moretti et al. 2005), only one photon (which is located near the edge of the region) was detected in this 1.6 ksec observation. Even assuming that this only event is from the source, the inferred count rate is much lower than the measurements in 2010 and 2015–2017—for example, seven source counts would have been detected in a 1.6 ksec observation with the count rate of cts s-1 measured five days later (Table 2). Using a Bayesian approach (Kraft et al. 1991), we computed 95% upper limits for all the non-detections. As expected, the upper limits for data with ksec are not very much constraining (i.e., a few cts s-1, while the average count rate of the four individual detections is about cts s-1). The upper limit for the 1.6 ksec data is deeper (i.e., cts s-1), however, still insufficient to clarify whether the low-count-rate measurement is physically- or statistically-based. For a deeper constraint, we combined all the six XRT observations and the X-ray source can be marginally detected in the stacked image with cts s-1. Although this marginal detection shows a % decrease on flux in the period from 2015 February 04 through August 19, the variability is not statistically significant (i.e., less than 2). To check whether this variability was seen at other frequencies, we performed a Fermi-LAT analysis with the data collected between 2015 February 04 and August 19, and the -ray flux (100 MeV–100 GeV) did not vary significantly. In UV, there are some UVOT images taken simultaneously with the XRT observations. Although the UVOT magnitudes (obtained by aperture photometry using the uvotsource task in HEAsoft v6.22) were significantly changing over time (Table 2), it is due to the orbital modulation (Figure 3; will be discussed in the coming sections).
4. Catalina Surveys Data
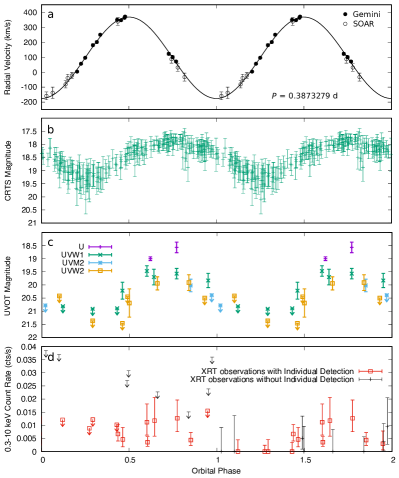
In the CSS Periodic Variable Star Catalogue, Drake et al. (2017) identified a mag candidate optical counterpart for the X-ray system, SSS J095527.8394752 (the accurate Gaia position in the Data Release 2: mas, mas; Gaia Collaboration et al. 2016, 2018), which is the only optical source located within the 90% positional uncertainty of 1SXPS J095527.8394750. The source was classified as a non-EA (Algol type) eclipsing binary with d (about 9.3 hours). The photometric data (186 individual exposures) obtained from the Catalina Surveys Data Release 2 (CSDR2; Drake et al. 2009)555All the CSS data was taken unfiltered. shows a clear sinusoidal-like profile at 9.3 hours (Figure 3; the light curve has been barycentric corrected to the TDB system; Eastman et al. 2010). We fit the data with a sinusoidal function and the best-fit mean magnitude is mag with a peak-to-peak amplitude of mag. For the XRT variability discussed in §3, no further investigation is allowed on the CSS optical light curve as it does not cover the time of interest.
5. SOAR and Gemini South Spectroscopy
We obtained optical spectroscopy of the source using the Goodman Spectrograph (Clemens et al. 2004) on the SOAR telescope (UT 2017 Jul 11 to 2018 Jan 22) and using GMOS-S on the Gemini South telescope (2017 Dec 8 to 19). The SOAR spectra all used a 400 l mm-1 grating with a 095 slit, giving a FWHM resolution of about 5.3 Å. Most of the SOAR spectra covered a wavelength range of about 4850 to 8850 Å, but the last two had redder coverage, from 5950 to 9950 Å. These nine individual spectra all had exposure times of 1200 sec. The Gemini spectra used the R400 grating, centered around 6800 Å, with a 10 slit. All the exposures were 600 sec. Fifteen spectra were obtained with Gemini; two of these Gemini spectra had signal-to-noise too low to be useful, but the remaining thirteen spectra were good. Both the SOAR and Gemini spectra were reduced and optimally extracted in the usual manner.
The immediate impression upon viewing the spectra is that the effective temperature of the star varies substantially over its orbit, and is quite warm when the “day” side of the star is facing Earth, suggesting the presence of heating. Comparing to the Paschen series of stars from the Ca triplet library of Cenarro et al. (2001), the Gemini spectra around are of mid-A type, with effective temperatures around K. The Paschen series entirely disappears by the “night” phase of , where the relative strength of the metal to hydrogen lines are consistent with an early to mid G-type spectrum, with estimated temperatures of K. The spectra show no evidence of emission lines at any phase.

We determined barycentric radial velocities by cross-correlating the individual spectra with templates appropriate to their specific spectral types, primarily in the region of the Ca triplet and the Paschen series. These 22 velocities are listed as barycentric dynamical times on the TDB system (Eastman et al. 2010) in Table 3.
We fit a circular Keplerian model to these radial velocities using the custom Markov Chain Monte Carlo sampler The Joker (Price-Whelan et al. 2017). The posterior distributions are approximately normal and uncorrelated. We summarize these with medians and equivalent quantiles: period d, semi-amplitude km s-1, systemic velocity km s-1, and time of ascending node for the compact object d. A fit with these median values has /d.o.f. = 17.7/18, suggesting a reasonable fit. The orbital period is consistent with the CSS value (§4). Dropping the assumption of a circular orbit does not significantly improve the fit.
Assuming that the orbital period derivative over the period between the CSS and the SOAR/Gemini epochs is negligible (i.e., a stable period), we further constrain the orbital period by performing a joint fitting of the CSS photometric data and the radial velocities with a sinusoidal function and a cosinusoidal function (with the same period and parameters shared), respectively. The best-fit orbital period is d with d (/d.o.f. = 134.9/202). This more precise orbital solution was used in the UVOT and XRT timing analyses discussed in §3 and §7.2, respectively (Figure 3). In addition, we tried fitting the data by allowing a “phase shift” between the CSS photometric light curve and the radial velocity curve, which is possible when the heating pattern is asymmetric. This gives d with d and (i.e., the photometric peak at ; /d.o.f. = 125.6/201).
| \topruleBJD | Radial Vel. | Unc. | Source |
|---|---|---|---|
| (d) | (km s-1) | (km s-1) | |
| 2457945.5057483 | 338.1 | 20.2 | SOAR |
| 2457956.4698649 | 86.6 | 21.3 | SOAR |
| 2457956.4838969 | 31.4 | 20.1 | SOAR |
| 2457956.4988242 | -32.9 | 22.1 | SOAR |
| 2458072.7785401 | -158.3 | 21.7 | SOAR |
| 2458072.7925358 | -137.4 | 34.5 | SOAR |
| 2458072.8257413 | -39.0 | 20.2 | SOAR |
| 2458095.7339401 | 180.2 | 8.5 | Gemini |
| 2458095.7425900 | 200.8 | 8.2 | Gemini |
| 2458095.7501254 | 249.8 | 7.6 | Gemini |
| 2458097.7417328 | 371.2 | 7.8 | Gemini |
| 2458102.7595228 | 349.6 | 7.1 | Gemini |
| 2458102.7681525 | 346.9 | 7.1 | Gemini |
| 2458102.7756881 | 362.7 | 7.4 | Gemini |
| 2458103.8328295 | 3.6 | 6.7 | Gemini |
| 2458103.8414655 | 56.2 | 6.8 | Gemini |
| 2458103.8507936 | 96.0 | 7.0 | Gemini |
| 2458106.7470583 | 122.3 | 9.8 | Gemini |
| 2458106.7557001 | 100.0 | 9.7 | Gemini |
| 2458106.7632348 | 71.0 | 8.9 | Gemini |
| 2458140.6035185 | -81.1 | 23.9 | SOAR |
| 2458140.6175631 | -22.2 | 20.1 | SOAR |
6. Radio Measurements in the Literature
Using the Giant Metrewave Radio Telescope (GMRT) 150 MHz All-Sky Radio Survey (TGSS ADR; Intema et al. 2017), Frail et al. (2016, 2018) identified radio pulsar candidates associated with unidentified Fermi-LAT sources in 2FGL, 3FGL, and the preliminary 8-year source catalog666https://fermi.gsfc.nasa.gov/ssc/data/access/lat/fl8y/ (FL8Y). Three candidates were found within 2FGL sources, and one of these is associated with 3FGL J0954.83948. However, as the radio source is outside the 3FGL source’s 95% error ellipse, no detailed investigation was done.
The 3FGL J0954.83948-associated pulsar candidate is located at , (1 uncertainty; ), which is roughly consistent with the Gaia optical position of SSS J095527.8394752 (the offset: 29). This radio counterpart is a bright point source with 77 mJy at 150 MHz, but was cataloged neither in the Sydney University Molonglo Sky Survey (SUMSS at 843 MHz; Mauch et al. 2003) nor the NRAO VLA Sky Survey (NVSS at 1.4 GHz; Condon et al. 1998), indicating that it has a steep radio spectrum. Frail et al. (2016) estimated the spectral index to be (where the flux density ), although it is highly uncertain given the poor flux constraints by SUMSS and NVSS. Nevertheless, this spectral index is fully consistent with that of a typical pulsar: , the weighted mean spectral index of the 441 pulsars recently studied in Jankowski et al. (2018), for instance.
3FGL J0954.83948 is also one of the 56 targets in the Parkes radio MSP survey (Camilo et al. 2015). Unfortunately, no radio pulsation was found in a blind search with five 60-minute observations at 1.4 GHz. However, the offset between the optimized position of the radio search and the radio counterpart is as large as 5′, which is comparable to the Parkes beam of (half-width at half-maximum; Camilo et al. 2015). This offset could have reduced the sensitivity of the search. Additionally, the radio pulsations could be eclipsed by the materials from the ablating companions during (some of) the observations. New search observations should be made at the updated position.
7. Discussion
In various aspects from radio through GeV -rays, we have shown that 3FGL J0954.83948 is well consistent with a redback MSP binary:
-
•
The system exhibited a clear orbital modulation in optical with a compact orbit of hours and km s-1, which is common among the known redback systems.
-
•
The X-ray counterpart has a hard spectral index (i.e., ) comparable to other redbacks, though the spectral index is uncertain, and deeper X-ray observations are needed.
-
•
The -ray flux is mostly stable on a monthly time scale and a significant curvature is found in the LAT spectrum. Both are signature features observed in many LAT-detected pulsars.
-
•
It has a pulsar-like radio counterpart with a steep spectral index of .
These strongly suggest that the -ray source is a new redback MSP binary. We also comment that 3FGL J0954.83948 is unlikely to be a black widow MSP, since the source needs to be very nearby (i.e., pc) to make the G-type secondary small in size (i.e., ). At this small distance, the X-ray and -ray luminosities would be as low as as erg s-1 and erg s-1, which are far too low to produce the huge “day” and “night” temperature difference seen in the Gemini spectra (i.e., erg s-1 is required; will be discussed in §7.3). In addition, this close distance also contradicts the parallax of 3FGL J0954.83948 measured by Gaia (see §7.1). In contrast, a redback MSP scenario can provide a self-consistent picture for the multi-wavelength observations.
7.1. Basic Properties of the Binary
The observed kinematics of the secondary yield the mass function for gravitational constant , inclination angle , and mass ratio . For SSS J095527.8394752, we find . Assuming that the primary is a neutron star with a maximum mass of , then the observed mass function implies (for , ). Given that most redbacks have secondaries with masses of at least , the most likely range of the inclinations is somewhat more restricted, () to (). Under these circumstances, the separation between the two binary members can be well restricted to – cm (equivalent to 2.6 – 2.7 ) for – .
Although not exclusively, normal redback systems often have luminosities of erg s-1 (see, e.g., Linares 2014), putting a weak constraint of kpc on the distance for the redback MSP candidate. Another constraint comes from the parallax information from the second Gaia data release (GDR2; Gaia Collaboration et al. 2016, 2018), mas (corrected for the global zero point of mas; Lindegren et al. 2018)777In GDR2, all parallaxes are computed by assuming that the sources are single stars. This could cause additional systematic uncertainties for binary systems., which can be converted to a geometric distance of kpc (probability contained: 68%; Bailer-Jones et al. 2018; Luri et al. 2018). Although these constraints are not totally consistent with each other, they both roughly agree kpc. Assuming kpc, the mag G-type companion would have a radius of 888 mag was inferred from the best-fit magnitude at night presented in §4 (without irradiation of the pulsar). An extinction correction with the best-fit of cm-2 obtained from X-ray spectral fitting (Güver & Özel 2009) has been applied. If cm-2 is assumed, the magnitude will increase to 18.6 mag (fainter) with a smaller inferred companion size of .. This stellar size is indeed in line with the fact that no obvious ellipsoidal variation is seen in the CSS light curve (average error: 0.3 mag), given that only weak ellipsoidal variability can be created by a secondary for 3FGL J0954.83948 (e.g., peak-to-peak amplitude mag for and , computed with the ELC code; Orosz & Hauschildt 2000).
7.2. X-Ray Orbital Modulation?
To look for the X-ray modulation, we made an XRT light curve folded on the orbital period of d (Figure 3). As we have mentioned in §3, the X-ray counterpart was not detected in every Swift/XRT observation. For better visualization, we plotted the bins with different colors based on whether the source was detected in a single full observation (detected: red; undetected: black). For all non-detection data bins, we present Bayesian bins (i.e., net count rates handled by a Bayesian approach, even for bins with zero net count rate; Kraft et al. 1991) in addition to 95% upper limits to scratch the possible orbital modulation in X-rays (Figure 3d).
While the black dataset does not show evidence for a modulation, the red one is likely orbitally modulated with stronger X-ray emission seen in phase 0.6–0.8 (Figure 3d). This tentative X-ray peak seemingly aligns with the optical/UV peak at phase 0.75, which is the superior conjunction of the pulsar binary. Interestingly, X-ray modulation peaks around the superior conjunctions were commonly observed in redbacks, e.g., PSR J21290429 (Hui et al. 2015) and PSR J17232837 (Kong et al. 2017).
The poor data quality could be the reason to explain why the modulation was unseen in the black dataset (see §3). Alternatively, it may imply a slightly unstable orbital modulation of the binary. In fact, it has been shown in PSR J17232837 that the X-ray orbital modulation of redback MSP binaries can change slightly from orbit to orbit due to, e.g., the wind instability of the companion (see Figure 1 in Kong et al. 2017). Further X-ray observations would remove the ambiguity.
7.2.1 No Sign of Gamma-Ray Orbital Modulation
We also searched for possible -ray orbital modulation at MeV by folding the -ray photons accordingly. Different aperture radii from to were tried, but no evidence for an orbital modulation was found.
7.3. Interpretation for the High-Energy Emission
Spin-down power is the major energy source for rotation-powered pulsars. Although the pulsations as well as the spin-down rate of 3FGL J0954.83948 have not been detected yet, we can still infer the spin-down power by measuring the pulsar irradiation on the companion, if the spin-down power and the irradiation power are approximately the same. With the assumptions that the radiation/pulsar wind from the pulsar are both isotropic and the irradiated hemisphere of the companion is uniformly heated, the spin-down power of 3FGL J0954.83948 can be estimated from
| (1) |
where is the heating efficiency, is the Stefan-Boltzmann constant, K and K are the “day” and “night” temperatures, respectively, and is the fraction of the sky covered by the companion star seen from the pulsar, which can be written as for cm (corresponding to ). The inferred spin-down power is , a very typical value for MSPs.
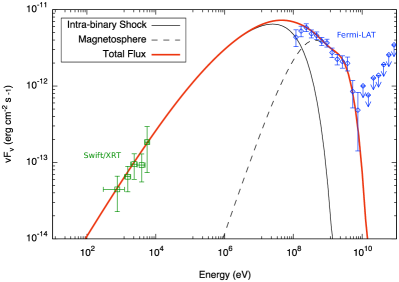
Presumably, the X-ray and GeV -ray emission of 3FGL J0954.83948 originates from the intra-binary shock and the pulsar magnetosphere (Takata et al. 2014; Li et al. 2014; An et al. 2017), if it is a redback MSP, i.e., the shock-accelerated electrons and positrons emit X-ray/soft -rays via synchrotron radiation, and even TeV photons via inverse-Compton scattering off the stellar photons.
The outer gap emission from the pulsar magnetosphere (Cheng et al. 1986) will contribute significantly in the LAT energy domain, especially above 1 GeV. We computed the outer gap spectrum using the emission model developed by Wang et al. (2010) with the spin-down power of
| (2) |
which gives the strength of the surface dipole field G for a spin period of ms and erg s-1 ( assumed). The magnetospheric emission from the outer gap is highly related to the gap fraction, i.e., , where the gap fraction is defined by the ratio of the gap thickness to the light cylinder radius at the light cylinder. For MSPs, the gap fraction is empirically found to be , as the LAT -ray luminosities are often % of the spin-down powers (Abdo et al. 2013). In the model calculation for 3FGL J0954.83948, we assumed a gap fraction of to explain the observed luminosity with kpc. As long as we fix the spin-down luminosity and the gap fraction, the predicted -ray luminosity is not sensitive to the spin period.
For the intra-binary shock contribution, we first roughly estimate the ratio of the momenta of the stellar wind and the pulsar wind () from the X-ray light curve. It has been suggested that the X-ray orbital modulation of redback systems is caused by the Doppler boosting of the post-shocked wind (e.g., PSRs J1023+0038 and J21290429; Li et al. 2014; Kong et al. 2018). If the X-ray modulation of 3FGL J0954.83948 is genuine, then the shock cone has to be wrapping the pulsar, such that the X-ray emission can be Doppler boosted to create an X-ray flux maximum when the companion is behind the pulsar (phase = 0.75 in Figure 3). In this case, the stellar wind should have a larger momentum than the pulsar wind. We therefore assumed , which was also used to explain the X/-ray properties of the redback MSP J1023+0038 (Li et al. 2014). The shock geometry with is calculated with the method discussed by Canto et al. (1996), with the magnetic field strength at the shock parametrized by the magnetization . Besides the shock geometry, this magnetization parameter also controls the X/-ray luminosities from the intra-binary shock once the spin-down power is fixed at a certain value (i.e., erg s-1), as the synchrotron luminosity is proportional to the square of the magnetic field strength, which depends on the magnetization as . For 3FGL J0954.83948, we applied to match the observed X-ray luminosity.
The initial energies of the accelerated particles are assumed to be power-law distributed. The maximum energy of the particles is determined by balancing the synchrotron loss time scale and the acceleration time scale, yielding the Lorentz factor of at maximum, while is assumed for the minimum Lorentz factor. We finally solve the evolution of the energies of the particles under synchrotron radiation (inverse-Compton scattering loss is negligible for the MSP binaries) and calculate the correspinding intra-binary shock emission. Details of the calculation can be found in Takata et al. (2014) and Li et al. (2014).
Figure 5 shows the calculated emission components from the intra-binary shock and the outer gap, which match the Swift/XRT and Fermi-LAT spectra very well. Despite the ideal consistency, we emphasize that the parameter space for this system has not been fully explored, and therefore this specific parameter set is just one example that appears to fit the data. Additional measurements for the key parameters, such as and , are essentially required to accurately capture the full physical behavior of the system in the future.
Note that Camilo et al. (2015) classified 3FGL J0954.83948 as a “poorer pulsar candidate” because of its “monotonically decreasing” (with energies) LAT spectrum, which is theoretically unfavoured for a pulsar. With our intra-binary shock model, we have demonstrated that, even though the magnetospheric emission of a redback pulsar (the outer gap model for instance) peaks at GeV (in the frame of ), the spectrum can be contaminated at low energies by the GeV shock emission, making the -ray counterpart non-pulsar-like. Apparently, -ray spectra are not good as a pulsar indicator alone when very strong intra-binary shock emission is observed.
7.4. The Largely-Shifted LAT Localization
We should not expect 100% accuracy for 95% error ellipses by definition, however, the case of 3FGL J0954.83948 is quite extreme—the 3FGL and the updated error regions are separated by 6′ and just barely touch each other by the edges (Figure 1)—which may worth a brief discussion. We compared the 3FGL localization with the previous results in 1/2FGL, the 1FGL 95% error ellipse is big enough to encompass all the localizations, including the new best-fit position, while the ones in 2FGL (which has the X-ray/optical/radio counterpart inside) and 3FGL are more consistent with each other. To ensure the reliability of the new LAT localization, we visually checked the count map and the TS map, which both confirm the new best-fit position. Furthermore, our new error circle is almost identical to that in FL8Y (i.e., FL8Y J0955.43949; Figure 1).
Obviously, the great improvement is given by a much higher quality of data as more than 9 years of Pass 8 data were used. At the same time, 3FGL J0954.83948 is a relatively bright and significant -ray source in 3FGL with a detection significance of , reflecting that the unsatisfactory localization is unlikely caused by insufficient quality of the data used in the catalog. Strong variability of nearby sources can possibly affect the best-fit localization of an object, however, no cataloged variable -ray source can be found within 4∘ from 3FGL J0954.83948. Alternatively, the Galactic diffuse emission in this area may not be well modelled in 3FGL, leading to residual emission that could cause the offset. Though 3FGL J0954.83948 is about away from the Galactic plane, there is still plenty of Galactic structure to make this scenario possible. Lastly, the relatively soft -ray spectrum of 3FGL J0954.83948 (the photon index is 2.54 in 3FGL; Acero et al. 2015) could also account for the underestimated positional uncertainty.
In any case, our Fermi-LAT study on 3FGL J0954.83948 clearly shows that the 95% error ellipses from the likelihood analysis can be underestimated sometimes, even for bright sources with significant detections. While we believe that most of the 3FGL error ellipses are still reliable, expanding the regions of interest slightly beyond the LAT error ellipses could be a wise strategy when identifying unassociated Fermi-LAT sources with multi-wavelength observations.
References
- Abdo et al. (2010) Abdo, A. A., Ackermann, M., Ajello, M., et al. 2010, ApJS, 188, 405
- Abdo et al. (2013) Abdo, A. A., Ajello, M., Allafort, A., et al. 2013, ApJS, 208, 17
- Acero et al. (2015) Acero, F., Ackermann, M., Ajello, M., et al. 2015, ApJS, 218, 23
- Acero et al. (2016) —. 2016, ApJS, 223, 26
- Alpar et al. (1982) Alpar, M. A., Cheng, A. F., Ruderman, M. A., & Shaham, J. 1982, Nature, 300, 728
- An et al. (2017) An, H., Romani, R. W., Johnson, T., Kerr, M., & Clark, C. J. 2017, ApJ, 850, 100
- Archibald et al. (2009) Archibald, A. M., Stairs, I. H., Ransom, S. M., et al. 2009, Science, 324, 1411
- Atwood et al. (2013) Atwood, W., Albert, A., Baldini, L., et al. 2013, ArXiv e-prints, arXiv:1303.3514
- Bailer-Jones et al. (2018) Bailer-Jones, C. A. L., Rybizki, J., Fouesneau, M., Mantelet, G., & Andrae, R. 2018, ArXiv e-prints, arXiv:1804.10121
- Bogdanov & Halpern (2015) Bogdanov, S., & Halpern, J. P. 2015, ApJ, 803, L27
- Camilo et al. (2015) Camilo, F., Kerr, M., Ray, P. S., et al. 2015, ApJ, 810, 85
- Camilo et al. (2016) Camilo, F., Reynolds, J. E., Ransom, S. M., et al. 2016, ApJ, 820, 6
- Canto et al. (1996) Canto, J., Raga, A. C., & Wilkin, F. P. 1996, ApJ, 469, 729
- Cash (1979) Cash, W. 1979, ApJ, 228, 939
- Cenarro et al. (2001) Cenarro, A. J., Cardiel, N., Gorgas, J., et al. 2001, MNRAS, 326, 959
- Chen et al. (2013) Chen, H.-L., Chen, X., Tauris, T. M., & Han, Z. 2013, ApJ, 775, 27
- Cheng et al. (1986) Cheng, K. S., Ho, C., & Ruderman, M. 1986, ApJ, 300, 500
- Clemens et al. (2004) Clemens, J. C., Crain, J. A., & Anderson, R. 2004, in Proc. SPIE, Vol. 5492, Ground-based Instrumentation for Astronomy, ed. A. F. M. Moorwood & M. Iye, 331–340
- Condon et al. (1998) Condon, J. J., Cotton, W. D., Greisen, E. W., et al. 1998, AJ, 115, 1693
- Drake et al. (2009) Drake, A. J., Djorgovski, S. G., Mahabal, A., et al. 2009, ApJ, 696, 870
- Drake et al. (2017) Drake, A. J., Djorgovski, S. G., Catelan, M., et al. 2017, MNRAS, 469, 3688
- Eastman et al. (2010) Eastman, J., Siverd, R., & Gaudi, B. S. 2010, PASP, 122, 935
- Evans et al. (2007) Evans, P. A., Beardmore, A. P., Page, K. L., et al. 2007, A&A, 469, 379
- Evans et al. (2009) —. 2009, MNRAS, 397, 1177
- Evans et al. (2014) Evans, P. A., Osborne, J. P., Beardmore, A. P., et al. 2014, ApJS, 210, 8
- Frail et al. (2016) Frail, D. A., Mooley, K. P., Jagannathan, P., & Intema, H. T. 2016, MNRAS, 461, 1062
- Frail et al. (2018) Frail, D. A., Ray, P. S., Mooley, K. P., et al. 2018, MNRAS, 475, 942
- Gaia Collaboration et al. (2018) Gaia Collaboration, Brown, A. G. A., Vallenari, A., et al. 2018, ArXiv e-prints, arXiv:1804.09365
- Gaia Collaboration et al. (2016) Gaia Collaboration, Prusti, T., de Bruijne, J. H. J., et al. 2016, A&A, 595, A1
- Güver & Özel (2009) Güver, T., & Özel, F. 2009, MNRAS, 400, 2050
- Halpern et al. (2017) Halpern, J. P., Strader, J., & Li, M. 2017, ApJ, 844, 150
- Hui et al. (2015) Hui, C. Y., Hu, C. P., Park, S. M., et al. 2015, ApJ, 801, L27
- Intema et al. (2017) Intema, H. T., Jagannathan, P., Mooley, K. P., & Frail, D. A. 2017, A&A, 598, A78
- Jankowski et al. (2018) Jankowski, F., van Straten, W., Keane, E. F., et al. 2018, MNRAS, 473, 4436
- Kalberla et al. (2005) Kalberla, P. M. W., Burton, W. B., Hartmann, D., et al. 2005, A&A, 440, 775
- Kataoka et al. (2012) Kataoka, J., Yatsu, Y., Kawai, N., et al. 2012, ApJ, 757, 176
- Kong et al. (2017) Kong, A. K. H., Hui, C. Y., Takata, J., Li, K. L., & Tam, P. H. T. 2017, ApJ, 839, 130
- Kong et al. (2018) Kong, A. K. H., Takata, J., Hui, C. Y., et al. 2018, MNRAS, 478, 3987
- Kong et al. (2012) Kong, A. K. H., Huang, R. H. H., Cheng, K. S., et al. 2012, ApJ, 747, L3
- Kong et al. (2014) Kong, A. K. H., Jin, R., Yen, T.-C., et al. 2014, ApJ, 794, L22
- Kraft et al. (1991) Kraft, R. P., Burrows, D. N., & Nousek, J. A. 1991, ApJ, 374, 344
- Li et al. (2016) Li, K.-L., Kong, A. K. H., Hou, X., et al. 2016, ApJ, 833, 143
- Li et al. (2014) Li, K. L., Kong, A. K. H., Takata, J., et al. 2014, ApJ, 797, 111
- Linares (2014) Linares, M. 2014, ApJ, 795, 72
- Linares et al. (2017) Linares, M., Miles-Páez, P., Rodríguez-Gil, P., et al. 2017, MNRAS, 465, 4602
- Lindegren et al. (2018) Lindegren, L., Hernandez, J., Bombrun, A., et al. 2018, ArXiv e-prints, arXiv:1804.09366
- Luri et al. (2018) Luri, X., Brown, A. G. A., Sarro, L. M., et al. 2018, ArXiv e-prints, arXiv:1804.09376
- Mattox et al. (1996) Mattox, J. R., Bertsch, D. L., Chiang, J., et al. 1996, ApJ, 461, 396
- Mauch et al. (2003) Mauch, T., Murphy, T., Buttery, H. J., et al. 2003, MNRAS, 342, 1117
- Moretti et al. (2005) Moretti, A., Campana, S., Mineo, T., et al. 2005, in Proc. SPIE, Vol. 5898, UV, X-Ray, and Gamma-Ray Space Instrumentation for Astronomy XIV, ed. O. H. W. Siegmund, 360–368
- Nolan et al. (2012) Nolan, P. L., Abdo, A. A., Ackermann, M., et al. 2012, ApJS, 199, 31
- Orosz & Hauschildt (2000) Orosz, J. A., & Hauschildt, P. H. 2000, A&A, 364, 265
- Papitto et al. (2013) Papitto, A., Ferrigno, C., Bozzo, E., et al. 2013, Nature, 501, 517
- Patruno et al. (2014) Patruno, A., Archibald, A. M., Hessels, J. W. T., et al. 2014, ApJ, 781, L3
- Pletsch & Clark (2015) Pletsch, H. J., & Clark, C. J. 2015, ApJ, 807, 18
- Pletsch et al. (2012) Pletsch, H. J., Guillemot, L., Fehrmann, H., et al. 2012, Science, 338, 1314
- Price-Whelan et al. (2017) Price-Whelan, A. M., Hogg, D. W., Foreman-Mackey, D., & Rix, H.-W. 2017, ApJ, 837, 20
- Roberts (2013) Roberts, M. S. E. 2013, in IAU Symposium, Vol. 291, Neutron Stars and Pulsars: Challenges and Opportunities after 80 years, ed. J. van Leeuwen, 127–132
- Romani (2012) Romani, R. W. 2012, ApJ, 754, L25
- Romani (2015) —. 2015, ApJ, 812, L24
- Romani et al. (2014) Romani, R. W., Filippenko, A. V., & Cenko, S. B. 2014, ApJ, 793, L20
- Romani & Shaw (2011) Romani, R. W., & Shaw, M. S. 2011, ApJ, 743, L26
- Roy et al. (2015) Roy, J., Ray, P. S., Bhattacharyya, B., et al. 2015, ApJ, 800, L12
- Salvetti et al. (2015) Salvetti, D., Mignani, R. P., De Luca, A., et al. 2015, ApJ, 814, 88
- Saz Parkinson et al. (2016) Saz Parkinson, P. M., Xu, H., Yu, P. L. H., et al. 2016, ApJ, 820, 8
- Stappers et al. (2014) Stappers, B. W., Archibald, A. M., Hessels, J. W. T., et al. 2014, ApJ, 790, 39
- Strader et al. (2014) Strader, J., Chomiuk, L., Sonbas, E., et al. 2014, ApJ, 788, L27
- Strader et al. (2016) Strader, J., Li, K.-L., Chomiuk, L., et al. 2016, ApJ, 831, 89
- Strader et al. (2015) Strader, J., Chomiuk, L., Cheung, C. C., et al. 2015, ApJ, 804, L12
- Swihart et al. (2017) Swihart, S. J., Strader, J., Johnson, T. J., et al. 2017, ApJ, 851, 31
- Takata et al. (2014) Takata, J., Li, K. L., Leung, G. C. K., et al. 2014, ApJ, 785, 131
- van den Heuvel & van Paradijs (1988) van den Heuvel, E. P. J., & van Paradijs, J. 1988, Nature, 334, 227
- Wang et al. (2010) Wang, Y., Takata, J., & Cheng, K. S. 2010, ApJ, 720, 178
- Wood et al. (2017) Wood, M., Caputo, R., Charles, E., et al. 2017, ArXiv e-prints, arXiv:1707.09551