ALMA Observations of the Solar Chromosphere on the Polar Limb
Abstract
We report the results of the Atacama Large Millimeter/sub-millimeter Array (ALMA) observations of the solar chromosphere on the southern polar limb. Coordinated observations with the Interface Region Imaging Spectrograph (IRIS) are also conducted. ALMA provided unprecedented high spatial resolution in the millimeter band ( 2.0″) at 100 GHz frequency with a moderate cadence (20 s). The results are as follows: (1) The ALMA 100 GHz images show saw-tooth patterns on the limb, and a comparison with SDO/AIA 171Å images shows a good correspondence of the limbs with each other. (2) The ALMA 100 GHz movie shows a dynamic thorn-like structure elongating from the saw-tooth patterns on the limb, with lengths reaching at least 8″, thus suggesting jet-like activity in the ALMA microwave range. These ALMA jets are in good correspondence with IRIS jet clusters. (3) A blob ejection event is observed. By comparing with the IRIS Mg II slit-jaw images, the trajectory of the blob is located along the spicular patterns.
=5
1 Introduction
The solar chromosphere is a region where many types of magnetohydrodynamic (MHD) phenomena can be observed such as brightening, eruptions, jets, and waves. It has been mainly observed at visible or ultraviolet wavelengths corresponding to absorption or emission lines. It can also be observed in microwave bands that correspond to emission mainly of the thermal continuum from plasma. We can diagnose the electron density or temperature of the plasma. According to the solar atmospheric models by Vernazza et al. (1981), the altitude of the 100 GHz emission is between 1300 and 2000 km (see also Avrett & Loeser 2008). During flares, non-thermal synchrotron emission in the optically thin range could appear and may provide information of accelerated particles and magnetic fields. The formation heights of the flare free-free ALMA continuum have been computed by Heinzel & Avrett (2012).
The Nobeyama Radioheliograph (NoRH, Nakajima et al. 1994) is a microwave instrument dedicated for solar observations at 17 and 34 GHz wavebands, which captures full disk images of the Sun. Flares (Yokoyama et al. 2002, Asai et al. 2013, Minoshima et al. 2009), plasma eruptions (Gopalswamy et al. 2003) and long-term solar activity (Shimojo 2013) have been studied with this instrument. However, the spatial resolution of NoRH is only 10″ and 5″ for 17 and 34 GHz, respectively, which is insufficient to investigate fine structures in the chromosphere.
The Atacama Large Millimeter/sub-millimeter Array (ALMA, Wootten & Thompson 2009) has opened a new solar observational window with its excellent capabilities that achieve a spatial resolution up to 1 arcsecond and is expected to eventually be upgraded to sub-arcsecond resolution. Some studies have already been published using ALMA science verification data (Shimojo et al. 2017a, Iwai et al. 2017, Bastian et al. 2017, Loukitcheva et al. 2017 ). From ALMA Cycle-4 operations, solar observations became accessible on a proposal basis. Using this opportunity, we observed a polar region of the Sun with ALMA.
One of interesting subjects on the chromospheric dynamics is the generation of jets, such as spicules in quiet regions and coronal holes and dynamic fibrils in active regions (Okamoto & De Pontieu 2011 and references therein). Plasma flows with super-sonic speed are believed to be ejected via the interaction of shock waves with the transition region contact surface (Suematsu et al. 1982; Hollweg 1982). These shock waves are generated by linear or non-linear mode conversion through wave propagation after the generation at the photospheric level. The original forms at the surface are magneto-sonic or Alfvenic waves, which are under the strong influence of magnetic fields. Moreover, during the propagation, the shocks suffer from the radiative cooling of a plasma in non local termodynamic equiillibrium (non-LTE). Thus, the jet production, propagation, and energy-loss provide a clue for understanding the transport of energy to the corona.
In this paper, we report on our observations of the solar-limb chromosphere using ALMA data. By comparing with ultraviolet data obtained by the Interface Region Imaging Spectrograph (IRIS), we found a correspondence in the dynamic features in the ALMA data with IRIS spicules. Among such jet activities, one event was observed that had a blob-like ejection. This is the first ALMA report on the jet activities in the chromosphere. We report the observations in Section 2, results in Section 3, discussion in Section 4, and conclusion in Section 5.
2 Observations
The observations were performed in 1 h around 14:30 UT on 2017 April 29. The target region was the solar south pole. ALMA obtained Band-3 data in this time period within the 100 GHz frequency range. The instrumental integration time was 2 s. Owing to weather conditions, a Band-6 observation that was also proposed at 239 GHz was cancelled. Because all of the data in the spectrum window is used for image synthesis, the observing frequency of the image (100 GHz) is the same as that of the local oscillator. The major and minor axes of the synthesized beam are 2.56″ (1.86 Mm on the Sun) in the east-west direction and 1.60″ (1.16 Mm) in the north-south direction, respectively.
The ALMA data is calibrated with the nominal processes developed for solar observations in Shimojo et al. (2017b). In addition to those calibrations, to increase the image quality (in particular, the contrast), we synthesize each image with an integration time of 20 s after performing a following two-step self-calibration for the antenna’s phases. In the first step, we construct a calibration model using an image synthesized by data from the entire observation period. This reduces the jitter motion caused by variation in sky seeing. In the second step, we repeated the same procedure but synthesized images every 20 s and used each of them with a 20-s cadence as a calibration model for each data slot. Despite these calibrations, it is still difficult to determine the absolute brightness temperature in the ALMA data (For detailed discussion on limb artifacts and the speicial treatment, see Shimojo et al. 2017b). Therefore, we assume that the brightness of the solar disk is 7000 K (Avrett & Loeser 2008). Note that this assumption does not significantly affect our results because the interpretation is limited to the relative enhancements beyond the background signal.
A coordinated observation with IRIS (De Pontieu et al. 2014) was executed so that ultraviolet data in the same field of view was available. IRIS obtained slit-jaw images (SJIs) of Si IV and Mg II lines with a cadence and a spatial resolution of 19 s and ″-″ (240 – 290 km on the Sun), respectively. The Atmospheric Imaging Assembly (AIA; Lemen et al. 2012) on board the Solar Dynamics Observatory (SDO) provided context filtergrams of multiple wavelengths with a cadence of 12 s.
3 Results
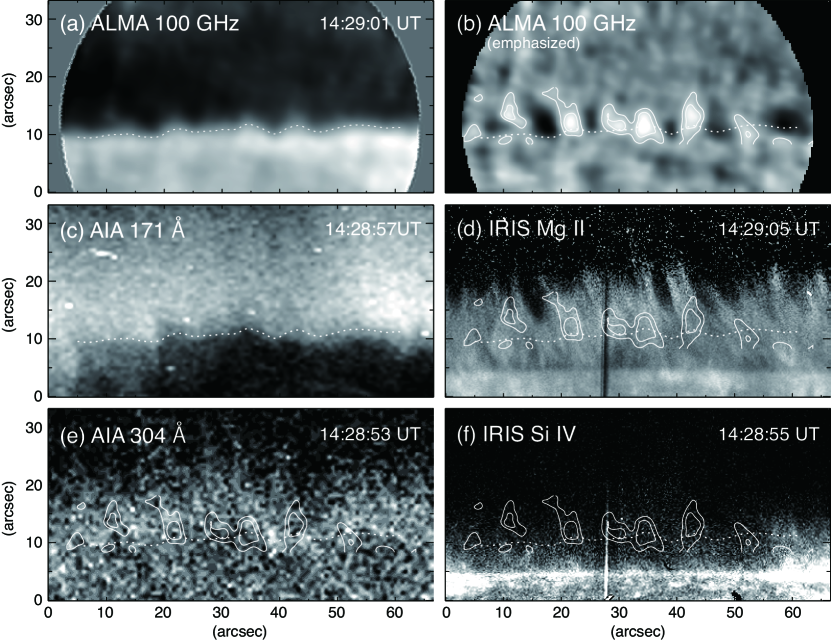
Figure 1 shows the observational results. The ALMA 100 GHz image (panel a) shows a saw-tooth pattern on the limb. There is a good correspondence in the limb location between the ALMA data and the AIA 171Å images (see the dotted line in panel c). This means that the AIA 171Å limb is a manifestation of the absorption by the chromospheric materials observed in the ALMA data.
Panel b shows the distribution of the relative brightness in the ALMA 100 GHz data defined as follows:
| (1) |
where
| (2) |
is a temporally averaged brightness over the entire observed period (). The ALMA 100 GHz relative brightness and its corresponding movie (panel b) show a dynamic thorn-like structure coming from the saw-tooth patterns on the limb. Because these structures show dynamic motion with elongation and shortening, hereafter we call them ALMA jets. Their length reaches at least 8″, suggesting jet-like activity in the ALMA microwave range. Unfortunately owing to the insufficient signal to noise ratio in the data beyond the limb particularly in the area more than 10″ beyond the limb (see Section 4), we can not recognize the maximum height of the elongated jets. The speed of the elongation is 30–40 . The width of each jet is less than the spatial resolution of the observation, i.e. less than 2″.
The IRIS/SJI Mg II images (panel d) clearly show the appearance of spicules on the limb. Some of the spicular jets reach more than 20″ beyond the Mg II limb. It is noteworthy that the spicular jets show clustered structures, i.e. multiple needle-like features display a collective up-and-down motion. Each needle-like structure has a width less than 1″ and each cluster has a few to several needle-like structures. In comparison with the ALMA data (contours in panel d), the ALMA jets are in good agreement with the IRIS jet clusters.
The IRIS Mg II limb (panel d) is 5″ below the ALMA limb. Again, this confirms the distribution of cool chromospheric plasmas between the IRIS Mg II and ALMA limbs (For IRIS limb analysis, see Alissandrakis et al. 2018). In the IRIS/SJI Si data (panel f), one can observe the activities on the solar surface inside the limb. Some of them correspond to the footpoints of the Mg II spicules. The AIA 304Å data (panel e) has a low signal-to-noise ratio and is difficult to extract information on jet activities.
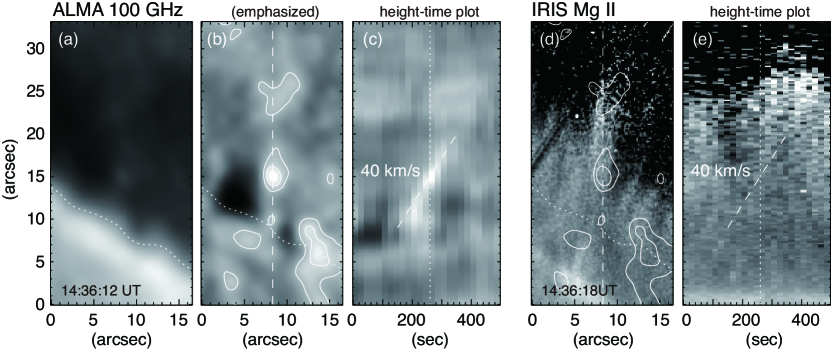
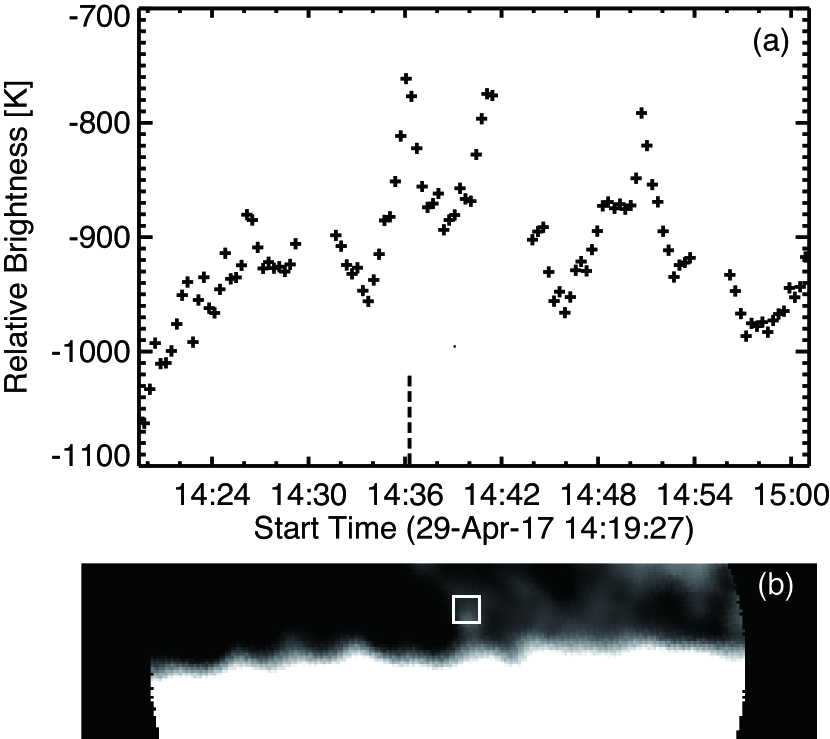
In one of the tall jets in IRIS Mg II, an ALMA blob ejection was found. From Figure 2, one can find the trajectory of the blob co-located with the Mg II jet. The brightness enhancement in ALMA images is by 135 K beyond the background (Figure 3). The blob shows a systematic proper motion at a speed of 40 km/s (panel c), which is similar to the IRIS jet speed (panel e). There are no significant features in the IRIS Si or the AIA data sets co-located with this blob event. However, by the careful inspection of the IRIS Si data, we found short ( a few arcseconds) elongated structures at the base of this event. They show shifting from east to west changing its inclination angle.
4 Discussion
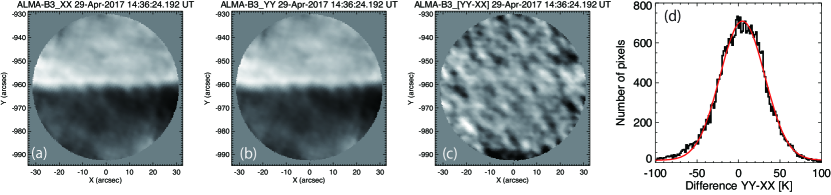
The noise level in the 100 GHz images is evaluated using the XX and YY cross correlations (out of the four available, XX, YY, XY, and YX) of orthogonal linear polarizations (X and Y) measured by ALMA receivers. In the absence of any flare emission, which is the case of our study, solar mm/sub-mm emission is thermal with very weak net linear polarization. Assuming the subtraction of brightness temperature obtained by each of the XX- and YY- correlations is zero, the remaining signals can be regarded as noises (Shimojo et al. 2017b). The measured level of the noise is 13.2 K (Figure 4). Although the lower part of the images (Figure 4a, and b) indicates the sky, we can observe brightness enhancement. The enhancement is caused by the artifacts described in Shimojo et al. (2017b). Hence, we use only the data near the limb (image center) for the analysis, where these artifacts have a weak influence on our results.
In terms of the blob ejection event, an estimation of the physical variables may help its interpretation. Here we try to derive the electron density based on an assumption of the emission via the thermal free-free interaction, i.e. its optical thickness given as follows (e.g. Dulk 1985; Lang 1980):
| (3) |
where
| (4) |
is a velocity averaged Gaunt factor, emission measure. is the observing frequency, , , are the temperature, electron density, and the distributing length along the line of sight of the emitting plasmas, respectively, , , , and are the electron mass, the Boltzmann constant, the speed of light, and the elementary charge, respectively, and is a constant. Considering the observed brightness temperature and, assuming a small optical thickness, 100% filling factor, and approximated with the width of the observed blob, and , we obtain in the range of . This number is a factor of one order of magnitude smaller than those for spicules obtained through the analysis of the IRIS spectrum data by Alissandrakis et al. (2018) (see also Beckers 1972; Krall et al. 1976). The reason for this discrepancy might result from our assumed filling factor of 100%. Because our measurement of the blob size as is comparable with the spatial resolution of the observation, it is highly possible that is overestimated so that affecting the filling volume estimation in every dimension. To make this result improved, we need at least higher resolution observations by ALMA.
For a production mechanism of tall spicules, Iijima & Yokoyama (2017) proposed a model in which jets are driven by the shock waves originated from the highly non-linear large amplitude Alfven waves in the chromosphere (Iijima & Yokoyama 2015, see also Kudoh & Shibata 1999). The other proposed energy sources are the acoustic waves generated by the photospheric convection motion (Thomas 1948, Osterbrock 1961, Uchida 1961) and acoustic waves generated by magnetic reconnection (Pikel’ner 1971, Uchida 1969). The magnetic reconnection model is advantageous because the chromospheric jets are accelerated by both the shock wave and the Lorentz force (Takasao et al. 2013). Using the available data in the present observations, we could not confirm the proposed model. For further investigation of the jet generation mechanisms, high resolution images around the base of jets are required. This is achievable using other high frequency modes of ALMA, such as Band-6 (239 GHz) or beyond in the subsequent observational cycles.
5 Conclusion
We report the results of the ALMA observations of the solar chromosphere on the southern polar limb. The results are as follows: (1) The ALMA 100 GHz image shows saw-tooth patterns on the limb. The comparison with AIA 171Å images shows a good correspondence of the limbs in both data sets. (2) The ALMA 100 GHz movie shows a dynamic thorn-like structure rising from the saw-tooth patterns on the limb. Their length reaches at least 8″, thus suggesting jet-like activities in the ALMA microwave range. These ALMA jets are in good agreement with IRIS jet clusters. (3) A blob-ejection event is found. By comparing with the IRIS Mg II SJIs, the trajectory of the blob is located along the spicular patterns. The signal level is 135 K at ten-sigma level. The blob shows a systematic proper motion at a speed of 40 km/s, which is similar to the jet speed.
References
- Alissandrakis et al. (2018) Alissandrakis, C. E., Vial, J.-C., Koukras, A., Buchlin, E., & Chane-Yook, M. 2018, Sol. Phys., 293, 20
- Asai et al. (2013) Asai, A., Kiyohara, J., Takasaki, H., et al. 2013, ApJ, 763, 87
- Avrett & Loeser (2008) Avrett, E. H., & Loeser, R. 2008, ApJS, 175, 229
- Bastian et al. (2017) Bastian, T. S., Chintzoglou, G., De Pontieu, B., et al. 2017, ApJ, 845, L19
- Beckers (1972) Beckers, J. M. 1972, ARA&A, 10, 73
- De Pontieu et al. (2014) De Pontieu, B., Title, A. M., Lemen, J. R., et al. 2014, Sol. Phys., 289, 2733
- Dulk (1985) Dulk, G. A. 1985, ARA&A, 23, 169
- Gopalswamy et al. (2003) Gopalswamy, N., Shimojo, M., Lu, W., et al. 2003, ApJ, 586, 562
- Heinzel & Avrett (2012) Heinzel, P., & Avrett, E. H. 2012, Sol. Phys., 277, 31
- Hollweg (1982) Hollweg, J. V. 1982, ApJ, 257, 345
- Iijima & Yokoyama (2015) Iijima, H., & Yokoyama, T. 2015, ApJ, 812, L30
- Iijima & Yokoyama (2017) —. 2017, ApJ, 848, 38
- Iwai et al. (2017) Iwai, K., Loukitcheva, M., Shimojo, M., Solanki, S. K., & White, S. M. 2017, ApJ, 841, L20
- Krall et al. (1976) Krall, K. R., Bessey, R. J., & Beckers, J. M. 1976, Sol. Phys., 46, 93
- Kudoh & Shibata (1999) Kudoh, T., & Shibata, K. 1999, ApJ, 514, 493
- Lang (1980) Lang, K. R. 1980, Astrophysical Formulae. A Compendium for the Physicist and Astrophysicist. (Springer-Verlag Berlin Heidelberg New York)
- Lemen et al. (2012) Lemen, J. R., Title, A. M., Akin, D. J., et al. 2012, Sol. Phys., 275, 17
- Loukitcheva et al. (2017) Loukitcheva, M. A., Iwai, K., Solanki, S. K., White, S. M., & Shimojo, M. 2017, ApJ, 850, 35
- Minoshima et al. (2009) Minoshima, T., Imada, S., Morimoto, T., et al. 2009, ApJ, 697, 843
- Nakajima et al. (1994) Nakajima, H., Nishio, M., Enome, S., et al. 1994, IEEE Proceedings, 82, 705
- Okamoto & De Pontieu (2011) Okamoto, T. J., & De Pontieu, B. 2011, ApJ, 736, L24
- Osterbrock (1961) Osterbrock, D. E. 1961, ApJ, 134, 347
- Pikel’ner (1971) Pikel’ner, S. B. 1971, Comments on Astrophysics and Space Physics, 3, 33
- Shimojo (2013) Shimojo, M. 2013, PASJ, 65, S16
- Shimojo et al. (2017a) Shimojo, M., Iwai, K., Asai, A., et al. 2017a, ApJ, 848, 62
- Shimojo et al. (2017b) Shimojo, M., Bastian, T. S., Hales, A. S., et al. 2017b, Sol. Phys., 292, 87
- Suematsu et al. (1982) Suematsu, Y., Shibata, K., Neshikawa, T., & Kitai, R. 1982, Sol. Phys., 75, 99
- Takasao et al. (2013) Takasao, S., Isobe, H., & Shibata, K. 2013, PASJ, 65, 62
- Thomas (1948) Thomas, R. N. 1948, ApJ, 108, 130
- Uchida (1961) Uchida, Y. 1961, PASJ, 13, 321
- Uchida (1969) —. 1969, PASJ, 21, 128
- Vernazza et al. (1981) Vernazza, J. E., Avrett, E. H., & Loeser, R. 1981, ApJS, 45, 635
- Wootten & Thompson (2009) Wootten, A., & Thompson, A. R. 2009, IEEE Proceedings, 97, 1463
- Yokoyama et al. (2002) Yokoyama, T., Nakajima, H., Shibasaki, K., Melnikov, V. F., & Stepanov, A. V. 2002, ApJ, 576, L87