Quasiparticle Screening near a Bosonic Superconductor-Insulator Transition
Revealed by Magnetic Impurity Doping
Abstract
Experiments show that the Cooper pair transport in the insulator phase that forms at thin film superconductor to insulator transitions (SIT) is simply activated. This activated behavior depends on the microscopic factors that drive the localization of the Cooper pairs. To test proposed models, we investigated how a perturbation that weakens Cooper pair binding, magnetic impurity doping, affects the characteristic activation energy, . The data show that decreases monotonically with doping in films tuned farther from the SIT and increases and peaks in films that are closer to the SIT critical point. These observations provide strong evidence that the bosonic SIT in thin films is a Mott transition driven by Coulomb interactions that are screened by virtual quasi-particle excitations. This dependence on underlying fermionic degrees of freedom distinguishes these SITs from those in micro-fabricated Josephson Junction Arrays, cold atom systems, and likely in high temperature superconductors with nodes in their quasiparticle density of states.
The activation energy characterizing a process in a condensed matter system provides a window into its quantum many body ground state. For example, the resistance of fractional quantum hall states decreases with decreasing temperature at a rate dictated by the energy to create spatially separated quasiparticle-quasihole pairs out of the Laughlin ground stateLaughlin (1983); Boebinger et al. (1987); Girvin et al. (1985). Similarly, the heat capacity of BCS superconductors decreases at a rate dictated by the binding energy of electrons in Cooper pairsTinkham (1996). This paper focuses on an activation energy, ,Sambandamurthy et al. (2004); Baturina et al. (2008); Lin et al. (2014) that grows from zero at disorder tuned bosonic superconductor to insulator quantum phase transitions in ultra-thin films Stewart et al. (2007). It is a barrier to Cooper pair tunneling between localized statesStewart et al. (2007). There are competing models for the physical origin of this barrier. Some attribute it to disorder induced Anderson localization effectsBouadim et al. (2011); Gangopadhyay et al. (2013); Loh et al. (2016) and others to repulsive Coulomb interaction effectsDubi et al. (2006); Beloborodov et al. (2007); Fistul et al. (2008). Results from experiments to date, which have shown that depends on magnetic fieldSambandamurthy et al. (2004); Baturina et al. (2007); Nguyen et al. (2009); Lin et al. (2014), magnetic frustrationNguyen et al. (2009) and normal state resistanceSteiner and Kapitulnik (2005); Stewart et al. (2007), can be accounted for by many of the models leaving the microscopic origins of mysterious. Here, we present measurements of the dependence of on magnetic impurity doping, which weakens Cooper pairing and magnetic frustration, which alters Cooper pair tunneling rates. We describe how the results indicate that the activation barrier depends directly on the average Cooper pair binding energy. Such a dependence arises in Cooper pair tunneling transport models that include screening of a Coulomb barrier by virtual quasi-particle excitationsBeloborodov et al. (2007).
Models for Cooper pair localization at the SIT have led to predictions for their activated resistance,
| (1) |
In most, results from a competition between either potential disorder or Coulomb interactions that localize pairs and pair tunneling, characterized by a hopping rate or a Josephson coupling energy, , that delocalizes pairs. Potential disorder drives Anderson localizationBouadim et al. (2011); Gangopadhyay et al. (2013) of pair states with energies below a mobility edge in the density of states. The activation energy corresponds to the gap between localized and mobile pair statesGangopadhyay et al. (2013). It increases with disorder or decreasing . Coulomb interactions, on the other hand, drive a Mott transition by creating a blockade to pair motion between localized statesEfetov (1980). The blockade is characterized by a charging energy, , that depends on the capacitance between a localized state and its environmentEfetov (1980); Cha and Girvin (1994); Beloborodov et al. (2007); Fistul et al. (2008); Syzranov et al. (2009); Feigel’man et al. (2010); Baturina and Vinokur (2013); Swanson et al. (2014). In the limit, , a Mott gap appears in the transport, , in which the second term arises from screening by Cooper pair motionFazio and Schön (1991); Beloborodov et al. (2007) with a coordination number dependent constant. Experiments that measure how responds to changes in parameters like can test these models and thus, yield insight into Cooper pair localization and transport.
We have employed a thin film platformStewart et al. (2007) that enables unique methods for probing the origins of . The films can be systematically doped with magnetic impurities, which reduces the Cooper pair binding energy, and can be subjected to magnetic frustration, which reduces the average Josephson coupling between localized regionsNguyen et al. (2009) (see Figs. 1 a,b). Since , the doping also reduces . For both the Anderson and Mott models, reducing is expected to enhance and thus, Cooper pair localization. Surprisingly, we found that while magnetic frustration always enhances , magnetic impurity doping can reduce . We discuss how this result intimates that the superconductor to Cooper pair insulator transition is a Mott transition with a Coulomb blockade energy that depends on the pair binding energy.
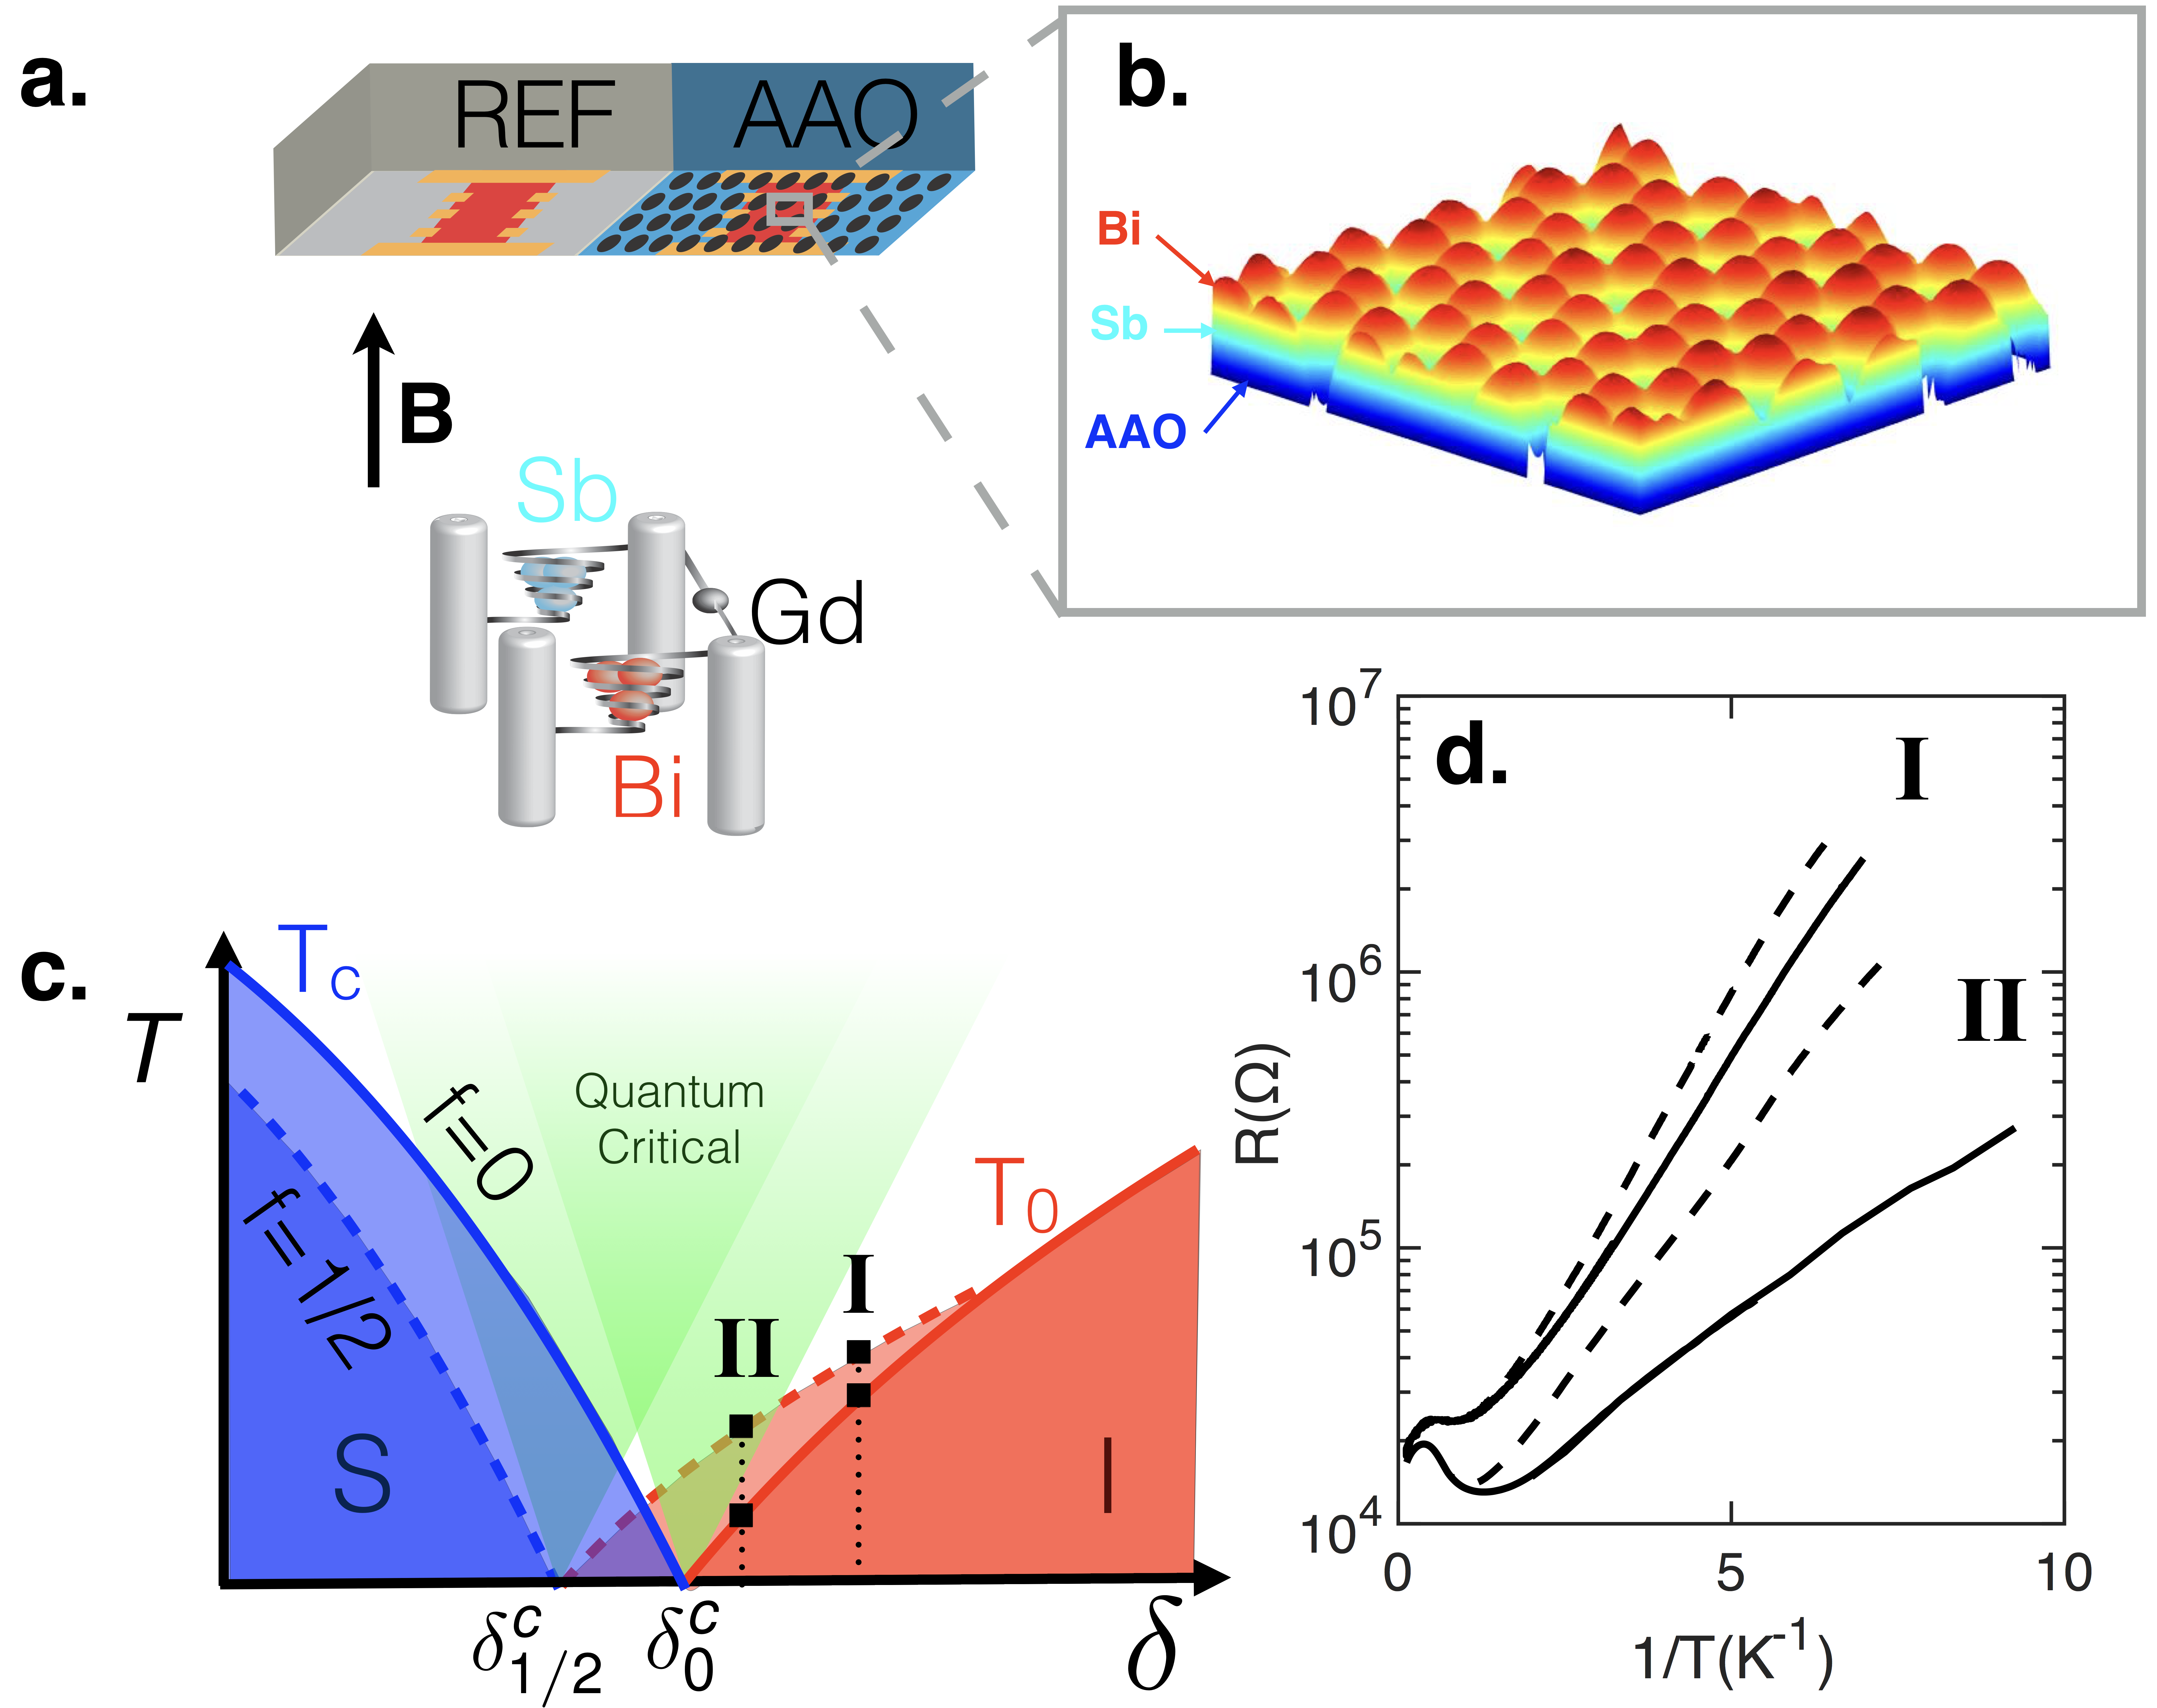
Sub-nanometer thick amorphous Bi films were fabricated and measured in situ in the UHV environment of a dilution refrigerator based evaporator. Bi vapor was quench condensed onto an Sb wetting layer on the surface of two substrates simulataneously: an Anodized Aluminum Oxide substrate, which has regular height variations and an array of pores, and a flat, fire polished glass substrate. Both substrates were held at a temperature, K within the UHV environment of a dilution refrigerator cryostat (Fig. 1). The depositions of Bi and Sb were measured using a quartz crystal micro-balance. The Cooper pair insulator state forms in films on AAO substrates because of nanometer scale height variations, on the AAO surface (see Fig. 1b)Hollen et al. (2011). These lead to local surface slope variations that produce film thickness variations :
| (2) |
Since depends on film thicknessValles et al. (1989) the thickness variations correspond to coupling constant inhomogeneities that localize Cooper pairs to form the Cooper pair insulator state. Insulating films on flat substrates, by contrast, consist only of localized, unpaired electronsFinkelstein (1994) Valles Jr. Dynes, R.C., and Garno, J.P. (1992); Hollen et al. (2013). The film on the flat substrate served as a reference for monitoring 1) the maximum thickness and pairing amplitude that could appear in the films deposited on AAO and 2) the pair breaking effects of the magnetic impurity depositions.
Film sheet resistances were measured as a function of temperature, in situ using standard four-point ac and dc techniques with sufficiently low current bias( nA) to ensure that the measurements were performed in the linear portion of the current-voltage characteristics. A superconducting solenoid applied magnetic fields perpendicular to the films.
The array of pores in the films produced by the AAO templates enable us to explore magnetic field induced frustration effects on the Cooper pair insulator phase. In fact, the appearance of oscillations in the magnetoresistance was an early direct sign of localized Cooper pairs in a thin film system Stewart et al. (2007). The activation energy and location of the SIT critical point (see Fig. 1 c) is periodic in the frustration , where is the magnetic field that produces one superconducting flux quantum per plaquette. for the 100 nm average center to center spacing of nearest neighbor pores. This frustration dependence can be attributed to a modulation of the average Josephson coupling between islands with a period of one flux quantum per plaquetteNguyen et al. (2009); Muller (2013). The average appears as in Quantum Rotor Models, where and are the phases on neighboring islands and is the line integral of the vector potential between islands. For a honeycomb array of islands, the energy barrier for Cooper pair transport is highest for Granato (2016). Phenomenologically, , where is a periodic function.
Magnetic impurity doping involved depositing Gd atop the Cooper pair insulator filmParker et al. (2006). The impurities produce time reversal symmetry breaking spin flip scattering, which reduces the pair binding energy . Their effect extends uniformly through the entire thickness of the films since the films are much thinner ( nm) than the superconducting coherence length ( nm)Chervenak and Valles (1995). The Gd deposition amounts, which were below the micro-balance resolution, were monitored using a calibrated timing method and by measuring their effects on the of the reference film. The two methods agreed well. In the following, we use the relative shift
| (3) |
to represent doping amount. The estimated maximum Gd doping in these experiments corresponded to monolayers.
We studied the effects of magnetic impurity doping and magnetic frustration on two films, I and II, that had different activation energies to explore how proximity to the SIT critical point influences the response. Points for films I and II are indicated on the schematic phase diagram in Fig. 1c. according to their relative activation energies obtained from fits to the data shown in Fig. 1d. Other film I and II parameters are in the Table. The phase diagram shows two distinct critical points for the two frustrations investigated, and Granato (2018). The tuning parameter , corresponds to either or , where is sheet resistance measured at 8K. Previous workStewart et al. (2007) indicated that the critical values of the tuning parameters for the SIT followed .
| I | 18.6 | 0.99 nm | 0.86 K | 0.98 K | 2.59 K |
|---|---|---|---|---|---|
| II | 16.7 | 1.2 nm | 0.40 K | 0.75 K | 2.92 K |
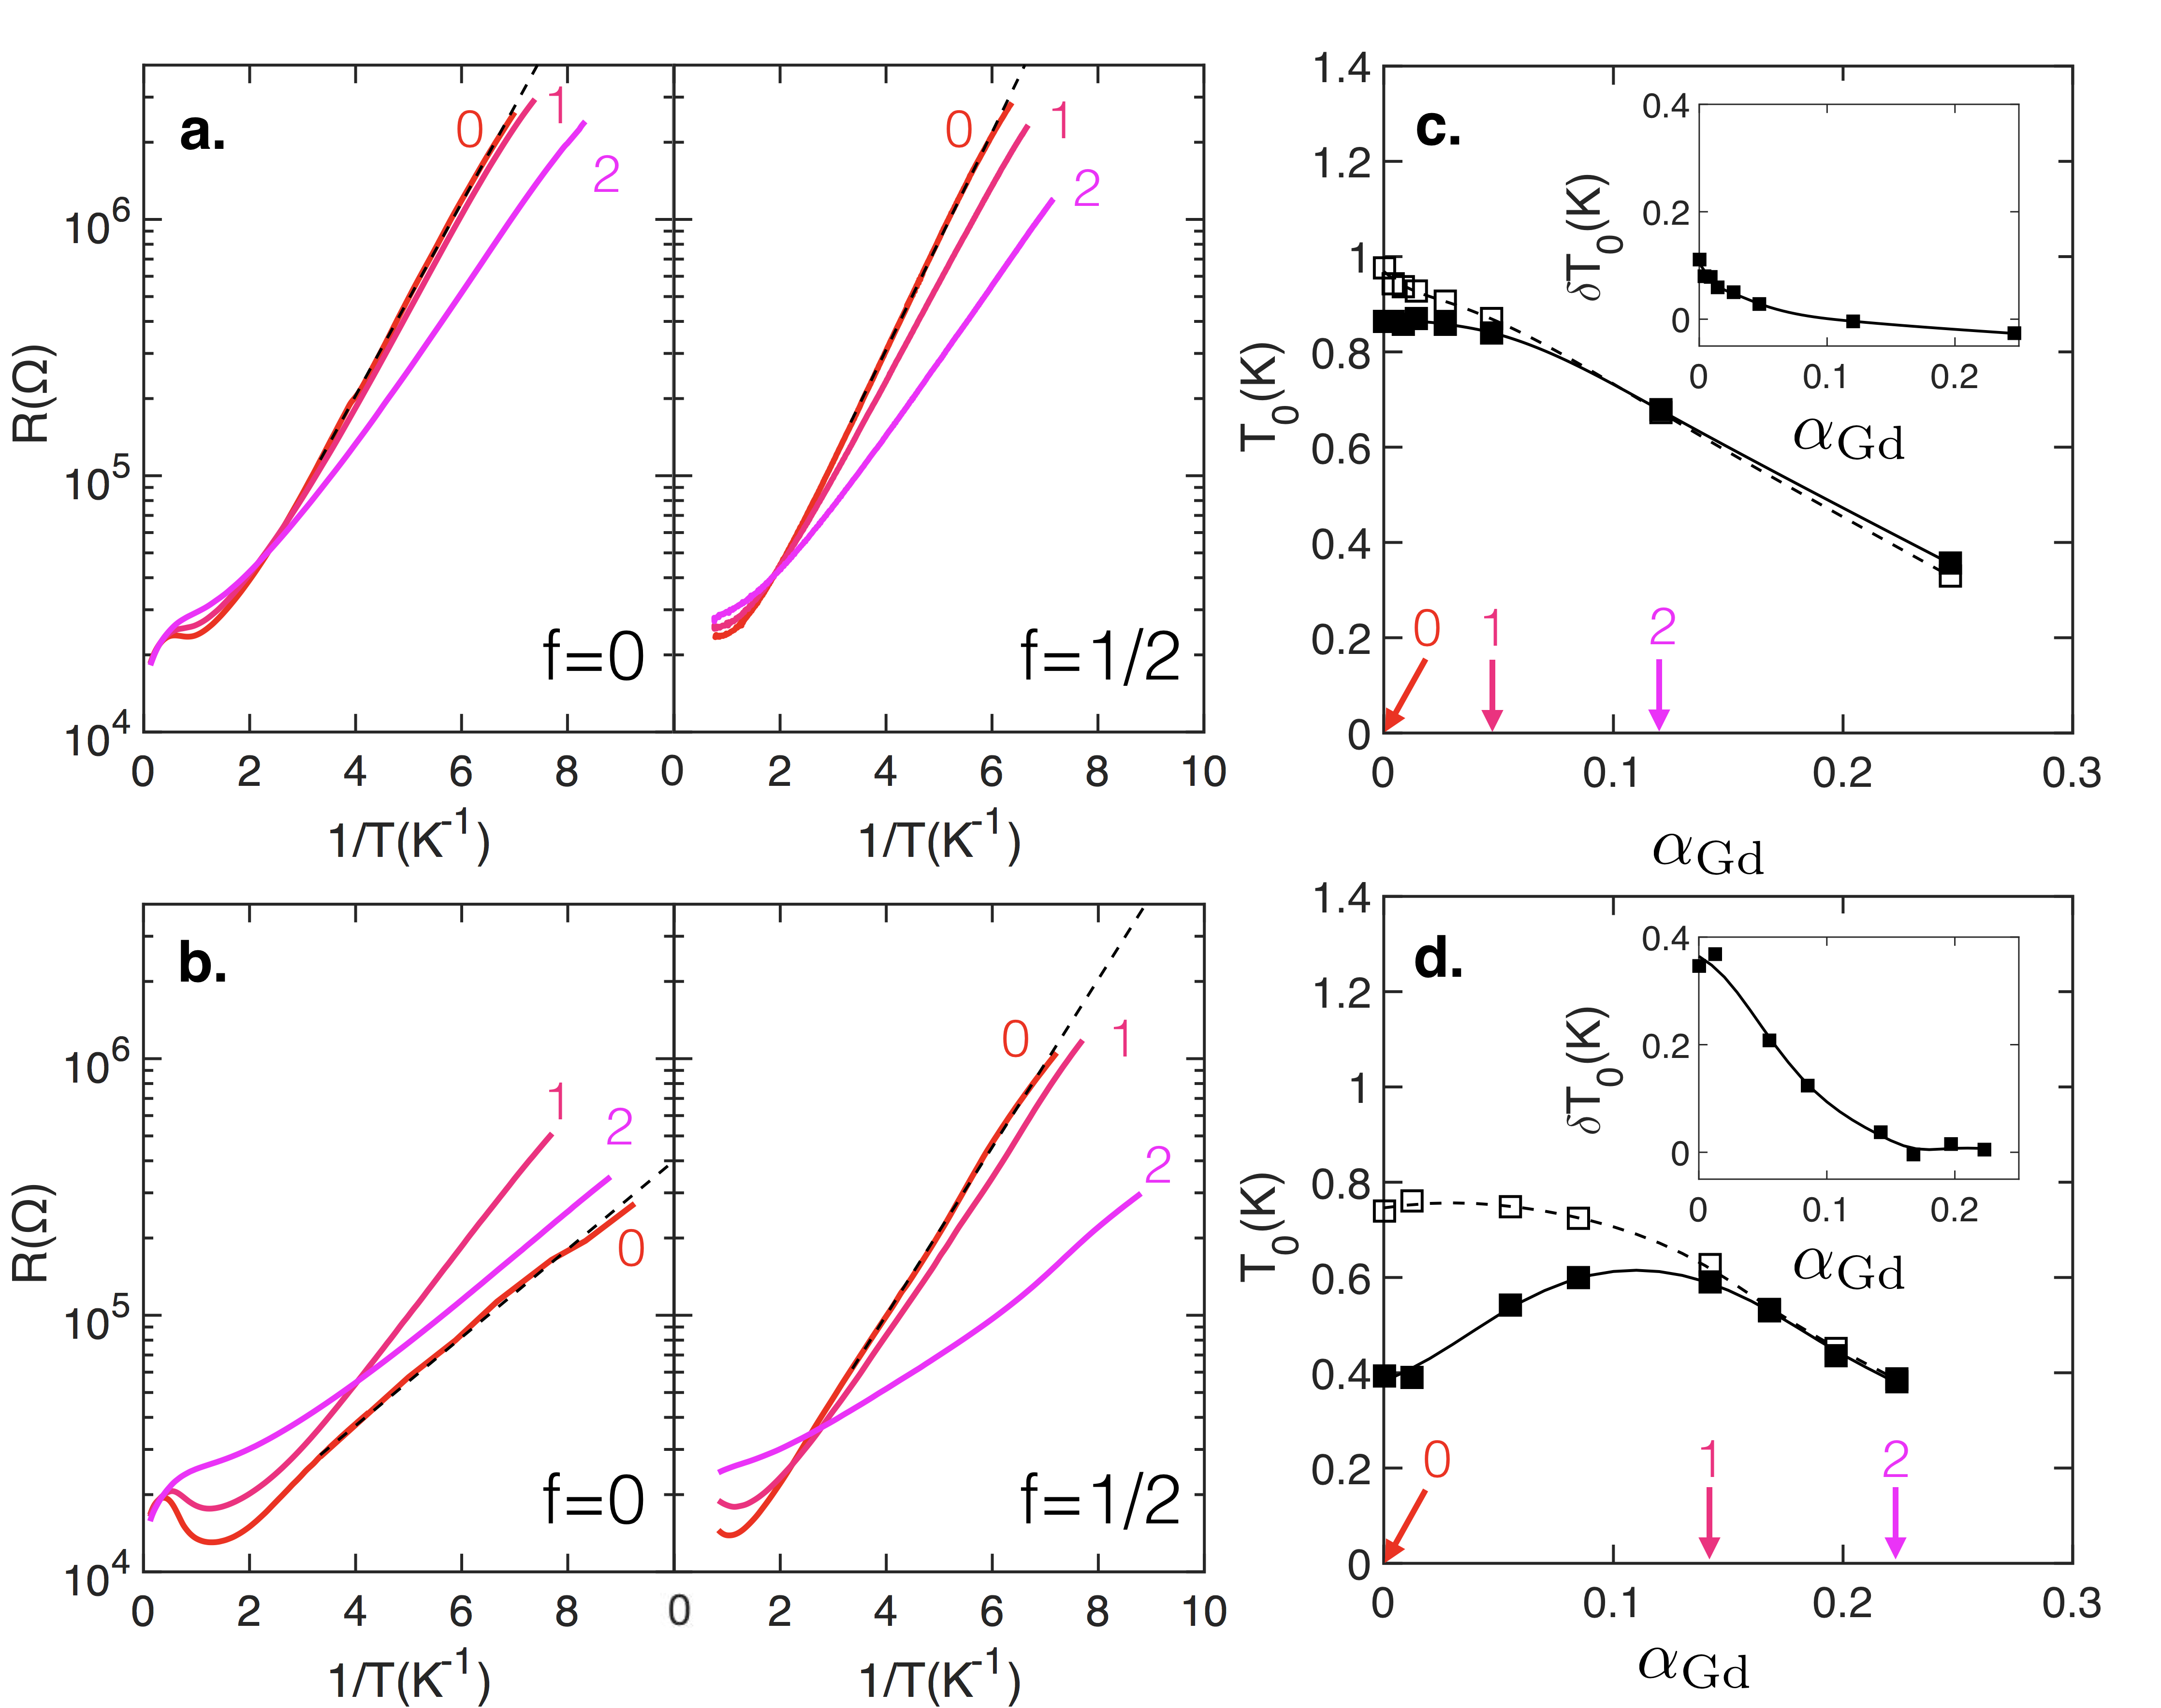
The effects of Gd doping on I and II are displayed in Fig. 2. The Arrhenius plots show that the activated form of persists through the doping range. The evolution of with low doping depends on distance from the SIT. decreases or remains nearly constant and then decreases with Gd doping in the three films farthest from the SIT. By contrast, the film closest to the SIT exhibits a maximum in . At the higher doping levels, becomes independent of frustration and decreases with doping. The difference between the activation energies at the two frustrations, , is larger for the film closer to the SIT. For both films, goes to zero, nearly linearly, at higher doping levels.
We break the discussion of the primary experimental results shown in Figs. 2b and d into two parts focusing first on the low doping regime where depends on frustration. This frustration dependence indicates that Cooper pairs are the dominant charge carriers Hollen et al. (2014) in this regime. In both films I and II, , which is consistent with all of the activation energy models discussed above. Introducing frustration reduces the average or or Cooper pair tunneling rate. This reduction increases the mobility gapGangopadhyay et al. (2013) or reduces the Cooper pair screening of the Coulomb blockade energy to increase Fazio and Schön (1991); Beloborodov et al. (2007).
On the other hand, ’s decrease with doping for three cases (film I at f=0 and f=1/2, and film II at f=1/2) opposes simple expectations. Pairbreaking reduces , which should again reduce or to make rise as with frustration. Similarly if the impurities were to randomly transform links into junctionsBulaevskii et al. (1977), their effect would be to reduce or to make rise at large dopingGranato (2017). Thus, these three cases rule out disorder induced localization models in which is the only dependent parameterGangopadhyay et al. (2013). They also rule out Coulomb interaction models in which the charging energy depends only on the geometry of the localized states and the dielectric constant of the intervening insulating materialFistul et al. (2008). Magnetic impurity doping is not expected to influence the electric polarizability of the intervening material. It might influence the geometry by causing the islands to shrink. That effect, however, would increase charging energies and thus, .
A possible explanation for decreasing with pairbreaking is that the charging energy depends directly on . Such a dependence emerges in small single Josephson junctions when the bare charging energy, , which is set by the island geometry and tunnel barrier dielectric constant, greatly exceeds , i.e. Larkin and Ovchinnikov ; Ambegaokar et al. (1982); Chakravarty et al. (1987); Beloborodov et al. (2007). In that limit, virtual inter island tunneling of quasiparticles above the energy gap renormalizes the capacitance of single junctionsAmbegaokar et al. (1982) or effectively screens the Coulomb interactionChakravarty et al. (1987). Beloborodov and coworkersBeloborodov et al. (2007) included this effect in a model of granular films that had been considered previouslyChakravarty et al. (1987) to derive a renormalized charging energy:
| (4) |
where is the dimensionless normal state conductance between grains. With this form for the charging energy, becomes:
| (5) |
for films close enough to the SIT that Cooper pair screening reduces through the Josephson energy term . A rough estimate of for the dots that form in films on AAO suggests that this model applies here. The dots have characteristic diameters below nm, which gives K for a dielectric constant of 10, which greatly exceeds .
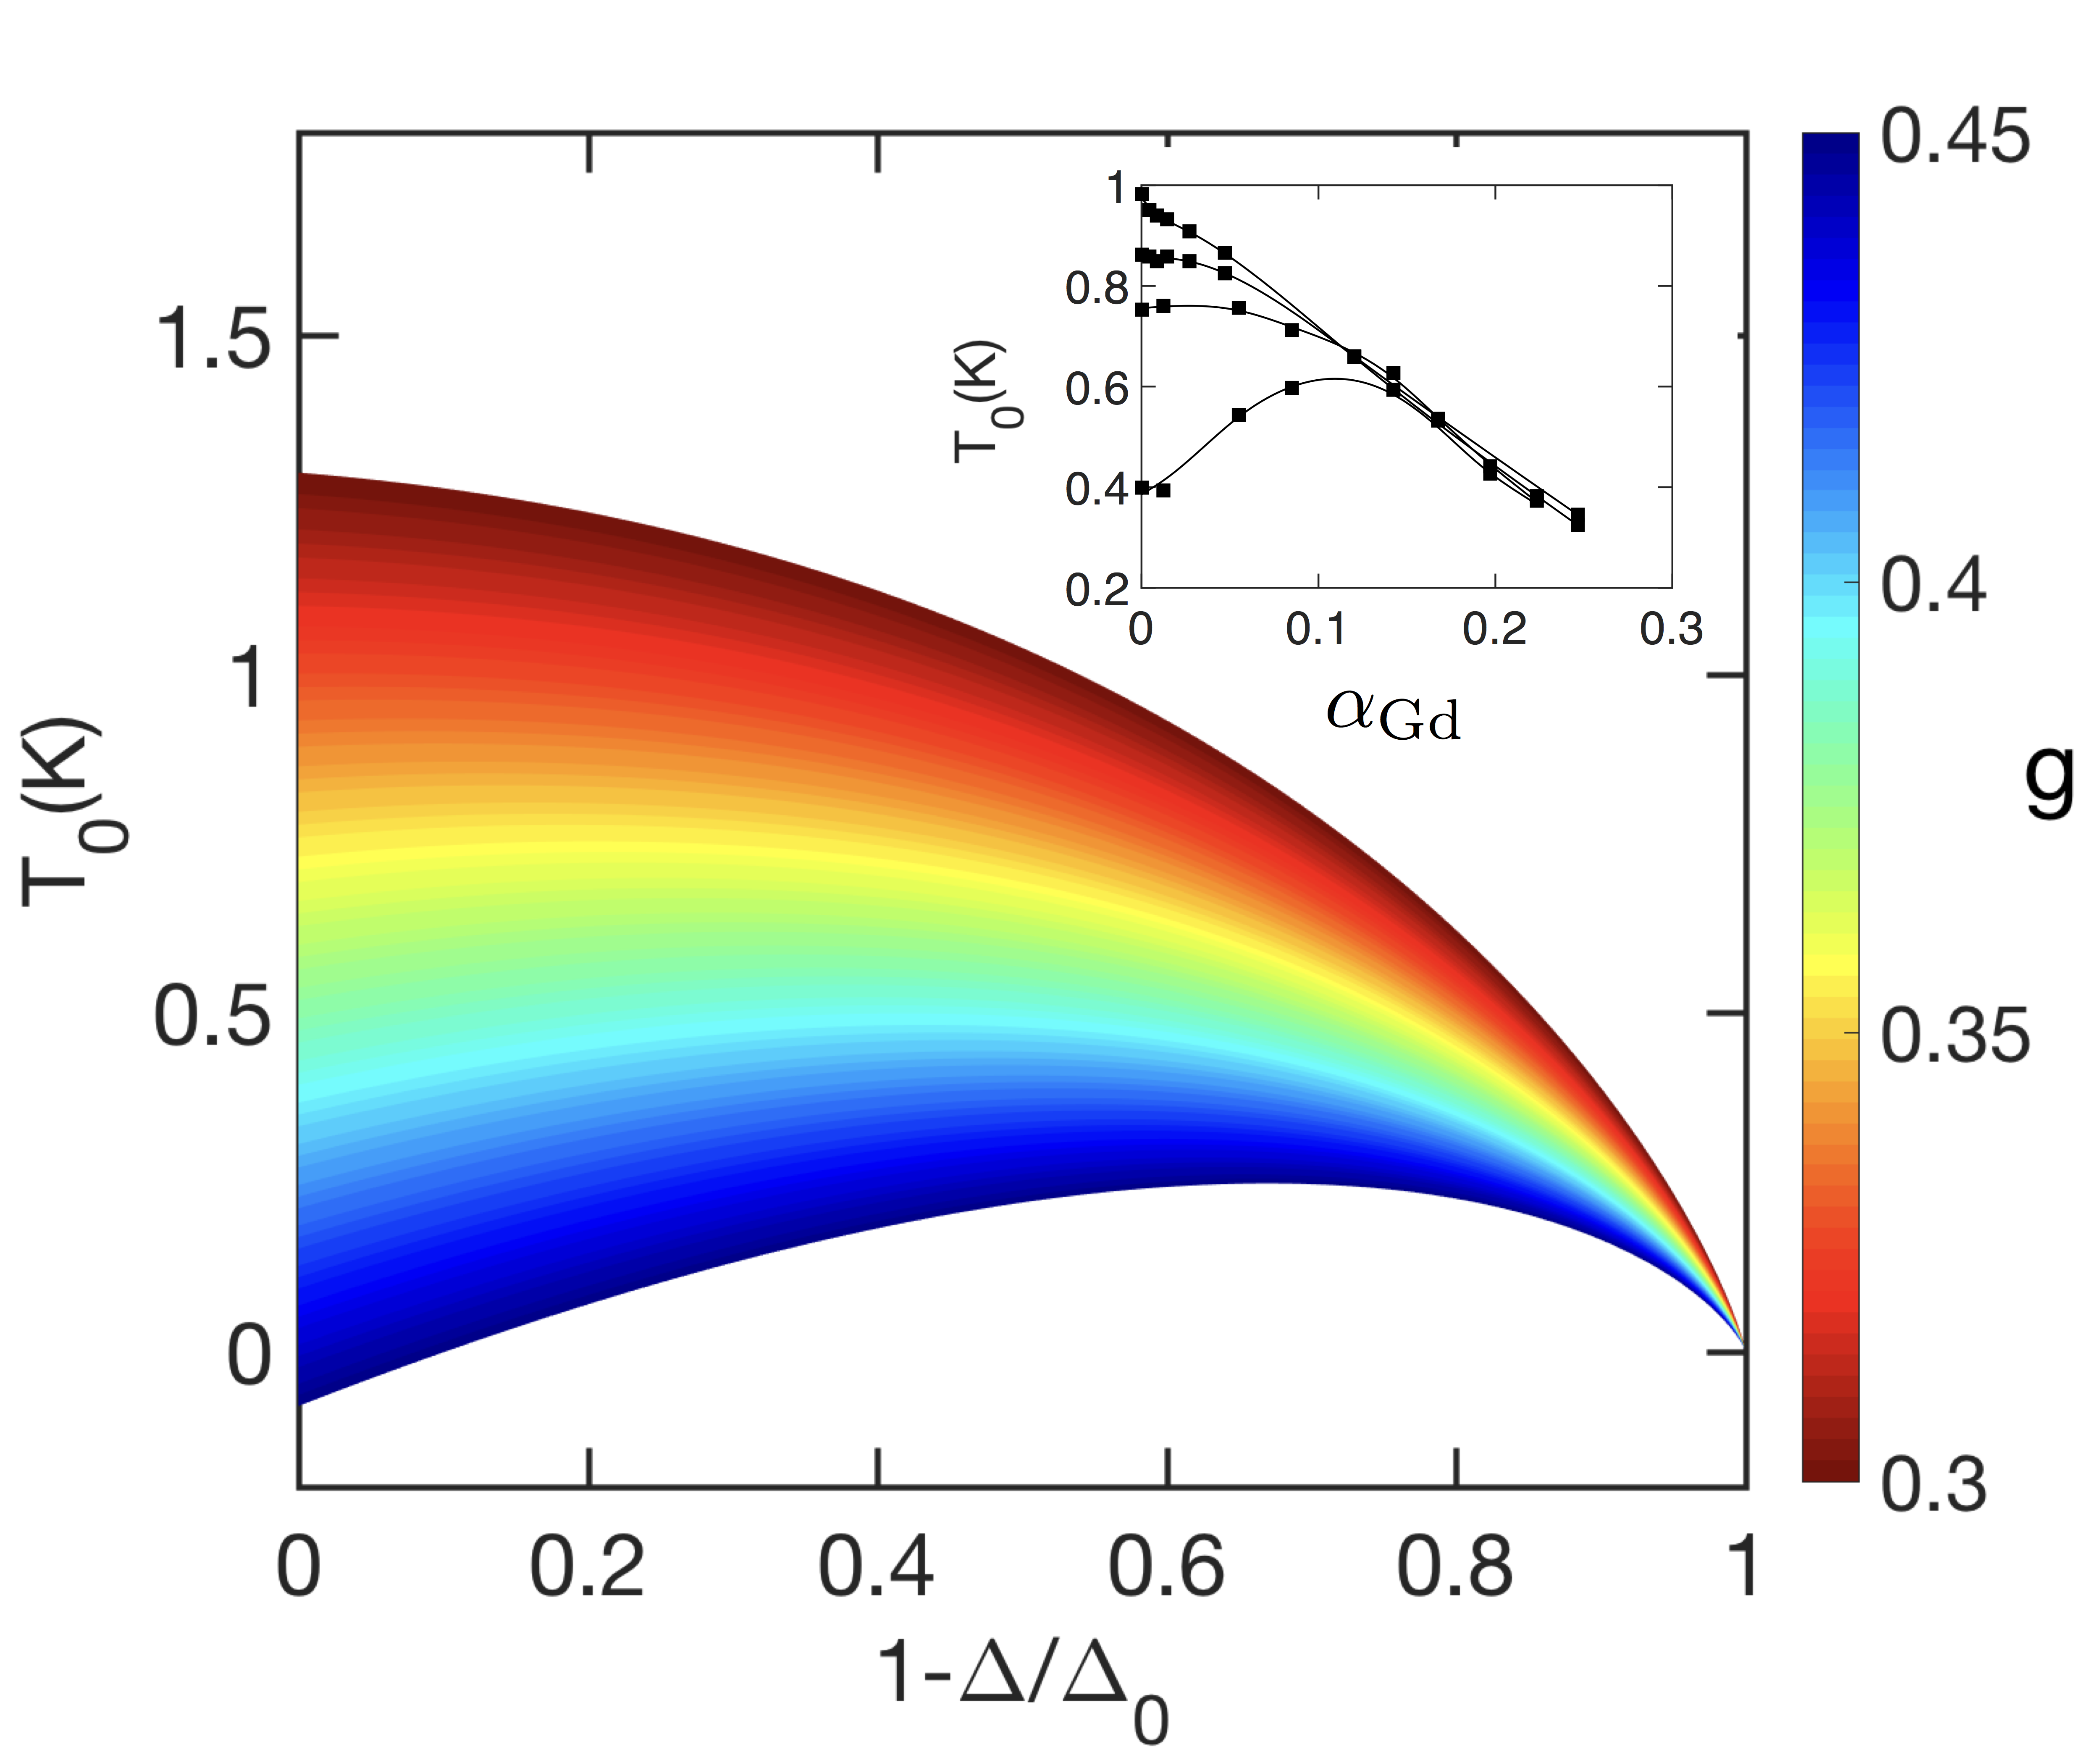
Model predictions embodied in Eq. 5 qualitatively capture the experimental results in the low doping regime. Fig. 3 displays contours of at fixed or distance from the SIT critical point as a function of where is the zero doping energy gap. The contours were calculated using parameter values, K, , K and with varying from 0.3 to 0.45, that fell in a plausible range for these AAO films. At lower , farther from the SIT decreases monotonically with . At higher , closer to the SIT, develops a maximum. These trends qualitatively resemble the observed trends in the data as a function of and distance from the SIT critical point (see inset of Fig. 3).This agreement goes a long way toward establishing this superconductor to insulator transition as a Mott transition. The screening effect differentiates it from the Mott transition that occurs in micro-fabricated Josephson Junction Arrays for which there is little quasiparticle screening because Delsing et al. (1994). Similarly, it differs from cold atom system Mott transitions because those bosons cannot decompose into constituent partsGreiner et al. (2002).
A vexing question has been why does Cooper pair insulator transport appear simply activated in disordered films? The disorder suggests that variable range hopping models, which produce a fractional power (e.g. 1/2) in the activation energy exponentBeloborodov et al. (2007), should apply. The fractional power appears when electrons must hop between localized states that are randomly distributed in energy and space. The granular model for transport with quasi-particle screening embodied by the activation energy in Eq. (5) suggests that the distribution of energy levels is more uniform in the CPI phase. If the grains or dots that serve as the localization sites are large enough that assumes a nearly constant value across a sample, then the logarithmic dependence on makes the activation energy insensitive to variations in the size of the grains. Thus, the distribution of activation energies can be smaller than one might expect for these disordered systems.
It is also interesting to consider the implications of the present results for the bosonic SITs in high temperature superconducting cupratesBollinger et al. (2011). The nodes in their superconducting density of states will affect the properties of a Cooper pair insulator phase. The availability of low energy states could make the virtual quasiparticle screening even more effective than in s-wave systems, which would tend to reduce their activation energies. It may also alter the power in the exponent that characterizes the activated transport in the same way the penetration depth temperature dependence depends on the structure of the gapHardy et al. (1993).
Finally, the disappearance of ’s frustration dependence at higher doping levels signals a crossover from transport that involves Cooper pairs to quasiparticle dominated transport. The crossover is smooth: the (Figs. 2a,c) maintain an activated form and evolves without any clear discontinuities in its value or slope. The continued decrease of with Gd doping suggests that the quasi-particle transport depends directly on . This dependence can arise if the transport is quasi-particle tunneling between superconducting dots as proposed to explain negative magneto-resistance in granular Pb Barber et al. (2006) and Indium Oxide films Gantmakher et al. (1998). Within this model, the inferred values of at the crossover, presuming , are 0.83 K and 0.6 K for films I and II, respectively. Both of these values fall below the transition temperatures of their associated reference films, which makes them reasonable.
To summarize, we investigated the influence of magnetic impurity doping, magnetic frustration, and sheet resistance on the transport of the Cooper pair insulator phase in amorphous Bi films on AAO substrates. The response of the transport activation energy, , to changes in these variables is consistent with it being proportional to , the energy binding the Cooper pairs. This dependence agrees with a modelBeloborodov et al. (2007) in which virtual quasi-particle tunneling processes screen the Coulomb interactions that impede boson tunneling transport while ruling out a number of othersDubi et al. (2006); Fistul et al. (2008); Bouadim et al. (2011); Gangopadhyay et al. (2013); Loh et al. (2016). The observations distinguish the Cooper pair insulator phase that develops in disordered s-wave films from that in micro-fabricated Josephson Junction arraysDelsing et al. (1994) and the bose insulator phase in cold atom systemsGreiner et al. (2002) in which virtual quasiparticle processes exert negligible influence.
Acknowledgements
We are grateful to S. Kivelson, N. Trivedi, M. Mueller, and especially, I. Beloborodov and E. Granato for helpful discussions. This work was partially supported by NSF Grant Nos. DMR-1307290 and DMR-1408743 and the AFOSR.
References
- Laughlin (1983) R. B. Laughlin, Physical Review Letters 50, 1395 (1983), arXiv:1111.4781 .
- Boebinger et al. (1987) G. Boebinger, H. Stormer, and D. Tsui, Physical Review B 36 (1987).
- Girvin et al. (1985) S. Girvin, A. MacDonald, and P. Platzman, Physical Review Letters 54, 581 (1985).
- Tinkham (1996) M. Tinkham, The McGraw-Hill Companies, Inc. (1996).
- Sambandamurthy et al. (2004) G. Sambandamurthy, L. W. Engel, A. Johansson, and D. Shahar, Physical Review Letters 92, 107005 (2004), arXiv:0307648 [cond-mat] .
- Baturina et al. (2008) T. I. Baturina, A. Y. Mironov, V. M. Vinokur, M. R. Baklanov, and C. Strunk, Jetp Letters 88, 752 (2008), arXiv:0810.4351 .
- Lin et al. (2014) Y.-H. H. Lin, J. Nelson, and A. M. Goldman, Physica C-Superconductivity and Its Applications 497, 102 (2014).
- Stewart et al. (2007) M. D. Stewart, A. Yin, J. M. Xu, and J. M. Valles, Science 318, 1273 (2007).
- Bouadim et al. (2011) K. Bouadim, Y. L. Loh, M. Randeria, and N. Trivedi, Nature Physics 7, 884 (2011).
- Gangopadhyay et al. (2013) A. Gangopadhyay, V. Galitski, and M. Mueller, Physical Review Letters 111 (2013), 10.1103/PhysRevLett.111.026801.
- Loh et al. (2016) Y. L. Loh, M. Randeria, N. Trivedi, C. C. Chang, and R. Scalettar, Physical Review X 6, 1 (2016), arXiv:1507.05641 .
- Dubi et al. (2006) Y. Dubi, Y. Meir, and Y. Avishai, Physical Review B 73 (2006), 054509 10.1103/PhysRevB.73.054509.
- Beloborodov et al. (2007) I. S. Beloborodov, A. V. Lopatin, V. M. Vinokur, and K. B. Efetov, Reviews of Modern Physics 79, 469 (2007), arXiv:0603522 [cond-mat] .
- Fistul et al. (2008) M. V. Fistul, V. M. Vinokur, and T. I. Baturina, Physical Review Letters 100, 086805 (2008).
- Baturina et al. (2007) T. I. Baturina, C. Strunk, M. R. Baklanov, and A. Satta, Physical Review Letters 98, 127003 (2007).
- Nguyen et al. (2009) H. Q. Nguyen, S. M. Hollen, M. D. Stewart, J. Shainline, A. Yin, J. M. Xu, and J. M. Valles, Physical Review Letters 103, 1 (2009), arXiv:arXiv:0907.4120v2 .
- Steiner and Kapitulnik (2005) M. Steiner and A. Kapitulnik, Physica C-Superconductivity and Its Applications 422, 16 (2005).
- Efetov (1980) K. B. Efetov, Sov. Phys. JETP 51, 1015 (1980).
- Cha and Girvin (1994) M. C. Cha and S. M. Girvin, Physical Review B 49, 9794 (1994).
- Syzranov et al. (2009) S. V. Syzranov, K. B. Efetov, and B. L. Altshuler, Physical Review Letters 103, 127001 (2009).
- Feigel’man et al. (2010) M. V. Feigel’man, L. B. Ioffe, V. E. Kravtsov, and E. Cuevas, Annals of Physics 325, 1390 (2010), arXiv:1002.0859 .
- Baturina and Vinokur (2013) T. I. Baturina and V. M. Vinokur, Annals of Physics 331, 236 (2013).
- Swanson et al. (2014) M. Swanson, Y. L. Loh, M. Randeria, and N. Trivedi, Physical Review X 4 (2014), ARTN 021007 10.1103/PhysRevX.4.021007.
- Fazio and Schön (1991) R. Fazio and G. Schön, Physical Review B 43, 5307 (1991).
- Hollen et al. (2011) S. M. Hollen, H. Q. Nguyen, E. Rudisaile, M. D. Stewart, J. Shainline, J. M. Xu, and J. M. Valles, Physical Review B 84, 064528 (2011).
- Valles et al. (1989) J. M. Valles, A. E. White, K. T. Short, R. C. Dynes, J. P. Garno, A. F. J. Levi, M. Anzlowar, and K. Baldwin, Physical Review B 39, 11599 (1989).
- Finkelstein (1994) A. M. Finkelstein, Physica B-Condensed Matter 197, 636 (1994).
- Valles Jr. Dynes, R.C., and Garno, J.P. (1992) J. M. Valles Jr. Dynes, R.C., and Garno, J.P., Phys. Rev. Lett. 69, 3567 (1992).
- Hollen et al. (2013) S. M. Hollen, G. E. Fernandes, J. M. Xu, and J. M. Valles, Physical Review B - Condensed Matter and Materials Physics 87, 11 (2013), arXiv:1301.6155 .
- Muller (2013) M. Muller, Epl 102 (2013), Artn 67008 10.1209/0295-5075/102/67008.
- Granato (2016) E. Granato, European Physical Journal B 89, 1 (2016), arXiv:arXiv:1602.04509v1 .
- Parker et al. (2006) J. S. Parker, D. E. Read, A. Kumar, and P. Xiong, Europhysics Letters 75, 950 (2006).
- Chervenak and Valles (1995) J. A. Chervenak and J. M. Valles, Physical Review B 51, 11977 (1995).
- Granato (2018) E. Granato, Physica B: Condensed Matter 536, 442 (2018).
- Hollen et al. (2014) S. M. Hollen, G. E. Fernandes, J. M. Xu, and J. M. Valles, Physical Review B 90 (2014), ARTN 140506 10.1103/PhysRevB.90.140506.
- Bulaevskii et al. (1977) L. N. Bulaevskii, V. V. Kuzii, and A. A. Sobyanin, “Superconducting system with weak coupling to the current in the ground state,” (1977).
- Granato (2017) E. Granato, Physical Review B 96, 1 (2017).
- (38) A. I. Larkin and Y. N. Ovchinnikov, .
- Ambegaokar et al. (1982) V. Ambegaokar, U. Eckern, and G. Sch??n, Physical Review Letters 48, 1745 (1982).
- Chakravarty et al. (1987) S. Chakravarty, S. Kivelson, G. T. Zimanyi, and B. I. Halperin, Physical Review B 35, 7256 (1987).
- Delsing et al. (1994) P. Delsing, C. D. Chen, D. B. Haviland, Y. Harada, and T. Claeson, Physical Review B 50, 3959 (1994).
- Greiner et al. (2002) M. Greiner, O. Mandel, T. Esslinger, T. W. Hänsch, and I. Bloch, Nature 415, 39 (2002).
- Bollinger et al. (2011) A. T. Bollinger, G. Dubuis, J. Yoon, D. Pavuna, J. Misewich, and I. Bozovic, Nature 472, 458 (2011).
- Hardy et al. (1993) W. N. Hardy, D. a. Bonn, D. C. Morgan, R. Liang, and K. Zhang, Physical review letters 70, 3999 (1993).
- Barber et al. (2006) R. P. Barber, S.-Y. Hsu, J. M. Valles, R. C. Dynes, and R. E. Glover, Physical Review B 73, 134516 (2006).
- Gantmakher et al. (1998) V. F. Gantmakher, M. V. Golubkov, V. T. Dolgopolov, G. E. Tsydynzhapov, and A. A. Shashkin, Jetp Letters 68, 363 (1998).