Swift data hint at a binary Super Massive Black Hole candidate at sub–parsec separation
Abstract
Dual/binary Supermassive Black Hole (SMBH) systems are the inevitable consequence of the current Cold Dark Matter cosmological paradigm. In this context, we discuss here the properties of MCG+11-11-032, a local (z=0.0362) Seyfert 2 galaxy. This source was proposed as a dual AGN candidate on the basis of the presence of double-peaked [OIII] emission lines in its optical spectrum. MCG+11-11-032 is also an X-ray variable source and was observed several times by the Swift X-ray Telescope (XRT) on time scales from days to years. In this work, we analyze the SDSS-DR13 spectrum and find evidence for double-peaked profiles in all the strongest narrow emission lines. We also study the XRT light curve and unveil the presence of an alternating behavior of the intrinsic 0.3-10 keV flux, while the 123-month Swift BAT light curve supports the presence of almost regular peaks and dips almost every 25 months. In addition, the XRT spectrum suggests for the presence of two narrow emission lines with rest-frame energies of E6.16 keV and E6.56 keV. Although by considering only the optical emission lines, different physical mechanisms may be invoked to explain the kinematical properties, the X-ray results are most naturally explained by the presence of a binary SMBH in the center of this source. In particular, we evidence a remarkable agreement between the putative SMBH pair orbital velocity derived from the BAT light curve and the velocity offset derived by the rest–frame between the two X-ray line peaks in the XRT spectrum (i.e. 0.06c).
keywords:
galaxies: active – galaxies: individual: MCG+11-11-032 – X-ray: galaxies1 Introduction
The search for and the characterization of the dual (kpc scale
separation) and binary (pc separation) active supermassive black hole (SMBH, M106 M⊙)
population is a hot topic of current astrophysics, given its relevance to
understand galaxy formation and evolution.
Since it is now clear that the most
massive galaxies should harbor a central SMBH (Kormendy &
Richstone, 1995; Ferrarese &
Ford, 2005), the formation of
dual/binary SMBH systems is the inevitable consequence of the current CDM
cosmological paradigm, in which galaxies grow hierarchically
through minor and major mergers.
The dynamical evolution of dual/binary SMBH systems within the merged galaxy, and
their interaction with the host (via dynamical encounters and feedback
during baryonic accretion onto one or both SMBHs) encode crucial information
about the assembly of galaxy bulges and SMBHs.
In addition to this, if the binary SMBHs eventually
coalesce, they will emit gravitational waves that could be detected with incoming low frequency
gravitational wave experiments (Enoki et al., 2004).
Although dual/binary AGN are a natural outcome of galaxy mergers, the
number of confirmed dual/binary AGN is still too low when compared with
model expectations (e.g., Springel et al., 2005; Hopkins et al., 2005). Indeed, directly observing SMBHs during different merger stages is still a challenging task not only because
of the stringent resolution requirements, but also because of the intrinsic difficulty
in identifying SMBHs. In late merger stages, SMBHs are expected to be
embedded in a large amount of dust and gas and thus strongly obscured and
elusive both in the UV and optical bands. Only a few tens of dual
SMBHs at 10 kpc separation have been confirmed (see McGurk et al., 2015, and
references therein) and only a
few definitive sub-kpc binary SMBHs have been discovered and studied so far
(e.g., Rodriguez et al., 2006; Valtonen
et al., 2008; Boroson &
Lauer, 2009).
The search for double-peaked optical emission lines emerging from two separate narrow-line regions (NLRs) of two SMBHs has been proposed as a method to select dual AGN candidates on kpc/sub-kpc scales (e.g., Wang et al., 2009). The catalogs of Wang et al. (2009), Liu et al. (2010), and Smith et al. (2010) provide about three hundreds of unique candidate dual AGN, selected from the Sloan Digital Sky Survey Data Release 7 (SDSS–DR7, Abazajian et al., 2009) as spectroscopic AGN with a double-peaked [OIII]5008Å line (redshift range between 0.008z0.686). However, the 3" diameter of the SDSS fiber does not discern whether the double-peaked optical emission lines are due to dual kpc-scale nuclei or to kinematical effects occurring within a single AGN, e.g. jet-cloud interactions (Heckman et al., 1984; Gabányi et al., 2017), a rotating, disk-like NLR (Xu & Komossa, 2009), or the combination of a blobby NLR and extinction effects (Crenshaw et al., 2010).
In this paper we present and discuss the optical and X-ray properties of MCG+11-11-032, a radio-quiet optical Seyfert 2 galaxy at z=0.0362. Besides being a dual AGN candidate on the basis of its SDSS–DR7 optical spectrum characterized by double-peaked [OIII] emission lines (Wang et al., 2009), MCG+11-11-032 is also an X-ray variable source (Ballo et al., 2015). It belongs to the all-sky survey Swift-BAT catalogues (Baumgartner et al., 2013; Cusumano et al., 2014) and was observed several times by the Swift X-ray Telescope (XRT; Burrows et al., 2005) on time scales from years to days. In Section 2, after summarizing previous results, we present our new analysis of the SDSS–DR13 spectrum of MCG+11-11-032. The analysis of the XRT light-curve and spectra, along with the 123-month BAT light curve, are presented in Section 3. In Section 4, we combine the optical spectroscopic information with the X-ray results to discuss the most plausible physical scenarios acting in MCG+11-11-032. Section 5 presents our conclusions.
Throughout the paper we assume a flat CDM cosmology with H0=69.6 km s-1 Mpc-1, =0.7 and =0.3. Errors are given at 68 per cent confidence level unless otherwise specified, i.e. Sect. 3.
2 SDSS spectrum
MCG+11-11-032 (SDSS J085512.54+642345.6) belongs to a sample of 87 SDSS–DR7 type 2 AGN with double-peaked [OIII] profiles selected and analyzed by Wang et al. (2009). The obscuration of the active nucleus allowed the authors to determine the redshift of the host galaxy (z=0.03625110-5) through the stellar absorption lines and investigate the properties of the nebular emission lines. They fitted the [OIII] line with a blue-shifted (=-2.520.07 Å) and a red–shifted (=2.260.06 Å) component, neither of which is at the systemic velocity of the host galaxy. The corresponding fluxes and luminosities of the blue-shifted and red-shifted components by Wang et al. (2009) are: =[33811]10-17 erg cm-2 s-1, =1.041040 erg s-1 and =[37211]10-17 erg cm-2 s-1, =1.141040 erg s-1.
Comerford et al. (2012) performed follow–up long-slit observations with the Blue Channel Spectrograph on the MMT 6.5 m telescope. They observed the object at two different position angles (one along the isophotal position angle of the major axis of the host galaxy and the other one along the orthogonal axis) in order to determine the full spatial separation of the two emission line components. They fit two Gaussian components to the continuum subtracted [OIII]5007Å emission line and found a velocity offset between the [OIII]5007Å peaks of =2754 km s-1. They measured the angular and physical projected spatial offset between the two [OIII]5007Å emission features and found 0.770.04 arcsec and 0.550.03 h kpc, respectively, with a PA=61.0∘2.2. By checking the long-slit spectra by eye, Comerford et al. (2012) classified the AGN emission components as spatially "extended", meaning that not all the emission line components appear spatially compact at the position angles observed. No additional information has been provided by the authors about the emission line profiles at each position angle.
| Spectral line | FWHM | Flux | Luminosity | ||||
|---|---|---|---|---|---|---|---|
| [Å] | [km/s] | [Å] | [km/s] | [km/s] | [10-17 erg/cm2s ] | [1039 erg/s] | |
| (1) | (2) | (3) | (4) | (5) | (6) | (7) | (8) |
| Å | 4957.400.23 | 300a | -2.930.33 | -17720 | 30517 | 14011 | 4.30.3 |
| 4962.410.17 | 222b | 2.110.24 | 12815 | 11811 | 3.60.3 | ||
| Å | 5005.750.15 | 30017 | -2.490.21 | -14913 | 28311 | 40224 | 12.30.7 |
| 5010.480.11 | 22211 | 2.240.16 | 1349 | 31739 | 9.70.6 | ||
| Å | 6546.610.19 | 294c | -3.250.27 | -14912 | 27113 | 1428 | 4.40.3 |
| 6552.530.20 | 260d | 2.660.28 | 12213 | 10423 | 3.20.7 | ||
| Å | 6561.890.17 | 294c | -2.700.41 | -12418 | 24811 | 26232 | 8.00.8 |
| 6567.320.16 | 260d | 2.710.26 | 12412 | 21968 | 6.72.3 | ||
| Å | 6582.590.15 | 29410 | -2.680.21 | -12213 | 25910 | 44938 | 13.81.2 |
| 6588.260.15 | 2609 | 2.990.25 | 13611 | 32448 | 9.901.5 | ||
| Å | 6715.770.33 | 30324 | -2.520.47 | -11221 | 25420 | 14715 | 4.50.4 |
| 6721.450.30 | 23321 | 3.160.42 | 14119 | 7712 | 2.40.4 | ||
| Å | 6730.150.32 | 303e | -2.530.45 | -11320 | 25021 | 1479 | 4.50.3 |
| 6735.760.32 | 233f | 3.080.45 | 13720 | 8512 | 2.60.4 |
Notes. Col. (1): Spectral lines (rest–frame vacuum wavelengths). Col. (2): Rest-frame wavelengths of the peaks of the blue and red-shifted emission line components. Col. (3): , not corrected for the instrumental resolution, of the blue and red-shifted emission line components. Col (4): Doppler shifts of the blue and red emission line components. Col. (5): Line of sight velocity offsets of the blue and red-shifted components. Col. (6): Line of sight velocity offset between red and blue peaks. Col. (7)-(8): Fluxes and luminosities, corrected for Galactic extinction, of the blue and red-shifted components.
a fixed to be equal to of the Å blue component. b fixed to be equal to of the Å red component. c fixed to be equal to of the Å blue component. d fixed to be equal to of the Å red component. e fixed to be equal to of the Å blue component. ffixed to be equal to of the Å red component.
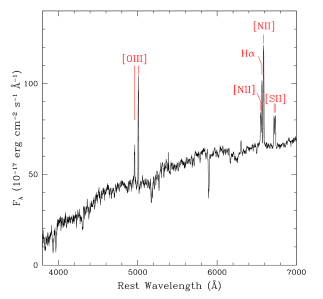
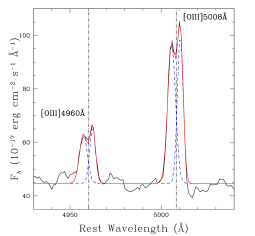
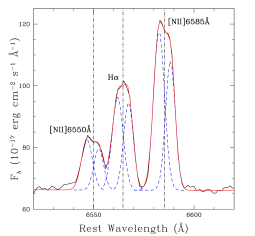
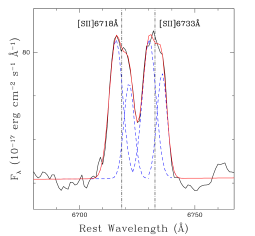
To further investigate the presence of double peaked emission lines, we analyzed the SDSS–DR13 spectrum. We examined the properties of all the prominent emission lines detected in the spectrum (see Fig. 1), instead of considering only the [OIII]5007Å (as it was done by previous authors). To this end, we analyzed the spectral region around the [OIII], H+[NII], and [SII] lines by fitting the rest-frame 4910-5070 Å, 6500-6660 Å and 6660-6715 Å ranges, avoiding the regions where absorption lines are present. We used a combination of a power-law continuum and two Gaussian components for each transition. In this procedure, for each Gaussian component there are three independent parameters that need to be determined: the position of the line peak (), the line broadening () and the normalization of the line (). The central line positions and their relative intensities were set to be all independent. We note, however, that the emission line ratios derived by our fit are in good agreement with the expected theoretical values, e.g. 3:1 for the two [OIII] lines. Since the narrow lines observed in this source should have the same physical origin, i.e. they arise from the NLRs, we performed a first fit in which the widths of all the Gaussian components were forced to have the same value in units of km s-1. However, since for forbidden transitions larger critical electron densities for de-excitation (i.e. Nec[OIII]Nec[NII]Nec[SII], see Osterbrock 1991) can broaden the line profile, we left the line widths to be independent between the three different spectral ranges considered here. Each emission line resulted to be well fitted by two narrow Gaussian components. In particular, for the two [OIII]5007Å lines our results are in good agreement with Wang et al. (2009) and Comerford et al. (2012) in terms of peak offsets and line fluxes. As a second and final step, we re-fitted the data by allowing the widths of the bluer Gaussian components to be independent with respect to the red ones. The results of this second fit are shown in Fig. 2 and reported in Table 1 together with 1 statistical errors. The addition of a third Gaussian to account for a possible component at the systemic velocity is not requested by the fit. We note that outflows/jets in integrated galaxy spectra, where the individual outflowing clouds are not resolved by the observations, tend to appear in the form of fainter – and broader – possibly asymmetric emission line components superimposed on the narrow emission line centered at the systemic velocity (e.g. Harrison et al., 2014; Harrison et al., 2016). The lack of such typical outflow components does not support the presence of strong ionized outflows or jets detectable in the SDSS13 spectrum. The absence of a strong radio jet is also in agreement with the non detection of MCG+11-11-032 down to about 0.5 mJy (3rms) at 1.4 Ghz in the VLA FIRST survey (Becker et al., 1995). However, we note that, although strong radio jets can be ruled out, the presence of faint jets cannot be discarded with the available optical and radio data.
All the results reported here were obtained by combining a power-law continuum plus narrow Gaussian components, and we have verified that they are not dependent (within the 1 uncertainties) on the stellar continuum subtraction.
In summary, the value reported in Table 1 are in agreement with the results obtained by Wang et al. (2009) and Comerford et al. (2012) for the [OIII] line. In addition, we confirm the presence of double-peaked profiles in all the optical nebular emission lines detected in the MCG+11-11-032 SDSS–DR13 spectrum. The widths of all the blue and red components are consistent, within 3 uncertainties, with each other across the full spectral range, though the width of the red components is systematically smaller. We found a significant (more than 3) offsets between the blue and red peaks with respect to the systemic redshift. This implies that none of these components is consistent with the nominal systemic velocity of the host galaxy (derived from the stellar absorption lines). Finally, the offset ratios (/) of the two components of H, [NII], and [SII] are consistent with that of [OIII], and they are of the order of one, i.e. the wavelength shifts and the corresponding velocity offsets between the blue and red peaks are similar for all the nebular emission lines.
Following statistical argument originally proposed by Wang et al. (2009), these results can be explained by the presence of two distinct NLRs that, on the basis of their projected physical separation estimated by Comerford et al. (2012) (0.550.03 h kpc), may be related to two different AGN. The extended structures detected by the same authors could be produced by either gas kinematics in the two NLRs or faint outflows/jets associated to one or both SMBHs.
We note, however, that the line properties reported in Table 1 as well as the presence of spatially extended components can be also explained by alternative physical scenarios. Firstly, as quoted before, the presence of a single SMBH associated with faint jet activity can not be excluded based on the available optical and radio data. Secondly, the velocity offsets reported in Table 1 are fully consistent with rotation velocities measured in nearby galaxies (see e.g. Sofue & Rubin, 2001). This implies that the double-peaked emission lines observed for MCG+11-11-032 could be produced by gas kinematics related to a single NLR (see e.g. Blecha et al., 2013; Fu et al., 2012), partially or totally tracing the kinematics of the almost edge-on (b/a=0.45 by Koss et al., 2011) host galaxy disk at sub-kpc scale. Another intriguing possibility, corroborated by the X-ray data presented in the next Section, is that we are observing gas kinematics effects produced by a single NLR ionized by two SMBHs near to the coalescence phase, i.e. a sub-pc scale SMBH pair (see Section 4).
3 X-ray data
| Obs. ID | Obs. Start date | Net Counts | Net Exp. Time |
|---|---|---|---|
| (1) | (2) | (3) | (4) |
| Archival data | |||
| 00038045001 | 2008-11-20 | 54 | 4957 |
| 00038045002 | 2009-01-28 | 135 | 5022 |
| 00090163002 | 2009-09-06 | 42 | 5594 |
| 00084954001 | 2015-01-23 | 12 | 457 |
| 00084954002 | 2015-02-02 | 16 | 622 |
| 00084954005 | 2015-03-24 | 9 | 1249 |
| Our own monitoring | |||
| 00034134001 | 2015-12-14 | 94 | 3236 |
| 00034134002 | 2015-12-15 | 106 | 4430 |
| 00034134003 | 2015-12-15 | 126 | 7317 |
| 00034134004 | 2015-12-19 | 34 | 899 |
| 00034134005 | 2015-12-19 | 460 | 15890 |
| 00034134006 | 2015-12-24 | 230 | 8346 |
| 00034134007 | 2015-12-25 | 352 | 11050 |
| 00034134008 | 2015-12-29 | 187 | 8129 |
| 00034134009 | 2015-12-30 | 161 | 5866 |
| 00034134010 | 2016-01-10 | 272 | 7337 |
| 00034134011 | 2016-01-12 | 182 | 7280 |
| 00034134012 | 2016-01-13 | 26 | 942 |
| 00034134013 | 2016-01-14 | 51 | 2527 |
| 00034134014 | 2016-01-14 | 265 | 16810 |
| 00034134015 | 2016-01-19 | 65 | 3326 |
| 00034134016 | 2016-01-20 | 225 | 8259 |
| 00034134017 | 2016-01-21 | 23 | 1096 |
| 00034134018 | 2016-01-22 | 21 | 1056 |
| 00034134019 | 2016-01-24 | 107 | 6171 |
| 00034134020 | 2016-01-27 | 17 | 942 |
| 00034134021 | 2016-01-28 | 218 | 10340 |
| 00034134022 | 2016-01-29 | 263 | 15400 |
| 00034134024 | 2016-02-03 | 99 | 3906 |
| 00034134025 | 2016-02-03 | 101 | 3591 |
| 00034134026 | 2016-02-05 | 338 | 11530 |
| Archival data | |||
| 00080403001 | 2016-02-18 | 60 | 1826 |
Notes. Col. (1): XRT observational ID. (2) Start date of the observation. (3) [0.3-10 keV] net counts as derived by X-ray spectral analysis. (4) Nominal exposure time in unit of second.
We monitored MCG+11-11-032 with the Swift-XRT telescope as part of a project aiming at studying the X-ray variability on different time scales (Ballo et al., 2015). The observations, performed during the Swift Cycle-12 (P. I. Severgnini), started on 2015 December 14 and ended on 2016 February 5, covering 54 days, for a total exposure time of 166 ks. The data were taken using XRT in the standard PC-mode (Target ID=00034134). The observation log is reported in Table 2; we note that the observations scheduled during the segment 00034134023 were not completed, explaining the absence of this latter in the observation log. A further archival observation (Target ID=00080403), was performed just after our own monitoring and it was considered in our analysis. Before our daily monitoring, MCG+11-11-032 was observed different times by Swift on month/year time scales. The relevant information about the previous XRT observations in which the source was detected with a S/N3 in the 0.3-10 keV range is reported in the first part of Table 2 (Target ID=00038045, 00090163 and 00084954).
For each observation, we extracted the images, light curves, and spectra, including the background and ancillary response files, using the on-line XRT data product generator111http://www.swift.ac.uk/user_objects (Evans et al., 2007, 2009). The effects of the damage to the CCD and automatic readout-mode switching were handled and the appropriate spectral response files were identified in the calibration database. The source appears to be point-like in the XRT image and we do not find any significant evidence of pile-up.
3.1 XRT light curve
We first investigated the source variability behavior from year/month to day timescales. We compared the results obtained by our own monitoring program, probing variations on relatively short timescales (day-weeks), with archival data, which allow us to explore longer timescales (up to several years, see Table 2).
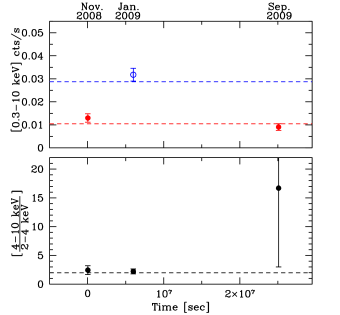
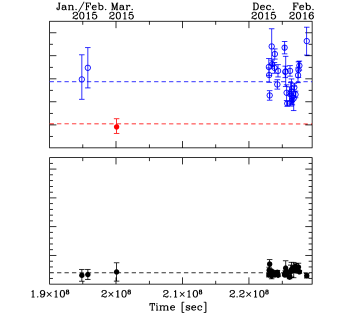
Figure 3 shows the 0.3-10 keV XRT light curve (upper panels) and the hardness ratio light curve (bottom panels) of MCG+11-11-032. This latter is defined as the ratio between the 4-10 keV and the 2-4 keV count rates; as showed in Ballo et al. (2015), this ratio provides a strong indication of the amount of absorption. Indeed, while below 2 keV different soft components (soft excess, reflection, scattering, etc) can be present, in the 2–10 keV range, the spectrum of an AGN can be approximated, at the first order, by an absorbed power law.
The data are binned per observation, and we considered all the observations listed in Table 2. Our daily monitoring data correspond to the data-points crammed in to the rightmost part of the figure. The overall pattern of the count rate light curve is not constant at the 99.99 per cent confidence level ( test). In particular, on month/year timescales the source was caught in two significantly different count rate levels: the higher one (blue empty symbols, Fig. 3, upper panels), characterized by a weighted average count rate of 0.03 cts s-1 (marked with a blue dashed line), and the lower one (red filled symbols, Fig. 3, upper panels), characterized by a weighted average count rate of 0.01 cts s-1 (marked with a red dashed line). The top-left panel of Fig. 3 clearly shows that the source significantly increases its count rate level in two months, and after about seven months the source has the same lower count rate value of the first observation. A similar but opposite trend was observed about seven years later (top right panel of Fig. 3): the source decreases its count rate level in two months and, after about nine months, the source has already increased again its count rate to the higher state. Unfortunately, the lack of an uniform sampling across the full period prevents us from further investigating this “alternating" behavior. The two states shown in Fig. 3 are, most probably, the states where the source spends the majority of its time.
The overall pattern of variability observed in the full 0.3–10 keV band, and shown in the upper panels of Fig. 3, is similar to that registered in the 2-4 keV and 4-10 keV energy ranges. Indeed, the hard-to-soft flux ratio, plotted in the bottom panels of Fig. 3, does not show significant variations (3, test), except from the third observation in the left panel (Sep. 2009). The lack of significant variation in the count rate ratio suggests that the observed count rate variability is not caused by variable absorption but it is most likely due to intrinsic flux variations (see also Sect. 3.3).
3.2 BAT light curve
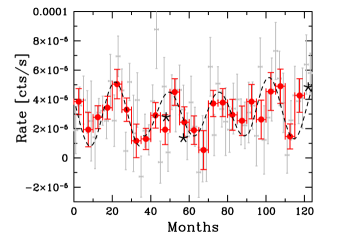
To further investigate the month/year variability behavior shown by the XRT data, we considered the (still unreleased) MCG+11-11-032 123-month 15-150 keV BAT light curve (see Fig. 4; Palermo Swift-BAT team, private communication; see also Segreto et al., 2010), which provides a tight sampling of the source count rate on a total time scale of more than ten years. In Fig. 4 we show the light curve binned in periods of two (grey data points) and five (red filled circles) months. The 15-150 keV emission is clearly variable; a constant flux is rejected at 99.95 per cent confidence level ( test). The curve has a modular behavior with different peaks and dips occurring almost every 25 months. For visual purposes only, we over-plotted on Fig. 4 a modular function obtained by summing four sinusoidal components with equal period but different amplitudes (dashed black curve).
In order to compare the XRT and BAT variability, we binned the XRT light curve in periods of five months and then converted the XRT to BAT count rates222We considered the XRT data obtained during the123-months of BAT observation and we convert them to BAT count rates by using the PIMMS tool (v. 4.8f) and considering the spectral parameters (, NH) derived by our own spectral analysis reported in Sec. 3.3. (skeletal symbols in Fig. 4). We found a good agreement between the two datasets.
3.3 XRT spectral analysis
| Model | NH | R | E | EW | F2-10keV | L2-10keV | ||
| [ cm-2] | [keV] | [eV] | [10-12 erg cm-2 s-1] | [1043 erg s-1] | ||||
| (1) | (2) | (3) | (4) | (5) | (6) | (7) | (8) | (9) |
| 1 | 1.29 | 11.0 | 133 / 75 | 4.39 | 2.15 | |||
| 2 | 1.61 | 13.5 | 0.09 | 95 / 74 | 4.32 | 2.09 | ||
| 3 | 1.64 | 13.3 | 0.09 | 6.18 | 120 | 83 / 72 | 4.27 | 2.05 |
| 4 | 1.68 | 13.3 | 0.09 | 6.16 | 120 | 79 / 70 | 4.24 | 2.05 |
| 6.56 | 85 |
Notes: Col. (1): Model number as referenced in the text (see Sect. 3.3). Col. (2): Power-law and reflection component photon index. Col. (3): Intrinsic column density. Col. (4): Reflection fraction, defined as the ratio between the 2-10 keV flux of the reflected and direct continuum components. Col. (5): Rest-frame energy centroid of the Gaussian line. Col. (6): Emission line equivalent width. Col. (7): and number of degrees of freedom. Col. (8): Observed flux (de-absorbed by Galactic absorption) in the 2-10 keV energy band. Col. (9): Intrinsic (i.e. absorption-corrected) luminosity in the 2-10 keV energy band.
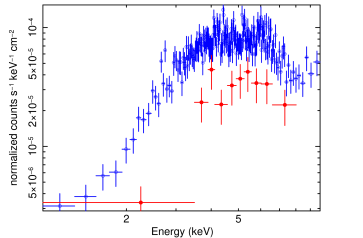
As already discussed in Sect. 3.1, by considering the XRT count rate ratios (see Fig. 3, lower panel), no evidence of spectral variability is observed between the two states. To further test this result, we produced two different spectra on the basis of the 0.3-10 keV light curve: we co-added all the data relevant to the blue and red points showed in the upper panels of Fig. 3 to obtain source and background spectra of the high and low-flux states, respectively. The resulting spectra are compared in Fig. 5. Due to the different statistical quality of the two spectra, the high-state spectrum (4170 net counts) has been binned in order to have at least 50 counts per energy channel, while the low-state one (100 net counts) has been binned in order to have at least 10 counts per energy channel. As evident from Fig. 5, the two states have very similar spectral shapes as already suggested by the X-ray colours. Therefore, we can rule out variable absorption to be at the origin of the observed flux variability. In the following, we will focus on the higher state and higher statistics spectrum. The spectral analysis is performed by using the XSPEC 12.8.2 package (Arnaud, 1996). We use the statistics in the search for the best fit model and for parameter errors determination (Avni, 1976); quoted statistical errors are at the 90 per cent confidence level for one parameter of interest.
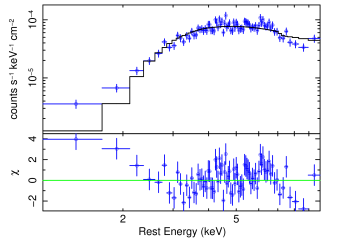
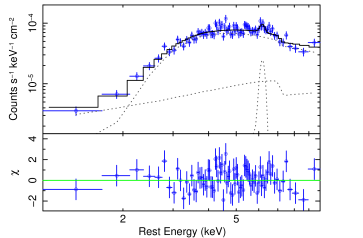
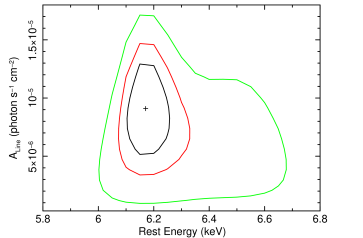
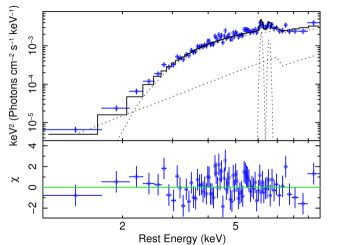
Each model discussed below includes a Galactic column density NHGal=4.71020 cm-2 (Kalberla et al., 2005), modeled with tbabs in XSPEC (Wilms et al., 2000). Since the shape of the spectra in Fig. 5 suggests the presence of obscuration, as a starting point we adopted a single intrinsically absorbed power-law model (ztbabs*zpow model in XSPEC, model 1, Table 3). As shown in Fig. 6, such model cannot be considered a good representation of the global spectral properties of the source leaving evident residuals over the full energy range. In particular, both the softer (below 2 keV) and the harder (above 6 keV) residuals suggest the presence of a non-negligible additional component tracing reflection, most probably due to the circum-nuclear material. We added to the fit first a continuum reflection component (pexrav model in XSPEC, Magdziarz & Zdziarski (1995), model 2, Table 3) and then a narrow (50 eV) Gaussian emission line component around 6.4 keV to account for a Fe K emission component (zgauss model in XSPEC, model 3, Table 3). Both components are statistically required and their addition significantly improves the fit. The spectrum and the residuals corresponding to the final best-fitting model (model 3, Table 3) are shown in Fig. 7, upper and lower panels, respectively. We note that the best-fit value of the rest-frame energy (6.18 keV) of the narrow emission line does not have a clear association with well-known and expected transitions. The difference with respect to the neutral rest-frame Fe emission line at 6.4 keV is significant at 97 per cent confidence level for one parameter of interest. Fig. 8 shows the confidence contour plot of the joint errors of the rest-frame emission line energy versus its intrinsic normalization. This figure indicates that a rest-frame energy of 6.18 keV is favored by the model, although also a 6.4 keV value, i.e. the rest-frame Fe K line, cannot be excluded at 3. The shape of the 99 per cent contour level hints also another possibility: the presence of a second emission line at energy higher than 6.4 keV. For this reason, even if it is not required by the fit with the present statistics, we add a second narrow emission line to the model leaving its energy free to vary in 6-7 keV energy range (model 4, Table 3). The best fit values obtained for the rest-frame energies of the two emission lines are: E1=6.160.08 keV (EW120 eV, Fline1810-14 erg s-1 cm-2) and E2=6.560.15 keV (EW85 eV, Fline2610-14 erg s-1 cm-2). As expected, due to the statistics of our data, the energy of the second line is poorly constrained. All the continuum parameters are unaffected with respect to those obtained by adopting model 3 (see Table 3). For completeness, we report in Fig. 9 the spectrum and the ratio between data and this last best-fitting model.
As a final step, we check if the two putative X-ray emission lines could be associated with the double-horn of a relativistic Fe K emission line produced in the accretion disk, i.e. inside the absorbing medium intercepted along the line of sight (NH=1.331023 cm-2, see Table 3). To this end, the two zgauss components are replaced with an absorbed laor (Laor, 1991) disk line plus a pexrav component in XSPEC. These represent the iron emission line plus continuum components reflected by the accretion disk and absorbed by the outer medium along the line of sight. We find that the symmetric double peaked profile observed for MCG+11-11-032 (both in terms of and emission line fluxes) can be reproduced by this model only by assuming that a significant fraction of the line flux comes from a Keplerian disk at 200-400 RG from the central engine. In the case of a single ionizing source, such range corresponds to the outer part of an accretion disk or to the region where optical broad emission lines are typically produced, i.e. the so called Broad Line Regions (BLR). As we will discuss in the next Section, the distance quoted above matches well also the inner radius expected for a circumbinary accretion disk for the presence of two sub-parsec scale SMBHs. All the possible different scenarios will be discussed in the next section.
4 Summary and Discussion
Our analysis of the SDSS–DR13 optical spectrum of MCG+11-11-032 (see Sect. 2) confirms the presence of double-peaked profiles in all the strongest nebular emission lines, particularly for the [OIII] lines. Emission line components at the systemic velocity of the host galaxy and/or broad wings have not been detected. The velocity offsets between the blue and red narrow peaks are similar for all the emission line components and the separation line ratios (/) are consistent with one. Although these properties make MCG+11-11-032 a good dual AGN candidate (Wang et al., 2009), alternative and equally valuable physical scenarios could account for the optical double-peaked narrow emission line components observed in this source, such as faint outflows/jets or gas kinematics within a single NLR.
Interestingly, besides being characterized by double-peaked narrow emission lines in the optical spectrum, MCG+11-11-032 also belongs to the all-sky survey Swift-BAT catalogues and was monitored several times with Swift-XRT (see Section 3). Our analysis of the XRT light curve shows that MCG+11-11-032 clearly alternates between two main flux states on a time scale of several months. Unfortunately, the XRT light curve data are not uniform and they are inadequate to unveil a possible periodic behavior; they only suggest that, if a modular behavior is present, it must have a period equal or larger than about one year. To further investigate the X-ray variability pattern of MCG+11-11-032, we considered the still unreleased 123-month 15-150 keV BAT light curve, which provides a tight sampling of the source count rate on a total time scale of more than ten years. The light curve is clearly variable and shows a modular behavior with different peaks and dips occurring almost every 25 months. The XRT data analysis (count rate ratio and low and high state spectrum comparison) suggests that the observed X-ray variability is most likely caused by intrinsic flux variations rather than to a change of obscuration along the line of sight.
Our spectral analysis of the higher state shows that the XRT spectrum of MCG+11-11-032 is well fitted by an absorbed power-law plus a reflection component. While the continuum is reminiscent of a typical Seyfert 2 galaxy, we did not detect any neutral Fe K emission line at the expected 6.4 keV rest-frame energy. Although this would not make MCG+11-11-032 an outlier, what makes it more interesting is the possible presence of two emission lines at rest-frame energies of: E1=6.160.08 keV and E2=6.560.15 keV. While the 6.56 keV emission can be considered only a tentative detection (2 significance), we note that the 6.2 keV line is detected at high significance (more than 3) and is not consistent with the rest-frame Fe K energy of 6.4 keV at the 97 per cent confidence level.
4.1 A binary SMBH at the center of MCG+11-11-032
Although the results presented here need to be confirmed by higher quality X-ray data, the putative modular X-ray variability combined with the possible presence of two Doppler-shifted iron emission lines opens a further interesting possibility for MCG+11-11-032: the presence of two sub-pc scale SMBHs in the core of the source. As a matter of fact, modular variations of the intrinsic flux in AGN constitutes an almost unique observational evidence for the presence of a binary SMBH at sub-parsec scale (Charisi et al., 2018, and references therein). Numerous hydrodynamical simulation show that the large amount of dense gas in the central region of galaxies hosting sub-parsec scale binary systems can form a circumbinary accretion disk with an inner radius lower than two times the binary separation. The circumbinary disk accretion mass rate is expected to be modulated by the orbital period of the two SMBHs, hence naturally producing modulated X-ray variations (D’Orazio et al., 2013; Gold et al., 2014; Farris et al., 2014). Alternatively, modular variability in the presence of a SMBH pair could be caused by relativistic Doppler-boosts of the emission produced in mini-disks bounded to individual SMBHs (D’Orazio et al., 2015). In this case the emission of the brighter mini-disk will be periodically Doppler-boosted, and the observed time-scale of the modulated X-ray emission would correspond, also in this case, to the orbital period of the two SMBHs. As for MCG+11-11-032, by considering a total SMBH mass of log(M/M⊙)=8.70.3 (derived from the CO velocity dispersion, see Lamperti et al., 2017)333The SMBH mass for MCG+11-11-032, ID #434 in the online-only extended Table 8 of Lamperti et al. (2017), has been derived from the velocity dispersion of the CO line. See the relevant paper for more details., under the hypothesis of a SMBH pair, the observed modular time-scale (i.e. about 25 months) would imply a sub-pc separation between the two SMBHs, with an orbital velocity of a few per cent of the speed of light (0.06c). In spite of the statistical significance of the X-ray results presented here, what makes the sub-pc SMBH pair a valuable hypothesis in the case of MCG+11-11-032 is the complete agreement between the orbital velocity derived from the BAT light curve and the velocity offset derived by the rest–frame between the two X-ray line peaks in the XRT spectra data (i.e. of order of 3-10 per cent the speed of light, with a best fit value of about 0.06c). Interestingly, as discussed in the previous section, the two X-ray emission lines may be either reproduced by rotational effects of a Keplerian disk at distance well consistent with the putative circumbinary disk (200-400 RG) or by two different gas structures bounded to individual SMBHs.
At these small separations, binary SMBHs may stall for a significant fraction of the Hubble time (see e.g. Colpi, 2014), much higher of the typical galaxy merger time-scale (see e.g. Boylan-Kolchin et al., 2008; Hopkins et al., 2010). In these systems optical narrow lines would come from a much larger zone enveloping the binary system (Begelman et al., 1980) by tracing the velocity of the post-merger galaxy. Under the binary hypothesis, the double-peaked emission lines observed in MCG+11-11-032 could be thus explained by gas kinematics related to a NLR moving at the velocity of the almost edge-on host galaxy disk at sub-kpc scale.
4.2 Alternative scenarios
Alternative physical scenarios proposed on the basis of the optical data alone (see Section 2) would unlikely explain both the optical and the X-ray properties of this source. In particular, the presence of two SMBHs at larger scale (e.g. sub-kpc distance) would be at odd with the distance and velocity derived by the X-ray data. Similarly, although the presence of a precessing outflow/jet would explain the presence of optical and X-ray double-peaked lines, this hypothesis remains unlikely on the basis of the expected precession period for a jet with a single SMBH of mass of 108 M⊙, i.e. 102.2-106.5 years (see Lu & Zhou, 2005). On the other hand, shorter periods are possible for jet precession related to a SMBH binary system (Graham et al., 2015, and reference therein). The optical double-peaked profiles could be caused by almost edge-on NLR disk gas kinematics ionized by a single SMBH, where the X-ray emission lines may be produced by the outer parts of a co-planar accretion disk. In this case, modular X-ray behavior could be justified by the presence of a warped accretion disk which modulates the intrinsic luminosity as it precesses (Graham et al., 2015). However, even under this hypothesis, the precession time-scale of a self-gravitating warped disk around a single SMBH of mass of order of 108 M⊙ is much larger (50 yr) than the putative modular time scale observed for MCG+11-11-032 (see Tremaine & Davis, 2014).
5 Conclusions
Although higher quality X–ray data are mandatory to confirm and better characterize the observed X-ray emission lines and to confirm the X-ray modular behavior, the results presented here make MCG+11-11-032 a promising binary SMBH candidate. Due to the stringent spatial resolution requirements, confirming the presence of a sub–parsec binary SMBH is significantly challenging both with present, i.e. the Hubble Space Telescope, and future new generation telescopes, i.e. the European Extremely Large Telescope and the James Webb Space Telescope. However, these new upcoming facilities will significantly improve our statistics on the binary/dual SMBH population thus providing the data for a detailed study of this class of objects and of the multi-wavelength properties of their host galaxies. In addition, future spatially–resolved spectral observations could confirm the origin of the double peaked optical emission lines, and the location of their emitting regions with respect to the central nucleus hosting one or possibly two SMBHs.
Although the interpretation proposed here is admittedly in part speculative, this paper clearly shows the high capability of X-ray data in unveiling SMBH pair candidates also in obscured sources. In particular, the still on going Swift-BAT all–sky monitoring will allow us to investigate the hard X-ray light curve of MCG+11-11-032 on even longer time scales and to definitively confirm its periodic-like behavior. Higher quality X-ray spectra are also necessary to better characterize the observed X-ray emission lines and thus confirm on more solid ground the scenario proposed here. MCG+11-11-032 is an intriguing source as it could be the first case in which X-ray data unveil the presence of a sub-parsec binary SMBH on the basis of a double-peaked Fe K emission line. We note that, such kind of profiles will be easily detected with the advent of the X-ray calorimeters such the one developed for XARM and Athena.
Acknowledgements
We thank the anonymous referee for the useful and constructive comments which improved the quality of the paper. CC acknowledges funding from the European Union’s Horizon 2020 research and innovation programme under the Marie Sklodowska-Curie grant No 664931. PS thanks P. Saracco, M. Dotti and A. Wolter for the useful discussions and helpful suggestions. This work is based on data supplied by the UK Swift Science Data Centre at the University of Leicester. We made use of the Palermo BAT Catalogue and database operated at INAF - IASF Palermo. The SDSS is managed by the Astrophysical Research Consortium for the Participating Institutions of the SDSS Collaboration (see http://www.sdss.org/collaboration/citing-sdss/).
References
- Abazajian et al. (2009) Abazajian K. N., et al., 2009, ApJS, 182, 543
- Arnaud (1996) Arnaud K. A., 1996, in Jacoby G. H., Barnes J., eds, Astronomical Society of the Pacific Conference Series Vol. 101, Astronomical Data Analysis Software and Systems V. p. 17
- Avni (1976) Avni Y., 1976, ApJ, 210, 642
- Ballo et al. (2015) Ballo L., et al., 2015, preprint, (arXiv:1505.02593)
- Baumgartner et al. (2013) Baumgartner W. H., Tueller J., Markwardt C. B., Skinner G. K., Barthelmy S., Mushotzky R. F., Evans P. A., Gehrels N., 2013, ApJS, 207, 19
- Becker et al. (1995) Becker R. H., White R. L., Helfand D. J., 1995, ApJ, 450, 559
- Begelman et al. (1980) Begelman M. C., Blandford R. D., Rees M. J., 1980, Nature, 287, 307
- Blecha et al. (2013) Blecha L., Loeb A., Narayan R., 2013, MNRAS, 429, 2594
- Boroson & Lauer (2009) Boroson T. A., Lauer T. R., 2009, Nature, 458, 53
- Boylan-Kolchin et al. (2008) Boylan-Kolchin M., Ma C.-P., Quataert E., 2008, MNRAS, 383, 93
- Burrows et al. (2005) Burrows D. N., et al., 2005, Space Sci. Rev., 120, 165
- Charisi et al. (2018) Charisi M., Haiman Z., Schiminovich D., D’Orazio D. J., 2018, MNRAS, 476, 4617
- Colpi (2014) Colpi M., 2014, Space Sci. Rev., 183, 189
- Comerford et al. (2012) Comerford J. M., Gerke B. F., Stern D., Cooper M. C., Weiner B. J., Newman J. A., Madsen K., Barrows R. S., 2012, ApJ, 753, 42
- Crenshaw et al. (2010) Crenshaw D. M., Schmitt H. R., Kraemer S. B., Mushotzky R. F., Dunn J. P., 2010, ApJ, 708, 419
- Cusumano et al. (2014) Cusumano G., Segreto A., La Parola V., Maselli A., 2014, in Proceedings of Swift: 10 Years of Discovery (SWIFT 10), held 2-5 December 2014 at La Sapienza University, Rome, Italy. Online at http://pos.sissa.it/cgi-bin/reader/conf.cgi?confid=233, id.132. p. 132
- D’Orazio et al. (2013) D’Orazio D. J., Haiman Z., MacFadyen A., 2013, MNRAS, 436, 2997
- D’Orazio et al. (2015) D’Orazio D. J., Haiman Z., Schiminovich D., 2015, Nature, 525, 351
- Enoki et al. (2004) Enoki M., Inoue K. T., Nagashima M., Sugiyama N., 2004, ApJ, 615, 19
- Evans et al. (2007) Evans P. A., et al., 2007, A&A, 469, 379
- Evans et al. (2009) Evans P. A., et al., 2009, MNRAS, 397, 1177
- Farris et al. (2014) Farris B. D., Duffell P., MacFadyen A. I., Haiman Z., 2014, ApJ, 783, 134
- Ferrarese & Ford (2005) Ferrarese L., Ford H., 2005, Space Sci. Rev., 116, 523
- Fu et al. (2012) Fu H., Yan L., Myers A. D., Stockton A., Djorgovski S. G., Aldering G., Rich J. A., 2012, ApJ, 745, 67
- Gabányi et al. (2017) Gabányi K. É., Frey S., Paragi Z., An T., Komossa S., 2017, preprint, (arXiv:1701.04572)
- Gold et al. (2014) Gold R., Paschalidis V., Etienne Z. B., Shapiro S. L., Pfeiffer H. P., 2014, Phys. Rev. D, 89, 064060
- Graham et al. (2015) Graham M. J., et al., 2015, Nature, 518, 74
- Harrison et al. (2014) Harrison C. M., Alexander D. M., Mullaney J. R., Swinbank A. M., 2014, MNRAS, 441, 3306
- Harrison et al. (2016) Harrison C. M., et al., 2016, MNRAS, 456, 1195
- Heckman et al. (1984) Heckman T. M., Miley G. K., Green R. F., 1984, ApJ, 281, 525
- Hopkins et al. (2005) Hopkins P. F., Hernquist L., Martini P., Cox T. J., Robertson B., Di Matteo T., Springel V., 2005, ApJ, 625, L71
- Hopkins et al. (2010) Hopkins P. F., et al., 2010, ApJ, 724, 915
- Kalberla et al. (2005) Kalberla P. M. W., Burton W. B., Hartmann D., Arnal E. M., Bajaja E., Morras R., Pöppel W. G. L., 2005, A&A, 440, 775
- Kormendy & Richstone (1995) Kormendy J., Richstone D., 1995, ARA&A, 33, 581
- Koss et al. (2011) Koss M., Mushotzky R., Veilleux S., Winter L. M., Baumgartner W., Tueller J., Gehrels N., Valencic L., 2011, ApJ, 739, 57
- Lamperti et al. (2017) Lamperti I., et al., 2017, MNRAS, 467, 540
- Laor (1991) Laor A., 1991, ApJ, 376, 90
- Liu et al. (2010) Liu X., Shen Y., Strauss M. A., Greene J. E., 2010, ApJ, 708, 427
- Lu & Zhou (2005) Lu J.-F., Zhou B.-Y., 2005, ApJ, 635, L17
- Magdziarz & Zdziarski (1995) Magdziarz P., Zdziarski A. A., 1995, MNRAS, 273, 837
- McGurk et al. (2015) McGurk R. C., Max C. E., Medling A. M., Shields G. A., Comerford J. M., 2015, ApJ, 811, 14
- Osterbrock (1991) Osterbrock D. E., 1991, Reports on Progress in Physics, 54, 579
- Rodriguez et al. (2006) Rodriguez C., Taylor G. B., Zavala R. T., Peck A. B., Pollack L. K., Romani R. W., 2006, ApJ, 646, 49
- Segreto et al. (2010) Segreto A., Cusumano G., Ferrigno C., La Parola V., Mangano V., Mineo T., Romano P., 2010, A&A, 510, A47
- Smith et al. (2010) Smith K. L., Shields G. A., Bonning E. W., McMullen C. C., Rosario D. J., Salviander S., 2010, ApJ, 716, 866
- Sofue & Rubin (2001) Sofue Y., Rubin V., 2001, ARA&A, 39, 137
- Springel et al. (2005) Springel V., Di Matteo T., Hernquist L., 2005, MNRAS, 361, 776
- Tremaine & Davis (2014) Tremaine S., Davis S. W., 2014, MNRAS, 441, 1408
- Valtonen et al. (2008) Valtonen M. J., et al., 2008, Nature, 452, 851
- Wang et al. (2009) Wang J.-M., Chen Y.-M., Hu C., Mao W.-M., Zhang S., Bian W.-H., 2009, ApJ, 707, L107
- Wilms et al. (2000) Wilms J., Allen A., McCray R., 2000, ApJ, 542, 914
- Xu & Komossa (2009) Xu D., Komossa S., 2009, ApJ, 705, L20