The Dawn Light of Blueberry Galaxies: Spectroscopic and Photometric Studies of two Starburst Dwarf Galaxies
Abstract
A population of so-called “blueberry” starbursting dwarf galaxies with extremely blue colors, low-metallicities, and enormous ionization ratios, has recently been found by Yang et al. (2017). Yet we still do not know their detailed properties, such as morphologies, AGN occupations, massive star contents, infrared emission, dust properties, etc. As a pilot study of the blueberries, we investigate the spectroscopic and photometric properties of two blueberry candidates, RGG B and RGG 5, for which Hubble Space Telescope high-resolution images are available. We find that RGG B and RGG 5 perhaps are likely to be two merging dwarf galaxy systems. RGG B may have a close merging companion; yet the current evidence still cannot exclude the possibility that RGG B is just disturbed by in-situ star formation through, e.g., outflows, rather than undergoing a merger. RGG 5 presents stellar shells in the outskirt which can be the powerful evidence of galaxy merging. We also find that, all of the blueberries, including RGG B and RGG 5, are located close to the theoretical maximum-starburst-line in the BPT diagram, have very high ionization parameters, and relatively low hardness ionizing radiation fields, exhibit nitrogen overabundances, and show extremely red mid-IR colors, and reside in the so-called “ULIRGs/LINERs/Obscured AGN” region. The blueberry galaxies may not harbor AGN.
keywords:
galaxies: dwarf — galaxies: photometry — galaxies: emission lines — galaxies: starburst — galaxies: star formation1 Introduction
According to the different photometry and spectroscopy properties, dwarf galaxies can be classified as many intriguing sub-samples, e.g., the blue compact dwarf galaxies (BCDs; e.g., Zwicky & Zwicky, 1971; Thuan & Martin, 1981; Gil de Paz et al., 2003), ultra-compact dwarfs (e.g., Drinkwater et al., 2000; Corbin et al., 2006), H ii galaxies (e.g., Terlevich et al., 1981; Melnick et al., 2017), extreme metal-poor galaxies (e.g., Guseva et al., 2017; Sánchez Almeida et al., 2016), ultra-diffuse galaxies (e.g., van Dokkum et al., 2015; Rong et al., 2017a), dwarfs purportedly lacking dark matter (van Dokkum et al., 2018), suggesting an intricate and complex multitude of dwarf galaxy evolution senarios.
In the census of the SDSS low-redshift () galaxies, a population of galaxies with low-masses (), low-metallicities (), and extremely blue colors (i.e. mag and mag), has recently been classified as ‘blueberry’ galaxies (Yang et al., 2017, hereafter Y17). Their extremely blue colors are attributed to the strong [O iii]λ5007 emission lines with equivalent widths of EW([O iii]λ5007) Å. These blueberries are starburst dwarf galaxies with very small sizes ( kpc), high specific star-formation rates (sSFRs), and enormous ionization ratios ([O iii]/[O ii] ). The properties of blueberries are similar to those of the typical green peas, Ly galaxies, or genuine H ii regions, though their stellar masses are only 1%-10% of green peas and Ly galaxies (e.g., Finkelstein, et al., 2009), and might constitute the best local analogs of the lowest-mass starbursts at high redshifts, soon to be observed with JWST (e.g., Renzini, 2017).
In their SDSS images, several Y17 blueberry galaxies are not a precise point-spread-function (PSF), but present somewhat diffuse outskirts (see Fig. 2 of Y17). For instance, the galaxies with the numbers of Y17-07, 27, 31, 39, 54, and 70 in the Y17 catalog reveal tails/streams in their halo regions; Y17-10 shows a spiral-arm feature; Y17-67, 12, and 06 present the diffuse envelopes/halos. These may be the evidence of undergoing galaxy mergers. Note, the unresolved SDSS images and spectra of the blueberries prevent us to study their morphologies, compositions, dynamics, and properties of star-forming regions in detail.
One tempting question is whether blueberry galaxies contain central active galactic nuclei (AGN). Although the Y17 blueberry galaxies are classified as BPT star-forming galaxies (Baldwin et al., 1981), they are located at the upper-left region of the star-forming sample, very close to the seperation between AGN and star-forming galaxies. The BPT selection may be ineffective for low-metallicity galaxies located in this parameter region (Groves et al., 2006; Stasińska et al., 2006).
Studying the mid-infrared (mid-IR) colors of the blueberries with the ALLWISE catalog (Wright et al., 2010), we find that all of the blueberries are very red, probably suggesting these starburst galaxies are dust obscured. Indeed, the ultraviolet (UV) radiation from the O- and B-type stars in very young star-forming regions can heat the surrounding dust and contribute significantly to the spectral energy distribution (SED) from the mid-IR to far-infrared (FIR) wavelengths. Cormier et al. (2015) investigated the Herschel PACS spectroscopy of low-metallicity dwarf galaxies, and found that the interstellar medium in these galaxies is more porous than in metal-rich galaxies, leading to a larger fraction of the stellar UV radiation heating the dust. These results are supported by modeling of Hirashita & Hunt (2004), who explored that both the dust temperature and luminosity are higher in dense, compact, low-metallicity star-forming regions.
Another senario is that the blueberry objects may be newly-born star clusters, just like the “open clusters” formed in H ii regions (e.g., Dias et al., 2002; Balser et al., 2011; Longmore et al., 2014). For instance, the BCD, Mrk 930, reveals a very young cluster population with 70% of the systems formed less than 10 Myr ago (Adamo et al., 2011b). The edges of the young star clusters are places for triggered (Elmegreen, 1998) and progressive star formation (e.g., Carlson et al., 2007; Walborn et al., 2002). Delayed or triggered star formation processes in dense and dusty regions surrounding the blue clusters could explain a large fraction of massive young stars contributing to the mid-IR spectrum of a cluster a few Myr old. Moreover, the [O iii]/H ratio is known as a tracer of the mean ionization level and temperature of the photoionized gas (Baldwin et al. 1981); the high [O iii]/H ratios of the blueberries () may be an indication of the young star clusters (Adamo et al., 2011b).
So far, we still do not know the possible origins and detailed morphologies of the blueberries, since for the Y17 blueberries, there are no high-resolution images. This work is a pilot study of blueberry galaxies, and we will investigate the properties of two new blueberry candidates which have high spatial-resolution images, RGG B and RGG 5, identified in the dwarf catalog of Reines et al. (2013). The former shows broad H emission but narrow-line ratios consistent with the photoionization from H ii regions (Pustilnik et al., 2004; Reines et al., 2013), and presents a weak Wolf-Rayet (WR) blue bump. The latter does not show any broad-line emission or WR bump. Therefore, the two dwarfs may stand for two different cases of blueberry galaxies. The Hubble Space Telescope (HST) Wide-Field Camera 3 (WFC3) UVIS/IR observations provide high spatial-resolution images to study the compositions and local environments of the two galaxies.
In Section 2, we will study the spectroscopic and photometric properties of the two galaxies, and clarify that the two dwarf galaxies are blueberry candidates and have the similar properties to the Y17 blueberry sample galaxies. In Section 3, we compare the two galaxies and discuss some key properties of the two blueberry candidates, in order to unveil some general properties of blueberries. We summarize our work in Section 4. Throughout this letter, we use “dex” to mean the anti-logarithm, i.e. 0.1 dex==1.258, and use to mean the decadic logarithm, i.e. .
2 The blueberry galaxies: RGG B and RGG 5
In this section, we study two dwarf galaxies identified from the catalog of Reines et al. (2013), RGG B (SDSS J0840+4707) and RGG 5 (SDSS J0823+0313). The two targets are the two bluest galaxies in the dwarf catalog of Reines et al. (2013), which have Hubble Space Telescope high-resolution images; we serendipitously find the two extremely blue dwarfs when we try to study the AGN existence in the local dwarf galaxies with the catalog of Reines et al. (2013). In this section, we will clarify that the two selected galaxies indeed are the blueberry candidates, with similar properties to the Y17 blueberries.
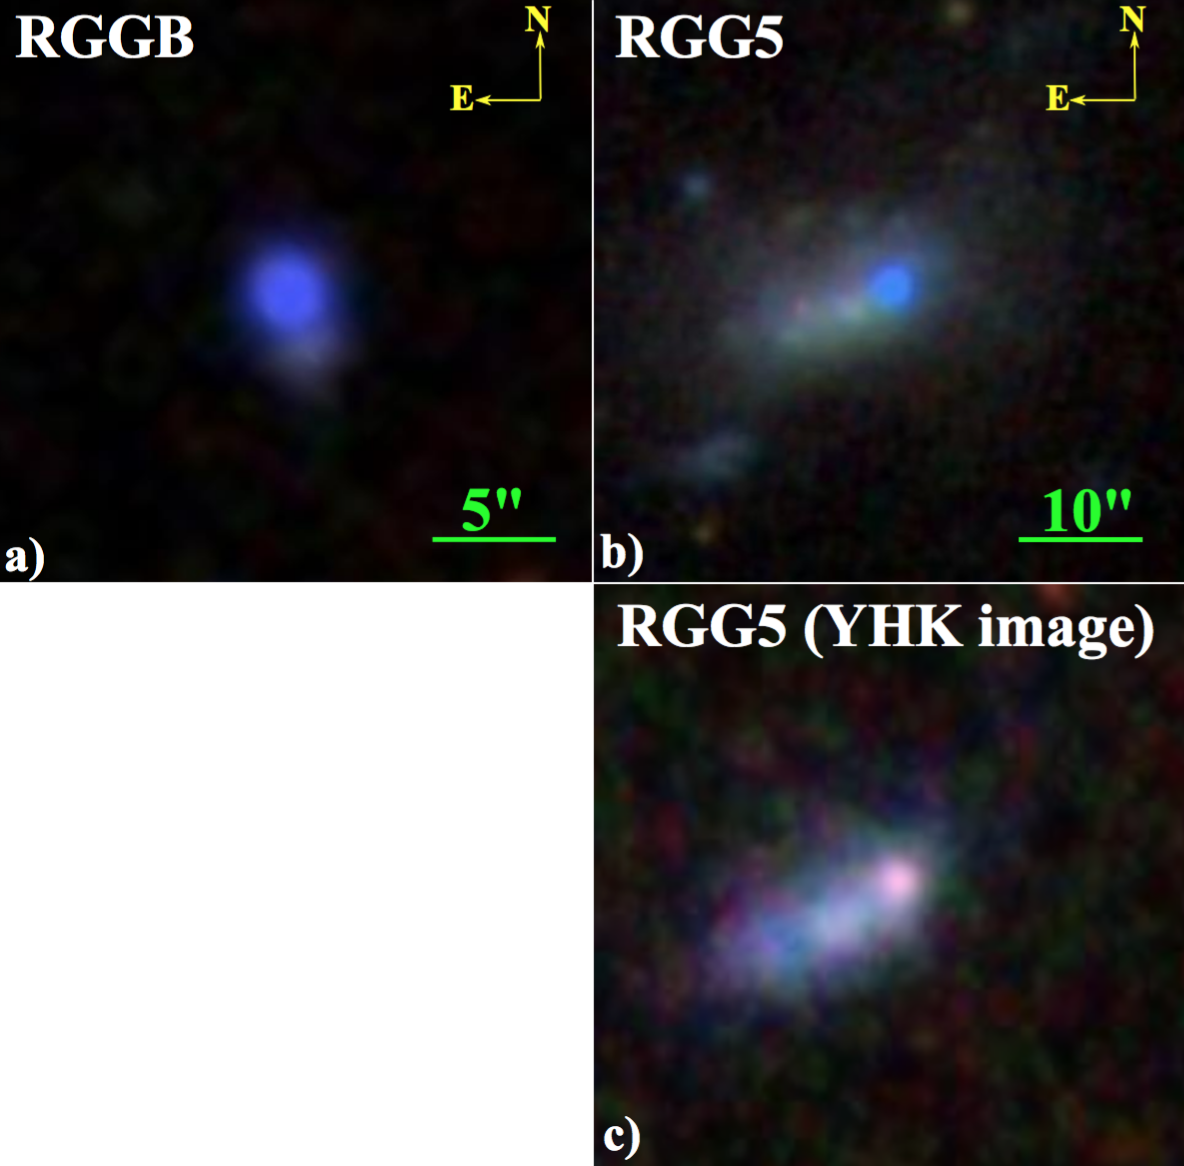
RGG B, as shown in panel a) of Fig. 1, is a BCD at the redshift ( Mpc; Izotov et al., 2007), located at RA(J2000) = 08h40m29.9s, DEC(J2000) = , with a low metallicity of (Pérez-Montero et al., 2011). The colors of RGG B from the SDSS photometry cModel magnitudes (before foreground extinction correction) are mag, mag, mag, and mag, respectively. RGG B satisfies the color selection criteria of blueberry galaxies in Y17. It was not selected in the conservative sample of Y17, because of the presence of a tail on the south-west in the SDSS image (as shown in Fig. 1), which is slightly beyond the photometric flags (artificial flags; see also the Appendix selection criteria in Y17 for details) of selecting blueberries in Y17. However, it is worth noting that, several Y17 blueberry galaxies, e.g., Y17-27, 31, 39, 54, and 70, also present a tail/stream on the edges of galaxies (see Fig. 2 of Y17 for details).
Another blue galaxy, RGG 5, located at coordinates RA(J2000) = 08h23m34.8s and DEC(J2000) = , at a redshift ( Mpc) and is much brighter ( mag) than the average brightness of the Y17 blueberries. RGG 5 was not selected in the Y17 sample, because of both the existence of an extended halo region as shown in panel b) of Fig. 1, and because the color (calculated from the SDSS PSF magnitudes) mag is slightly beyond the selection criterion of blueberries, i.e., mag. However, some Y17 blueberries, e.g., Y17-67 and 6, also show a faint halo component. Note that RGG 5 has much lower redshift compared with the Y17 blueberries, and thus its faint outskirts may not be detectable if we shift its redshift to .
Their SDSS spectra are shown in Fig. 2. Here we will compare the spectroscopic properties of the two blueberry candidates with those of the Y17 blueberries.
2.1 Star Formation Properties
First, we compare the spectroscopic properties of RGG B and RGG 5 with those of the Y17 blueberries. We calculate the star formation rates (SFRs) of RGG B and RGG 5 from the H luminosities (Kennicutt, 1998), SFR/yr and SFR/yr. Note that the estimated SFR of RGG 5 is a lower-limit since the SDSS fiber only covered its blueberry region (H ii region). Their stellar masses () are obtained from the NASA-Sloan Atlas catalog111http://nsatlas.org/data), and . Therefore, analogous to the properties of Y17 blueberry sample, RGG B and RGG 5 show strong star formation activities and are located beyond the “main-sequence” in the SFR– diagram, compared with most of the SDSS galaxies. The specific SFRs (sSFRs) of the blueberries are broadly similar to those of the higher-redshift starbursts (e.g., Atek et al., 2014; Rodríguez-Muñoz et al., 2015; Elmegreen, 2017) as shown by the magenta symbols in panel A of Fig. 3, implying that the blueberries may be good local analogs of lowest-mass () starbursts at high redshifts.
2.2 Emission Line Properties
The SDSS spectrum of RGG B (upper panel of Fig. 2) shows a very strong [O iii]λ5007 emission line with an equivalent width of EW([O iii]λ5007) Å, and large [O iii]λ5007/H ([O iii]λ5007/H) and an oxygen ionization ratio222In the following, we will refer with the oxygen ionization ratio [O iii]/[O ii] to the line ratio ([O iii]λ4959 + [O iii]λ5007)/[O ii]λ3727. of [O iii]/[O ii] , and reveals broad components in several emission lines including [O iii]λ4363 (Izotov et al., 2007; Reines et al., 2013).
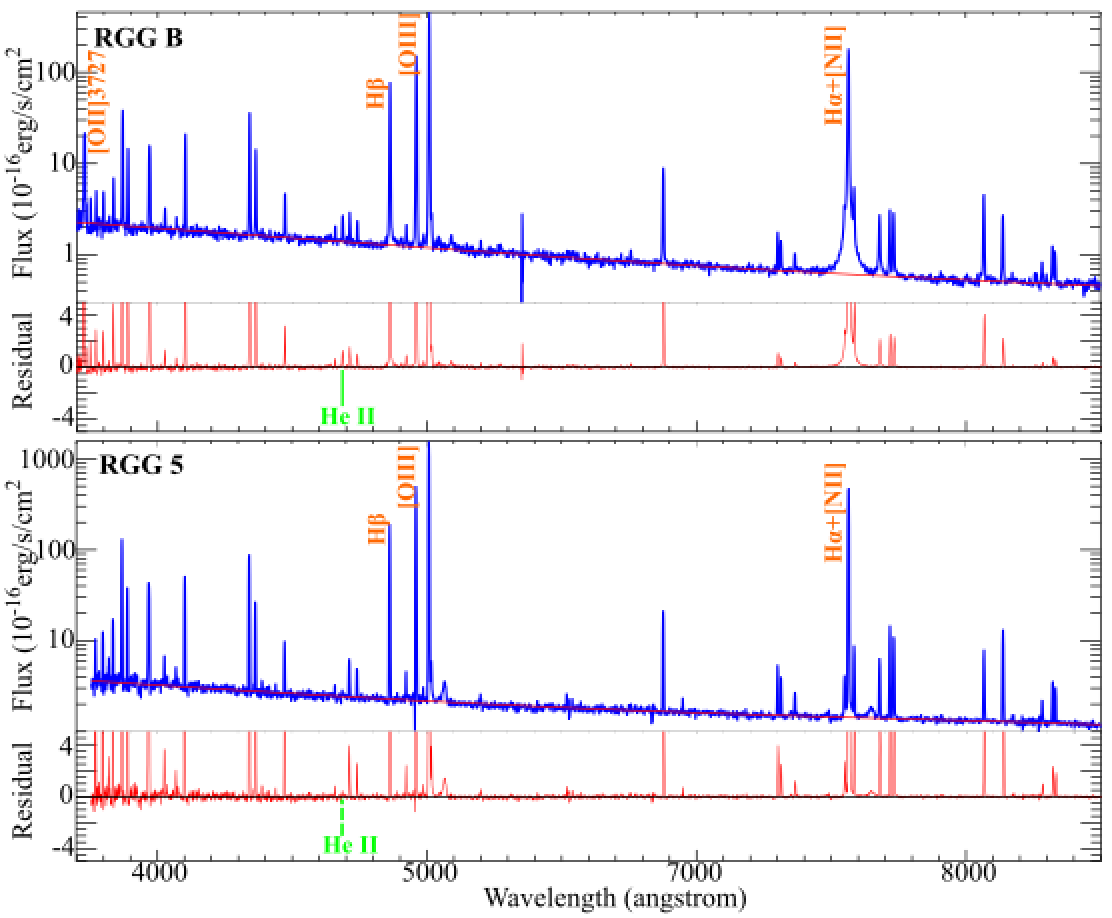
The EW([O iii]λ5007) Å of RGG 5 is also higher than the selection criterion ( Å) of the blueberries in Y17. Here we calculate its oxygen metallicity and [O iii]/[O ii] ratio. Using the [O iii]λ4363, [O iii]λλ4959,5007, and [O ii]λλ7320,7330 fluxes, we can estimate the metallicity of RGG 5 by following the methodology described in Izotov et al. (2006), deriving . RGG 5 has a relatively higher oxygen abundance, compared with the Y17 blueberries (). Since the limited SDSS spectral wavelength-range does not cover the [O ii]λ3727 line (as shown in the lower panel of Fig. 2), its [O iii]/[O ii] is unknown. However, using the metallicity and equations (3) and (4) in the study of Izotov et al. (2006), we can predict the flux of [O ii]. In order to test whether the predicted [O ii]λ3727 flux is reasonable, we use another diagnostic for the ionization parameter which has proved effective for BCDs (Stasińska et al., 2015), the [Ar iv]λ4740/[Ar iii]λ7135, and utilize the linear correlation between [O iii]λ5007/[O ii]λ3727 and [Ar iv]λ4740/[Ar iii]λ7135 shown in Stasińska et al. (2015) to obtain the flux of [O ii]λ3727. The, thus, calculated flux is , in excellent agreement with the predicted flux from metallicity. With these numbers, we derive the oxygen ionization ratio [O iii]/[O ii] .
Therefore, both of the RGG B and RGG 5 have low-metallicities, high-ionization ratios, and strong [O iii]λ5007emission, which are similar to the properties of the Y17 blueberries.
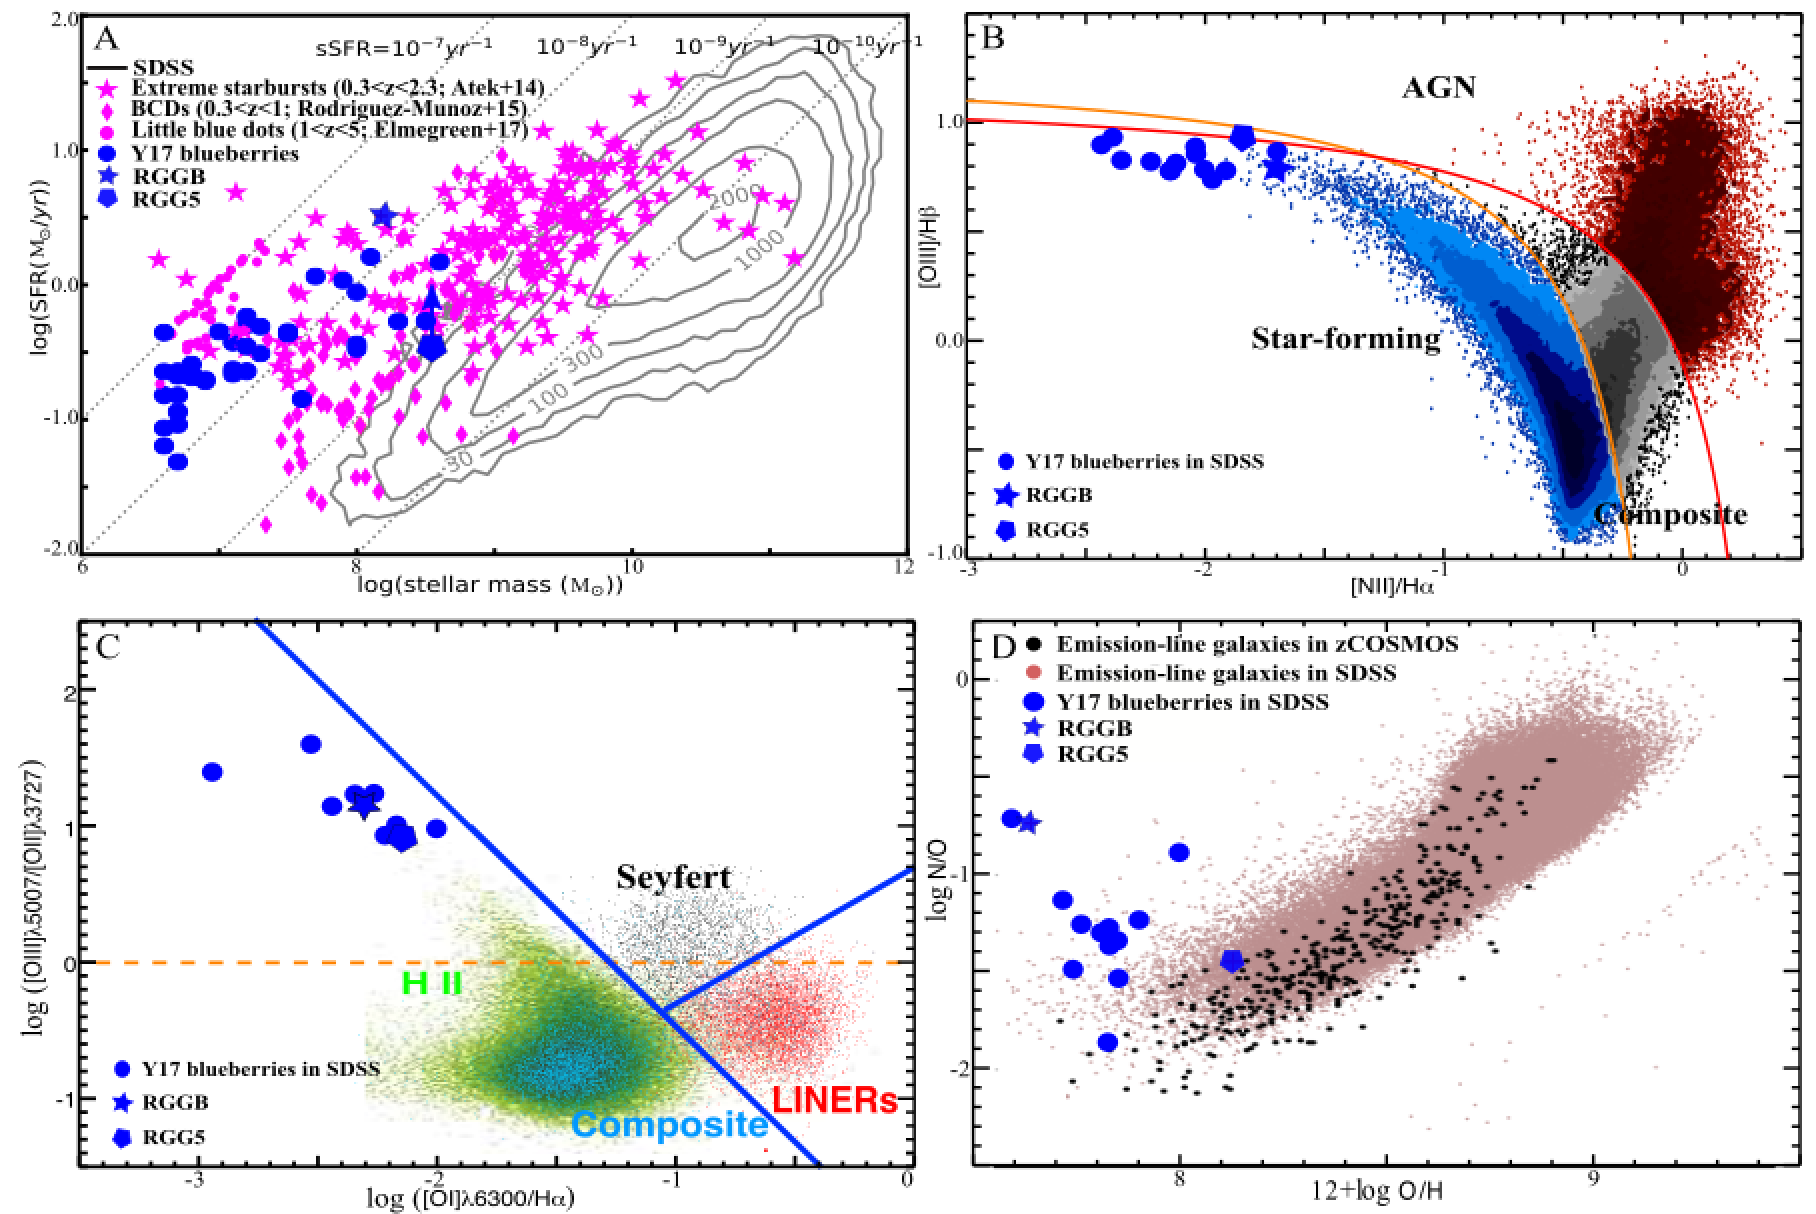
In the BPT diagram (Baldwin et al., 1981) as shown in panel B of Fig. 3, RGG B and RGG 5 are located at the similar positions to the Y17 blueberry sample, and very close to the theoretical maximum-starburst-line described in Kewley et al. (2001). RGG 5 is slightly beyond the maximum-starburst-line (excess of 0.01 dex); yet considering the 0.1 dex error of the theoretical maximum-starburst-line (Kewley et al., 2001), we argue that RGG 5 may also not contain AGN.
We also plot the diagram of the ionization parameter versus hardness of the ionizing radiation field, i.e., [O iii]λ5007/[O ii]λ3727 versus [O i]λ6300/H, as illustrated in panel C of Fig. 3. Here we only show the blueberries with the relatively high signal-to-noise ratios (S/N) of the [O i]λ6300 emission lines, to obtain accurate [O i]λ6300/H flux ratio values. We find that, this particular blueberry population, including RGG 5 and RGG B, are H ii galaxies with extremely high ionization parameters and relatively low hardness compared with the general population of SDSS galaxies, and cannot be classified as Seyfert galaxies in the diagram (Kewley et al., 2006).
The oxygen and nitrogen abundances can be evaluated using the method described in Izotov et al. (2006). The nitrogen-to-oxygen ratio (N/O) versus diagram for the blueberries is then displayed in panel D of Fig. 3. We find that, compared with the typical emission-line galaxies (Pérez-Montero et al., 2011), almost all of these low-metallicity starburst blueberries exhibit significant N overabundances which might be produced by nitrogen-enhanced WR star winds (e.g., Kunth et al., 1985; Thuan et al., 1996; Guseva et al., 2000), metal-rich outflows, or infall of metal-poor gas (Amorín et al., 2010; Pérez-Montero et al., 2011).
The spectroscopic properties of the two dwarf galaxies, RGG B and RGG 5, are broadly similar to those of the Y17 blueberries, and thus can be considered as two blueberry candidates. Therefore, according to the photometric studies of the two blueberry candidates, we can infer, e.g., the morphologies, IR-properties, etc., of the Y17 blueberry population.
2.3 Photometric Properties
2.3.1 Optical and NIR Imaging
RGG B was observed with the Wide-Field Camera 3 (WFC3) onboard the Hubble Space Telescope (HST) on May 22nd, 2015 (GO-13943, PI: Reines). In the high-resolution RGB image of RGG B, as shown in the upper panel of Fig. 4, it is clear that RGG B and its tail in the SDSS image are resolved in two blobs; one possibility is that, the brighter blob A with the azimuthally more symmetric, radial light distribution might be the galaxy RGG B, and the blob B with several bright knots (knots i, ii, iii) towards the sourth-west of RGG B might be its neighbor galaxy. The irregular galaxy RGG B/blob A has many flocculent/filamentary substrucures, typical of H ii regions. The two blobs are about apart, which is corresponding to kpc at . Pustilnik et al. (2004) studied the spectroscopy of the two blobs, with high-S/N spectra from MMT observation, taken on May 1st, 1997, and from SAO RAS 6-m telescope (BTA) observations, taken on February 19th, 2002, whose longslits covered both of the two blobs (Pustilnik et al., 2004). These spectra revealed that the redshift difference between the two blobs is very small with a radial velocity difference of km/s. Therefore, the neighbor/blob B is very likely to be the merging companion of RGG B/blob A.
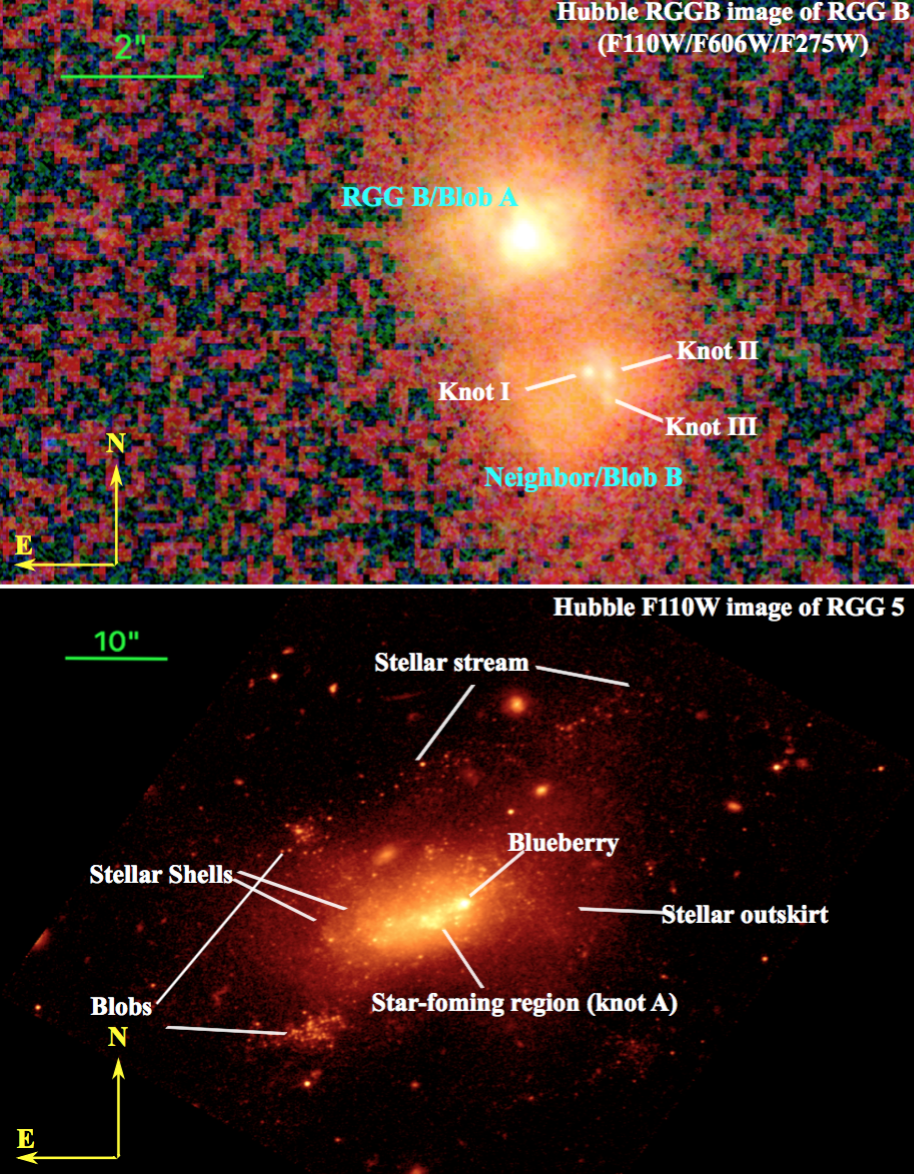
The absolute magnitudes (corrected for the foreground extinction) of the two blobs in the three filter bands are listed in Table 1; blob A is much brighter than blob B. We also calculate the full-width-at-half-maximum (FWHM) of blob A in each band, and find that its NUV light, which is produced by the recent star formation and/or AGN, is more concentrated in the central luminous “nucleus”, while the optical and NIR photons from the relatively-old stellar populations are distributed more diffusely. Therefore, there is a very dense star-forming region or AGN in the nucleus of blob A with a color of mag. Blob B reveals a stellar disk with the Sérsic index at and several star-forming regions (shown as the three bright knots i, ii, iii) in the RGB image. The colors of the three knots are (i), 1.1 (ii), and 1.5 (iii) mag, respectively, implying age differences between the three knots. The knot closest to blob A is youngest, while the farthest one is oldest, in accordance with a merger between RGG B/blob A and its companion/blob B.
| RGG B | |||
|---|---|---|---|
| Blob A | F275W | F606W | F110W |
| Absolute magnitude (mag) | |||
| FWHM (arcsec) | 0.15 | 0.19 | 0.26 |
| Blob B | F275W | F606W | F110W |
| Absolute magnitude (mag) | |||
| FWHM (arcsec) | 0.85 | 0.95 | 1.13 |
| Knot i/ii/iii | F275W | F606W | F110W |
| Absolute magnitude (mag) | // | // | –/–/– |
| FWHM (arcsec) | 0.10/0.13/0.10 | 0.10/0.25/0.16 | –/–/– |
| RGG 5 | |||
| F110W | Sérsic disk | Blueberry | Knot A |
| Absolute magnitude (mag) | |||
| Sérsic index | 0.99 | – | – |
However, it is also worth to note that the radial velocity difference between the blob A and B is only km/s according to the long-slit spectroscopic observations (Pustilnik et al., 2004, the seeing of the observations is arcsec); this small velocity difference may indicate the, e.g., asymmetric outflows in a galaxy, and thus the two blobs may actually be two star-forming regions in the outflows of one galaxy without merging (Pustilnik et al., 2004). Indeed, star formation can significantly disturb the galaxy morphology and reshape the entire galaxy without changing much its internal kinematics, e.g., outflows or galaxy rotation (e.g., Thuan et al., 2004; van Zee et al., 1998). Therefore, although the disturbed overall morphology with the “double-blob” structure, together with the very high power of the starburst in RGG B, suggests a possible recent dwarf merger, yet we still cannot exclude the possibility that RGG B is just disturbed by the in-situ star formation rather than undergoing a merger. Detailed future IFU observations will help to resolve this issue.
RGG 5 was observed with HST WFC3/IR on Jan 27th, 2016 (SNAP-14251, PI: Reines). In the WFC3/IR F110W image (shown in the lower panel of Fig. 4), RGG 5 presents a bright knot (corresponding to the blueberry core in the SDSS image, and named as ‘blueberry’ in the bottom panel of Fig. 4), a remarkable star-forming region (knot A), stellar outskirts, arc-like stellar shells, some blobs which may contain the populations of new-born star clusters, and a stellar-stream/spiral-arm feature straddling across the North. Particularly, the stellar shells appear aligned along the major axis of RGG 5, and indeed are the powerful evidence of a merger between two near-equal-mass dwarf galaxies (Paudel et al., 2017; Pop et al., 2017).
We find that the smooth surface brightness profile of RGG 5 can be well approximated by a Sérsic component, by using the iterative fitting method described in Eigenthaler et al. (2018); the normalized chi-square of fitting is , and the residual image only includes the blueberry core, star-forming hotspots (e.g., knot A, blobs), and some background galaxy interlopers333We have also tried double-Sérsic fitting to compare with the one-Sérsic fitting result, and find that the residual image and normalized chi-square are very similar to those of the one-Sérsic fitting results. We, therefore, use the one-Sérsic fitting for simplification.. The NIR magnitudes of the blueberry core and star-forming knot A can thus be obtained from the residual image, as listed in Table 1; we find that they have similar absolute F110W magnitudes mag.
Compared with RGG B, RGG 5 does not reveal many filamentary substructures, and is relatively redder, suggesting that RGG 5 may be in a slightly older merging stage than RGG B. A significant fraction of young star clusters (YSCs) shows a clear signature of a flux excess in the NIR band (Adamo et al., 2010, 2011a), primarily shown as the luminous point-like sources in the blueberry core, star-forming region knot A, hotspots around the blueberry and knot A, blobs, and stellar stream. Particularly for the blueberry core, it exhibits higher flux densities in the NIR passband compared with those in the optical passband regardless of the emission-line fluxes444http://rcsed.sai.msu.ru/catalog/587732577221083492 (e.g., strong [O iii], H, etc.), and its YHK-combined image from the UKIRT Infrared Deep Sky Survey (UKIDSS; Lawrence et al., 2007) reveals a “pink” color (as shown in panel c of Fig. 1; Chilingarian et al., 2012, 2017), compared with the blue color of the outskirt, suggesting that its -band flux is relatively brighter than the -band flux. It may indicate a large fraction of red supergiants stars in the stellar population in the blueberry core, as the stellar atmospheres of young red supergiants are relatively cool (e.g. Gustafsson et al., 2008), and hence have a dominant light output in NIR. This would imply very young stellar population ages of a few Myr. Alternatively, thermally pulsing AGB phase transition stars provide also significant NIR flux output (e.g. Capozzi et al., 2016), which would indicate stellar population ages within Gyr (Maraston, 2005). However, the high-ionization features in the blueberry spectra favor the red supergiant, and thus, younger stellar population picture.
2.3.2 Photometric mid-IR Properties
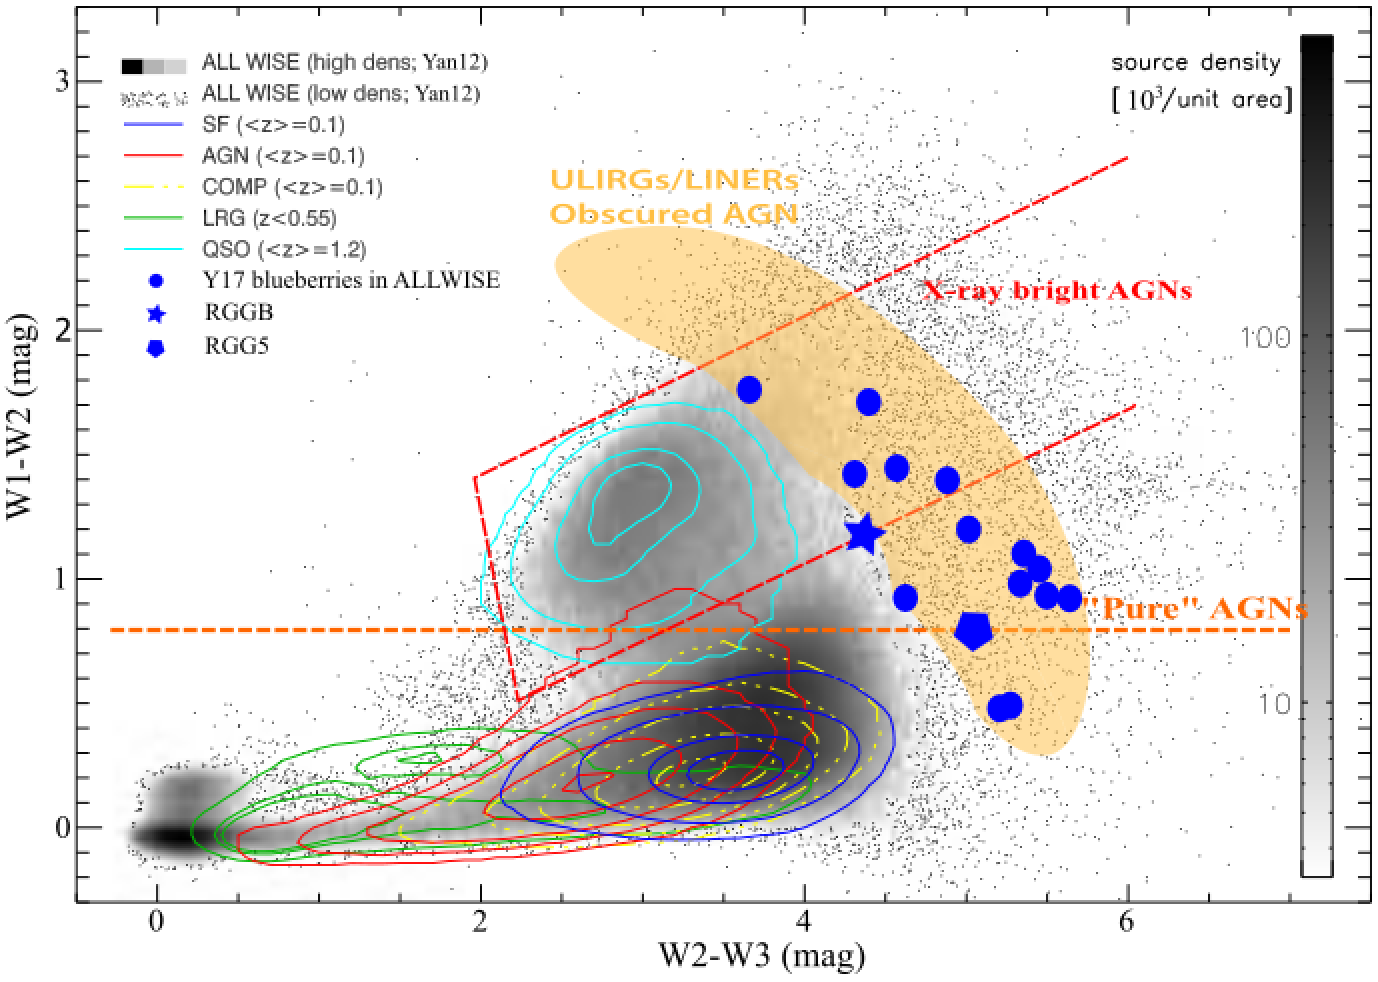
In Fig. 5 (adapted from Yan et al. (2013)), we show the mid-IR colors, W1-W2 and W2-W3, of RGG B and RGG 5 retrieved from the AllWISE Source Catalog (Wright et al., 2010). Both galaxies are extremely red; most of the blueberries are even redder than the so-called “pure AGN” line (Stern et al., 2012). However, note that dwarf galaxies with extreme star formation are capable of heating dust to temperatures producing mid-IR colors W1-W2 mag (e.g., Stern et al., 2012), and this single color cut (W1-W2=0.8) alone should not be used to select AGN in dwarf galaxies (Hainline et al., 2016). We find that the Y17 blueberries and RGG B and RGG 5 coarsely reside in the “ultra-luminous-infrared galaxy (ULIRGs)/LINERs/Obscured AGN” region (Lake et al., 2012) in the color-color diagram, different from the region for the typical starburst galaxies.
In summary, RGG B and RGG 5 are two blueberry candidates with similar properties as the Y17 blueberries. As a pilot study we analyze the photometry and spectroscopy of these two galaxies as a pathway to the general properties of the blueberry galaxy population as a whole.
3 Discussion of other properties
3.1 The possible presence of an AGN?
Do RGG B and RGG 5 contain AGN? Although Chandra observation of RGG B reveals a low X-ray luminosity (; Baldassare et al., 2017b), some evidence (e.g., a luminous core in the galaxy) may also agree with the existence of an obscured low-metallicity AGN; particularly, RGG B exhibits broad-line emission, e.g., broad H, which may originate from the broad-line region of an AGN. However, here we argue that the AGN may not exist in RGG B because of the following reasons:
If the broad-H originates from the central AGN, the X-ray luminosity of AGN can be evaluated by using the empirical correlations between the broad H luminosity, continuum luminosity , and (Greene & Ho, 2005; Jin et al., 2012), i.e., and . The inferred of AGN is (in units of ), much higher than the observation . Therefore, RGG B may not contain an AGN or the broad-H component is not caused by the accretion disk of an AGN.
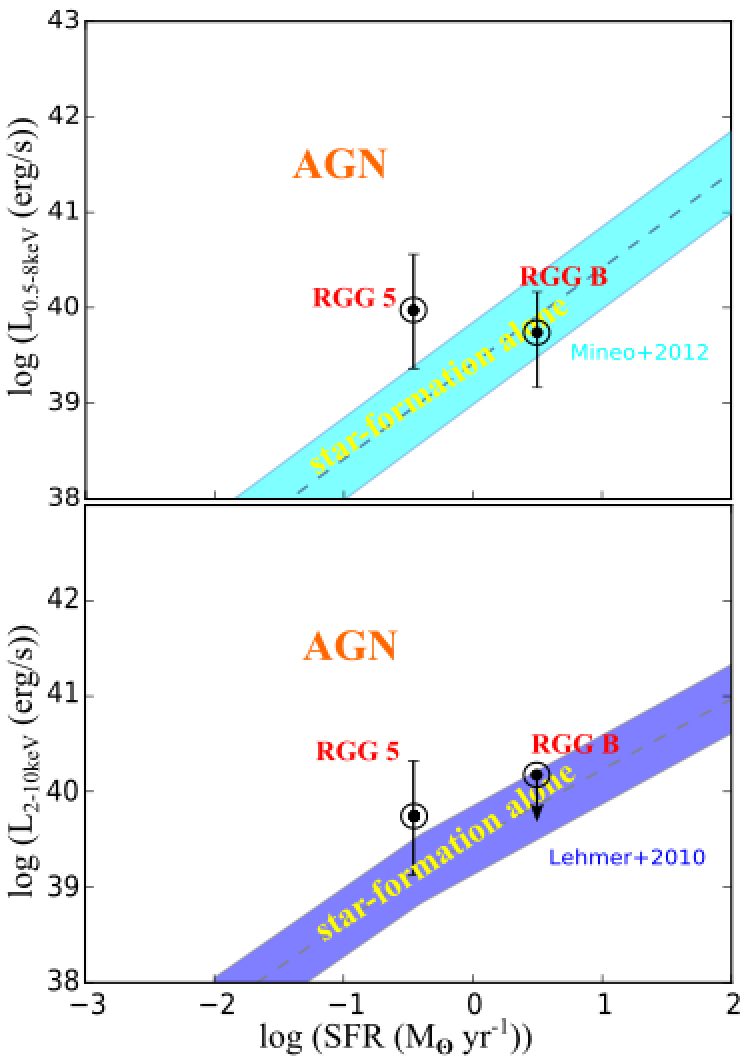
Its X-ray luminosity and SFR obtained from the narrow-H luminosity (Kennicutt, 1998) follow the correlation between X-ray luminosities and SFRs expected for star formation alone (Lehmer et al., 2010; Mineo et al., 2012; Baldassare et al., 2017b), as shown in Fig. 6, suggesting that the X-ray radiation of RGG B is more likely to be contributed by star formation.
The ratio of RGG B, where and are the luminosity densities at Å and 2 keV, respectively, is far off from the expected value from a quasar (Just et al., 2007; Baldassare et al., 2017b).
In general, the low-mass AGN in dwarf galaxies show high-metallicities similar to those of the typical high-mass AGN (Greene & Ho, 2007), inconsistent with the low-metallicity of RGG B.
RGG 5 shows no broad-line emission, or the S/N of the broad component is so low that we cannot extract such a weak component. In the BPT diagram, RGG 5 is located slightly beyond (excess of dex) the theoretical maximum-starburst-line. We also study its locations in the diagrams of [O iii]/H versus [S ii]/H and [O iii]/H versus [O i]/H, and find that RGG 5 always resides in the BPT AGN region and is slightly beyond (excess of dex) the theoretical maximum-starburst-lines. Considering that there are about 0.1 dex errors of the theoretical maximum-starburst-lines (Kewley et al., 2001), it definitely cannot exclude the possibility that RGG 5 is a star-forming galaxy rather than AGN. Further, in the [O iii]λ5007/[O ii]λ3727 versus [O i]λ6300/H diagram (panel C of Fig. 3), RGG 5 is located at the H ii rather than Seyfert region, suggesting that RGG 5 is likely not hosting a significant AGN component.
Another valid method of judging whether RGG 5 contains an AGN is to estimate its X-ray luminosity from another-passband (e.g., NIR) luminosity by using a typical AGN SED. Indeed, this method that derives one-passband luminosity from another-passband luminosity has been widely used and proved to be succesful in some other dwarf galaxies in the previous literatures (e.g., Baldassare et al., 2017a; Marleau et al., 2017; Stern et al., 2007), although it introduces a relatively large uncertainty of dex. If we assume that the F110W luminosity of the blueberry core (in Fig. 4) of RGG 5 is dominated by AGN radiation, then using the AGN SED from Richards et al. (2006), we can infer the expected AGN X-ray luminosity from the observed F110W luminosity. The SEDs of the optically-blue and IR-luminous AGN in the study of Richards et al. (2006) are used, respectively, to estimate the X-ray luminosity. We obtain erg/s and erg/s for an optically blue AGN, and erg/s and erg/s for an IR-luminous AGN. Note, the SEDs of AGN in the study of Richards et al. (2006) have a large scatter of dex. As explored in Fig. 6, for RGG 5, the predicted versus SFR, and versus SFR relations, are only slightly beyond the correlations between the X-ray luminosities and SFRs expected for star formation alone (Lehmer et al., 2010; Mineo et al., 2012); the error bars of RGG 5 correspond to the dex scatter of the AGN SEDs. However, we stress that the predicted X-ray luminosities are the upper limits of RGG 5, as the F110W NIR luminosities of RGG 5 should contain contributions from star formation. Therefore, the positions of RGG 5 should be much closer to the region of star formation alone, thus RGG 5 is not likely to harbor an AGN or only reveals a very weak and negligible AGN activity.
Here we conclude that the blueberry galaxies may not harbor AGNs. There are some possible reasons for non-existence of AGNs in the blueberries, e.g., the blueberries are in the early stages of merging where potential AGN activities have not been triggered (Guo et al., 2011; Rong et al., 2017b), or these blueberry galaxies do not contain massive black holes at all. Again, we note that the uncertainties of the predicted X-ray luminosities from the NIR luminosities and typical AGN SEDs are relatively large, we appeal to obtain further X-ray observations for more blueberry galaxies to test our conclusions.
3.2 The case of borad-line emission
As shown in Fig. 2, RGG B presents broad-line emission (e.g., broad-H) corresponding to a large velocity of gas km/s, which was believed to be caused by the supernovae (SNe) shocks or stellar winds from early-type stars in the previous studies (e.g., Izotov et al., 2007; Izotov & Thuan, 2008; Pustilnik et al., 2004). Generally, the broad emission in the low-metallicity BCDs with broad-H luminosities of is likely to arise from circumstellar envelopes around hot Ofp/WN9 and/or LBV stars, or from single or multiple SN remnants propagating in the interstellar medium, or from SN bubbles; whereas the broad emission with higher broad-H luminosities, such as RGG B (), is probably produced by the shocks propagating in the circumstellar envelopes of type IIn SNe or an AGN (Izotov et al., 2007; Izotov & Thuan, 2008; Guseva et al., 2000; Smith et al., 2011).
For RGG B, its broad-line emission is very likely attributed to the shocks. Indeed, O’Halloran et al. (2008) found that the SNe shocks, which are traced by the ratios of the 26 m [Fe ii] line and 12.8 m [Ne ii] line, play an important role in the deficit of polycyclic aromatic hydrocarbons in RGG B. RGG 5 presents no broad-line emission; yet we cannot exclude the possibility that it is due to the low S/N ratio or that the SDSS fiber only covered the nucleus region while the broad-line emission is produced in the outskirts. Particularly, the shell-like structures in RGG 5 is proposed to be formed in the recent star formation regions in a shocked galactic wind (Fabian et al., 1980). We suspect that the shocks may broadly exist in the blueberries. Note, the high [O iii]/H of the blueberry galaxies may also be partly attributed to the boosting of shocks (e.g., Guerrero et al., 2008, 2013).
Compared with the typical BCDs, e.g. Mrk 930, which presents the WR spectral features (Adamo et al., 2011b), the blueberries are more ionized, indicating that their stellar populations are likely younger, and thus the WR stellar populations are expected to be found in blueberries. Additionally, the N overabundances of the blueberry galaxies may also suggest the non-negligible effect of the WR stars. Indeed, the WR blue bump and significant He iiλ4686 emission line have been verified in RGG B (Pustilnik et al., 2004). However, in contrast to RGG B, RGG 5 reveals no He iiλ4686 emission or WR blue bump (see Fig. 2), which may be because of the limited S/N ratio of the spectrum, or the WR stars are primarily distributed in the outskirt of RGG 5 while the nucleus is dominated by the red supergiants. In this sense, high-S/N IFU spectroscopic observation with, e.g. the Multi Unit Spectroscopic Explorer (MUSE) on ESO/VLT, would be ideal to characterize the properties of the WR stars in RGG 5.
4 Summary
This is a pilot study of blueberry galaxies in the nearby Universe. We have studied the spectroscopic and photometric properties of two blueberry candidate galaxies, RGG B and RGG 5, with high-resolution HST images and SDSS spectroscopy. We found that their properties, e.g., BPT locations, high-sSFRs, low-metallicities, high-ionization ratios, nitrogen-overabundances, and mid-IR colors, are similar to those of the Y17 blueberries, and thus can be typical examples to understand the characteristics of blueberries. In the following, we summarize some key findings.
1) The blueberry galaxies perhaps are merging dwarf galaxies, and contain luminous H ii regions (possibly dominated by red supergiants) and some star-forming hotspots harboring many young star clusters. Yet we cannot exclude the possibility that some blueberries may not undergo a merging event but simply exhibit one/several star-forming regions with outflows. Future IFU observations will help resolving this issue.
2) All of the blueberries are approximately located at the upper-left star-forming region in the BPT diagram, and very close to the theoretical maximum-starburst-line. All of the blueberries have very high ionization parameters and relatively low hardness ionizing radiation field, show N overabundances and extremely red mid-IR colors and reside in the so-called “ULIRGs/LINERs/Obscured AGN” region. The red mid-IR colors of the blueberries are probably caused by the UV photons from the young massive star clusters in the galaxies heating the surrounded dust.
3) According to the locations in the BPT and SFR versus X-ray luminosity diagrams, the blueberry galaxies may not harbor AGNs. We appeal to collect deeper X-ray observations for more blueberries to test this possible conclusion.
Acknowledgments
YR thanks Simon Pustilnik, Chen Hu for their helpful discussions, and acknowledges supports from CAS-CONICYT postdoctoral fellowship No. 16004 and NSFC grant No. 11703037. This work is accomplished with the support from the Chinese Academy of Sciences (CAS) through a CAS-CONICYT Postdoctoral Fellowship administered by the CAS South America Center for Astronomy (CASSACA) in Santiago, Chile. THP acknowledges support in form of the FONDECYT Regular Project No. 1161817 and by the BASAL Center for Astrophysics and Associated Technologies (PFB-06).
References
- Adamo et al. (2010) Adamo, A., Östlin, G., Zackrisson, E., Hayes, M., Cumming, R. J., Micheva, G. 2010, MNRAS, 407, 870
- Adamo et al. (2011a) Adamo, A., Östlin, G., Zackrisson, E., Hayes, M. 2011a, MNRAS, 414, 1793
- Adamo et al. (2011b) Adamo, A., Östlin, G., Zackrisson, E., Papaderos, P., Bergvall, N., Rich, R. M., Micheva, G. 2011b, MNRAS, 415, 2388
- Almaini et al. (2017) Almaini, O., et al. 2017, MNRAS, 472, 1401
- Amorín et al. (2010) Amorín, R. O., Pérez-Montero, E., Vílchez, J. M. 2010, ApJ, 715, L128
- Atek et al. (2014) Atek, H., et al. ApJ, 789, 96
- Baldassare et al. (2017a) Baldassare, V. F., Reines, A. E., Gallo, E., Greene, J. E. 2017a, ApJ, 850, 196
- Baldassare et al. (2017b) Baldassare, V. F., Reines, A. E., Gallo, E., Greene, J. E. 2017b, ApJ, 836, 20
- Baldassare et al. (2016) Baldassare, V. F., et al. 2016, ApJ, 829. 57
- Baldwin et al. (1981) Baldwin, J. A., Phillips, M. M., Terlevich, R. 1981, PASP, 93, 5
- Balser et al. (2011) Balser, D. S., Rood, R. T., Bania, T. M., Anderson, L. D. 2011, ApJ, 738, 27
- Banfield et al. (2015) Banfield, J. K., et al. 2015, MNRAS, 453, 2326
- Bennert et al. (2008) Bennert, N., Canalizo, G., Jungwiert, B., Stockton, A., Schweizer, F., Peng, C., Lacy, M. 2008, ApJ, 677, 846
- Caccianiga et al. (2015) Caccianiga, A., et al. 2015, MNRAS, 451, 1795
- Canalizo et al. (2007) Canalizo, G., Bennert, N., Jungwiert, B., Stockton, A., Schweizer, F., Lacy, M., Peng, C. 2007, ApJ, 669, 801
- Capozzi et al. (2016) Capozzi, D., Maraston, C., Daddi, E., et al. 2016, MNRAS, 456, 790
- Carlson et al. (2007) Carlson, L. R., et al. 2007, ApJ, 665, L109
- Chilingarian et al. (2012) Chilingarian, I. V., Zolotukhin, I. Y. 2012, MNRAS, 419, 1727
- Chilingarian et al. (2017) Chilingarian, I. V., Zolotukhin, I. Y., Katkov, I. Y., Melchior, A.-L., Rubtsov, E. V., Grishin, K. A. 2017, ApJS, 228, 14
- Corbin et al. (2006) Corbin, M. R., Vacca, W. D., Cid Fernandes, R., et al. 2006, ApJ, 651, 861
- Cormier et al. (2015) Cormier, D., Madden, S. C., Lebouteiller, V., et al. 2015, A&A, 578, A53
- Dias et al. (2002) Dias, W. S., Alessi, B. S., Moitinho, A., Lépine, J. R. D. 2002, A&A, 389, 871
- Dopita et al. (1997) Dopita, M. A., Koratkar, A. P., Allen, M. G., Tsvetanov, Z. I., Ford, H. C., Bicknell, G. V., Sutherland, R. S. 1997, ApJ, 490, 202
- Drinkwater et al. (2000) Drinkwater, M. J., Jones, J. B., Gregg, M. D., Phillipps, S. 2000, PASA, 17, 227
- Eigenthaler et al. (2018) Eigenthaler, P., et al. 2018, ApJ, 855, 142
- Elmegreen (1998) Elmegreen, B. G. 1998, Origins, 148, 150
- Elmegreen (2017) Elmegreen, D. M., Elmegreen, B. G. 2017, ApJ, 851L, 44
- Fabian et al. (1980) Fabian, A. C., Nulsen, P. E. J., Stewart, G. C. 1980, Nature, 287, 613
- Ferland & Osterbrock (1986) Ferland, G. J., Osterbrock, D. E. 1985, ApJ, 289, 105
- Finkelstein, et al. (2009) Finkelstein, S. L., Rhoads, J. E., Malhotra, S., et al. 2009, ApJ, 691, 465
- Gil de Paz et al. (2003) Gil de Paz, A., Madore, B. F., Pevunova, O. 2003, ApJS, 147, 29
- Greene & Ho (2005) Greene, J. E., Ho, L. C. 2005, ApJ, 630, 122
- Greene & Ho (2007) Greene, J. E., Ho, L. C. 2007, ApJ, 670, 92
- Groves et al. (2006) Groves, B. A., Heckman, T. M., Kauffmann, G. 2006, MNRAS, 371, 1559
- Guerrero et al. (2008) Guerrero, M. A., Miranda, L. F., Riera, A., et al. 2008, ApJ, 683, 272
- Guerrero et al. (2013) Guerrero, M. A., Toal’a, J. A., Medina, J. J., Luridiana, V., Miranda, L. F., Riera, A., Vel’azquez, P. F. 2013, A&A, 557, 121
- Guo et al. (2011) Guo, Q., et al. 2011, MNRAS, 413, 101
- Guseva et al. (2017) Guseva, N. G., Izotov, Y. I., Fricke, K. J., Henkel, C. 2017, A&A, 599, A65
- Guseva et al. (2000) Guseva, N. G., Izotov, Y. I., Thuan, T. X. 2000, ApJ, 531, 776
- Gustafsson et al. (2008) Gustafsson, B., Edvardsson, B., Eriksson, K., et al. 2008, A&A, 486, 951
- Hainline et al. (2016) Hainline, K. N., Reines, A. E., Greene, J. E., Stern, D. 2016, ApJ, 832, 119
- Heckman (1980) Heckman, T. M. 1980, A&A, 87, 152
- Hirashita & Hunt (2004) Hirashita, H., Hunt, L. K. 2004, A&A, 421, 555
- Hunt et al. (2010) Hunt, L. K., Thuan, T. X., Izotov, Y. I., Sauvage, M. 2010, ApJ, 712, 164
- Izotov et al. (2006) Izotov, Y. I., Stasińska, G., Meynet, G., Guseva, N. G., Thuan, T. X. 2006, A&A, 448, 955
- Izotov & Thuan (2008) Izotov, Y. I., Thuan, T. X. 2008, ApJ, 687, 133
- Izotov et al. (2007) Izotov, Y. I., Thuan, T. X., Guseva, N. G. 2007, ApJ, 671, 1297
- Jin et al. (2012) Jin C., Ward, M., Done, C. 2012, MNRAS, 422, 3268
- Just et al. (2007) Just, D. W., Brandt, W. N., Shemmer, O., et al. 2007, ApJ, 665, 1004
- Kauffmann et al. (2003) Kauffmann, G., et al. 2003, MNRAS, 346, 1055
- Kennicutt (1998) Kennicutt, R. C. Jr., 1998, ARA&A 36, 189
- Kennicutt & Evans (2012) Kennicutt, R. C., Evans, N. J. 2012, ARA&A, 50, 531
- Kewley et al. (2001) Kewley, L. J., Dopita, M. A., Sutherland, R. S., Heisler, C. A., Trevena, J. 2001, ApJ, 556, 121
- Kewley et al. (2006) Kewley, L. J., Groves, B., Kauffmann, G., Heckman, T. 2006, MNRAS, 372, 961
- Kniazev et al. (2000) Kniazev, A. Y., Pustilnik, S. A., Ugryumov, A. V., Kniazeva, T. F. 2000, Astronomy Letters, 26, 129
- Kunth et al. (1985) Kunth, D., Joubert, M. 1985, A&A, 142, 411
- Lake et al. (2012) Lake, S. E., Wright, E. L., Petty, S., Assef, R. J., Jarrett, T. H., Stanford, S. A., Stern, D., Tsai, C.-W. 2012, The Astronomical Journal, 143, 7
- Lawrence et al. (2007) Lawrence, A., et al. 2007, MNRAS, 379, 1599
- Lehmer et al. (2010) Lehmer, B. D., Alexander, D. M., Bauer, F. E., et al. 2010, ApJ, 724, 559
- Longmore et al. (2014) Longmore, S. N., Kruijssen, J. M. D., Bastian, N., et al. 2014, Protostars and Planets VI, 291
- Malin & Carter (1983) Malin, D. F., Carter, D. 1983, ApJ, 274, 534
- Maraston (2005) Maraston C., 2005, MNRAS, 362, 799
- Marleau et al. (2017) Marleau, F. R., Clancy, D., Habas, R., Bianconi, M. 2017, A&A, 602, 28
- Melnick et al. (2017) Melnick, J., Telles, E., Bordalo, V., et al. 2017, A&A, 599, A76
- Mineo et al. (2012) Mineo, S., Gilfanov, M., Sunyaev, R. 2012, MNRAS, 419, 2095
- O’Halloran et al. (2008) O’Halloran, B., Madden, S. C., Abel, N. P. 2008, ApJ, 681, 1205
- Panessa et al. (2006) Panessa, F., Bassani, L., Cappi, M., et al. 2006, A&A, 455, 173
- Paudel et al. (2017) Paudel, S., et al. 2017, ApJ, 834, 66
- Pop et al. (2017) Pop, A.-R., Pillepich, A., Amorisco, N., et al. 2017, Galaxies, 5, 34
- Pustilnik et al. (1999) Pustilnik, S. A., Engels, D., Ugryumov, A. V., Lipovetsky, V. A., Hagen, H.-J., Kniazev, A. Yu., Izotov, Yu. I., Richter, G. 1999, A&AS, 137, 299
- Pérez-Montero et al. (2011) Pérez-Montero, E., et al. 2013, A&A, 549, 25
- Pérez-Montero et al. (2011) Pérez-Montero, E., et al. 2011, A&A, 532, 141
- Pustilnik et al. (2004) Pustilnik, S. A., Kniazev, A. Y., Pramskij, A., Izotov, Y., Foltz, C., Brosch, N., Martin, J.-M., Ugryumov, A., 2004, A&A, 419, 469
- Quinn (1984) Quinn, P. J. 1984, ApJ, 279, 596
- Reines et al. (2013) Reines, A. E., Greene, J. E., Geha, M. 2013, ApJ, 775, 2
- Renzini (2017) Renzini, A. 2017, MNRAS, 469, L63
- Richards et al. (2006) Richards, G. T., et al. 2006, ApJS, 166, 470
- Rodríguez-Muñoz et al. (2015) Rodríguez-Muñoz, L., Gallego, J., Pacifici, C., Tresse, L., Charlot, S., Gil de Paz, A., Barro, G., Villar, V. 2015, ApJ, 799, 36
- Rong et al. (2017a) Rong, Y., Guo, Q., Gao, L., Liao, S., Xie, L., Puzia, T. H., Sun, S., Pan, J. 2017a, MNRAS, 470, 4231
- Rong et al. (2017b) Rong, Y., Jing, Y., Gao, L., Guo, Q., Wang, J., Sun, S., Wang, L., Pan, J. 2017b, MNRAS, 471L, 36
- Sánchez Almeida et al. (2016) Sánchez Almeida, J., Pérez-Montero, E., Morales-Luis, A. B., et al. 2016, ApJ, 819, 110
- Sikkema et al. (2007) Sikkema, G., Carter, D., Peletier, R. F., Balcells, M., Del Burgo, C., Valentijin, E. A. 2007, A&A, 467, 1011
- Smith et al. (2011) Smith, N., Li, W., Silverman, J. M., Ganeshalingam, M., Filippenko, A. 2011, MNRAS, 415, 773
- Stasińska et al. (2006) Stasińska, G., Cid Fernandes, R., Mateus, A., Sodré, L., Jr., Asari, N. V. 2006, MNRAS, 371, 972
- Stasińska et al. (2015) Stasińska, G., Izotov, Y., Morisset, C., Guseva, N. 2015, A&A, 576, 83
- Stern et al. (2007) Stern D., et al. 2007, ApJ, 663, 677
- Stern et al. (2012) Stern D., et al. 2012, ApJ, 753, 30
- Terlevich et al. (1981) Terlevich, R., Melnick, J. 1981, MNRAS, 195, 839
- Thuan et al. (2004) Thuan, T. X., Hibbard, J. E., Lévrier, F. 2004, ApJ, 128, 617
- Thuan et al. (1996) Thuan, T. X., Izotov, Y., Lipovetsky, V. 1996, ApJ, 463, 120
- Thuan & Martin (1981) Thuan, T. X., Martin, G. E. 1981, ApJ, 247, 823
- Trouille et al. (2011) Trouille, L., Barger, A. J., Tremonti, C. 2011, arXiv:1110.0008
- Tsvetanov et al. (1998) Tsvetanov, Z. I., Hartig, G. F., Ford, H. C., Kriss, G. A., Dopita, M. A., Dressel, L. L., Harms, R. J. 1998, arXiv:astro-ph/9801037
- van Dokkum et al. (2015) van Dokkum, P. G., Abraham, R., Merritt, A., Zhang, J., Geha, M., Conroy, C. 2015, ApJ, 798L, 45
- van Dokkum et al. (2018) van Dokkum, P. G., et al. 2018, arXiv: 1803.1023
- van Zee et al. (1998) van Zee, L., Salzer, J. J., Haynes, M. P., O’Donoghue, A. A., Balonek, T. J. 1998, AJ, 116, 2805
- Walborn et al. (2002) Walborn, N. R., Maíz-Apellániz, J., Barbá, R. H. 2002, AJ, 124, 1601
- Wright et al. (2010) Wright, E. L., Eisenhardt, P. R. M., Mainzer, A. K., et al. 2010, AJ, 140, 1868
- Yan et al. (2013) Yan, L., et al. 2013, The Astronomical Journal, 145, 55
- Yang et al. (2017) Yang, H., Malhotra, S., Rhoads, J. E., Wang, J. 2017, ApJ, 847, 38
- Yuan et al. (2014) Yuan, W., Zhou, H., Dou, L., et al. 2014, ApJ, 782, 55
- Zwicky & Zwicky (1971) Zwicky, F., Zwicky, M. A. 1971, Catalogue of Selected Compact Galaxies and of Post-eruptive Galaxies (Guemligen: Zwicky)