Mutation rate variability as a driving force in adaptive evolution
Abstract
Mutation rate is a key determinant of the pace as well as outcome of evolution, and variability in this rate has been shown in different scenarios to play a key role in evolutionary adaptation and resistance evolution under stress caused by selective pressure. Here we investigate the dynamics of resistance fixation in a bacterial population with variable mutation rates and show that evolutionary outcomes are most sensitive to mutation rate variations when the population is subject to environmental and demographic conditions that suppress the evolutionary advantage of high-fitness subpopulations. By directly mapping a biophysical fitness function to the system-level dynamics of the population we show that both low and very high, but not intermediate, levels of stress in the form of an antibiotic result in a disproportionate effect of hypermutation on resistance fixation. We demonstrate how this behavior is directly tied to the extent of genetic hitchhiking in the system, the propagation of high-mutation rate cells through association with high-fitness mutations. Our results indicate a substantial role for mutation rate flexibility in the evolution of antibiotic resistance under conditions that present a weak advantage over wildtype to resistant cells.
I Introduction
The ability to predict the possible trajectories of a naturally evolving complex living system is key to describing and anticipating varied ecological and biomedical phenomena. Such predictability rests on an understanding of the potential for evolutionary adaptability of a given system. In asexual populations a major mechanism responsible for evolutionary adaptation under environmental stress is the generation via genetic mutations of phenotypes able to better withstand and thrive under the stressor: resistant populations arising from within a wildtype population that may “rescue” the population from the source of stress by eventually coming to dominate the population. The rate at which such resistant mutations occur and the balance between these and more deleterious mutations are major determinants of whether the population may survive and adapt to selective evolutionary pressure lynch2016genetic ; denamur2006evolution ; de2002fate ; sniegowski2000evolution ; taddei1997role , an environmental stressor that targets strain variants, or phenotypes, non-uniformly. Although the baseline mutation rate in bacteria is quite low, at about per genome per generation lee2012rate ; drake1998rates , high prevalences of mutator strains in natural bacterial populations and clinical isolates have been observed in various studies (see gross1981incidence ; leclerc1996high ; matic1997highly ; denamur2002high for early work and hall2006hypermutable for a survey), and in certain cases “hypermutability”, an increase in the mutation rate over the baseline rate, was shown to result in fitness increases and faster adaptation chao1983competition ; taddei1997role ; tenaillon1999mutators ; heo2010interplay ; ram2012evolution ; ram2014stress ; lukavcivsinova2017stress and even be essential for survival under stress swings2017adaptive by enabling genetic hitchhiking on beneficial mutations smith1974hitch ; taddei1997role ; gentile2011competition ; giraud2001costs . Mutation rates can increase under environmental stress fitzgerald2017stress ; maclean2013evaluating ; galhardo2007mutation ; foster2007stress , and, in particular, hypermutability may play a significant role in the rise of antibiotic resistance hammerstrom2015acinetobacter ; jolivet2011bacterial ; eliopoulos2003hypermutation ; chopra2003role ; giraud2002mutator ; martinez2000mutation .
The potential for adaptability via genetic mutations is dependent on the interplay between the ensemble of phenotypes that the system can access via mutations and the rate at which such transitions may occur within this ensemble. Phenotypes are typically characterized by some intrinsic measure of evolutionary fitness, such as their growth rate or lag phase, that contributes to evolutionary success, with extrinsic conditions, such as the probability of acquisition of this trait, initial population distribution, or resource availability, held fixed. Yet evolutionary advantage is determined by an interplay of these intrinsic and extrinsic factors, and separating these dependences while considering only a subset of them is of limited utility in establishing a global picture of a system’s evolvability potential as well as specific response to selective pressure. Here, we address both with a view to investigating the extent to which mutation rate variability drives adaptation under selective pressure.
The main purpose of this paper is to demonstrate that evolution under selective pressure – an external stressor that induces a fitness gradient in a given population – may not be uniformly sensitive to mutation rate as a function of the selective pressure as well as additional fitness-determining conditions, and that this non-uniform behavior should be taken into account when deciding on an appropriate antibiotic dosing protocol. In such a situation there is generally no information available on the mutation rate in the pathogenic bacterial population, and this rate may also change in the course of therapy, as noted above. If dosing can be restricted to ranges for which the expected evolutionary outcome is less sensitive to the mutation rate, there will be higher predictive certainty about the treatment outcome and more reliable strategies can be developed for avoiding antibiotic resistance arising in the course of treatment.
By considering a simple deterministic model of bacterial evolution under limited resources, we show that evolutionary outcome is most sensitive to the mutation rate when there exist phenotypes in the population that have a weak advantage – expressed through either intrinsic traits or extrinsic conditions – over the phenotype that is initially dominant in the population. In Section II we introduce and describe our evolutionary dynamics model; in Section III we define and motivate our measure of mutation rate sensitivity and quantify how sensitive the evolutionary success of a population is to increases in the mutation rate. We show that the fitness advantage of the resistant mutant – as given by both intrinsic fitness and extrinsic advantage-conferring conditions – is a determining factor in the extent of this sensitivity. In Section IV, we focus our analysis on selective evolutionary pressure in the form of a bacterial growth inhibitor (antibiotic) and quantify (i) the dependence of mutation rate sensitivity to this source of pressure, and (ii) the extent to which the antibiotic drives the fixation of hypermutation in the population. We conclude with a brief discussion of the ramifications of our findings in Section V.
II The Model
We consider a system under non-neutral selection in which up to two distinct phenotypes – defined by their growth rates – may coexist under limited resources. We denote them by for wildtype and for resistant – designations that are intended to indicate that the phenotype is more resistant to the evolutionary pressure considered (e.g. antibiotic, as in Section IV) under the non-neutral selection experienced by the population. Each of these phenotypes may be found with some baseline mutation rate or with an elevated mutation rate of , . Both forward and backward mutations are permitted with equal probability111While resistance can result from the accumulation of a series of mutations, first-generation mutants – for which the mutation is reversible by a single-point mutation – can already exhibit discernibly increased resistance palmer2015delayed ; rodrigues2016biophysical , with further substantial increases in resistance found in some second-generation mutants, for which the equal probability assumption can be thought of as a “first-order” approximation. ; transitions between baseline-mutation phenotype and its elevated-mutation counterpart (of identical growth rate) occur with rate . In addition, to account for the fitness penalty incurred due to an increased rate of deleterious mutations at higher values of , we assume that either phenotype may experience deleterious mutations with probability . Since at non-negligible levels of selective pressure phenotypes whose resistance to the pressure is weaker than wildtype will have very low growth, we do not keep track of such low-growth populations explicitly, but they are implicitly accounted for in our model as the loss of cells from higher-growth populations via deleterious mutations.
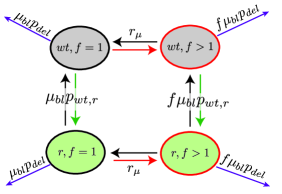
Since we assume that such loss occurs with uniform probability , when the overall genetic mutation rate of a cell is , the rate of deleterious mutations is given by . Note that when is high, increases in carry a higher penalty, implying that for hypermutation to be beneficial and counteract this penalty resistant phenotypes would have to be significantly advantageous either by having a much higher growth rate (intrinsic advantage) or, e.g., by occurring with a high probability or being initially present in relatively high proportions (extrinsic advantage). Fig. 1 shows a schematic od this model. We assume deterministic evolution under limited resources, as resources needed for growth are nearly always constrained in real biological systems, driving competition between organisms consuming the same resources. The equations governing the time evolution of this system are given by
| (1) | ||||
where , , , and a stationary population distribution is established when the total population size reaches the resource capacity . Note that faster-growing phenotypes will also produce exponentially more deleterious mutants as a result of their more frequent divisions, resulting in the previously noted fitness tradeoff. The four-dimensional system (Fig. 1) of Eqn. (1) is given explicitly in Appendix A. We consider here the case where the effect of selective pressure is limited to selecting for hypermutant variants if they are advantageous but not directly inducing hypermutability (for work on the latter see e.g., phillips1987induction ; piddock1987induction ; ysern1990induction ; ren1999escherichia ; perez2005sos ). Under this assumption, hypermutation occurs independently of selective pressure and therefore some proportion of the initial-state population would be expected to already exhibis elevated mutation rates. We assume in all that follows that cells with elevated mutation rates constitute of the total initial population (distributed in proportion to the phenotype distribution) and a corresponding rate at which hypermutation-conferring mutations occur of of cells per generation (see Appendix B for an extended discussion of these parameter choices).
III Sensitivity of evolutionary success to the mutation rate
The ability of a population to survive evolutionary pressure depends on the extent to which resistant phenotypes come to dominate it and withstand potential subsequent applications of the stressor (e.g. in a serial dilutions experiment). To understand how mutation rate affects this we consider how the stationary-state ratio of resistant cells in the population, , at elevated mutation rates compares with this ratio if all mutations in the system were restricted to occur at the baseline rate ,
| (2) |
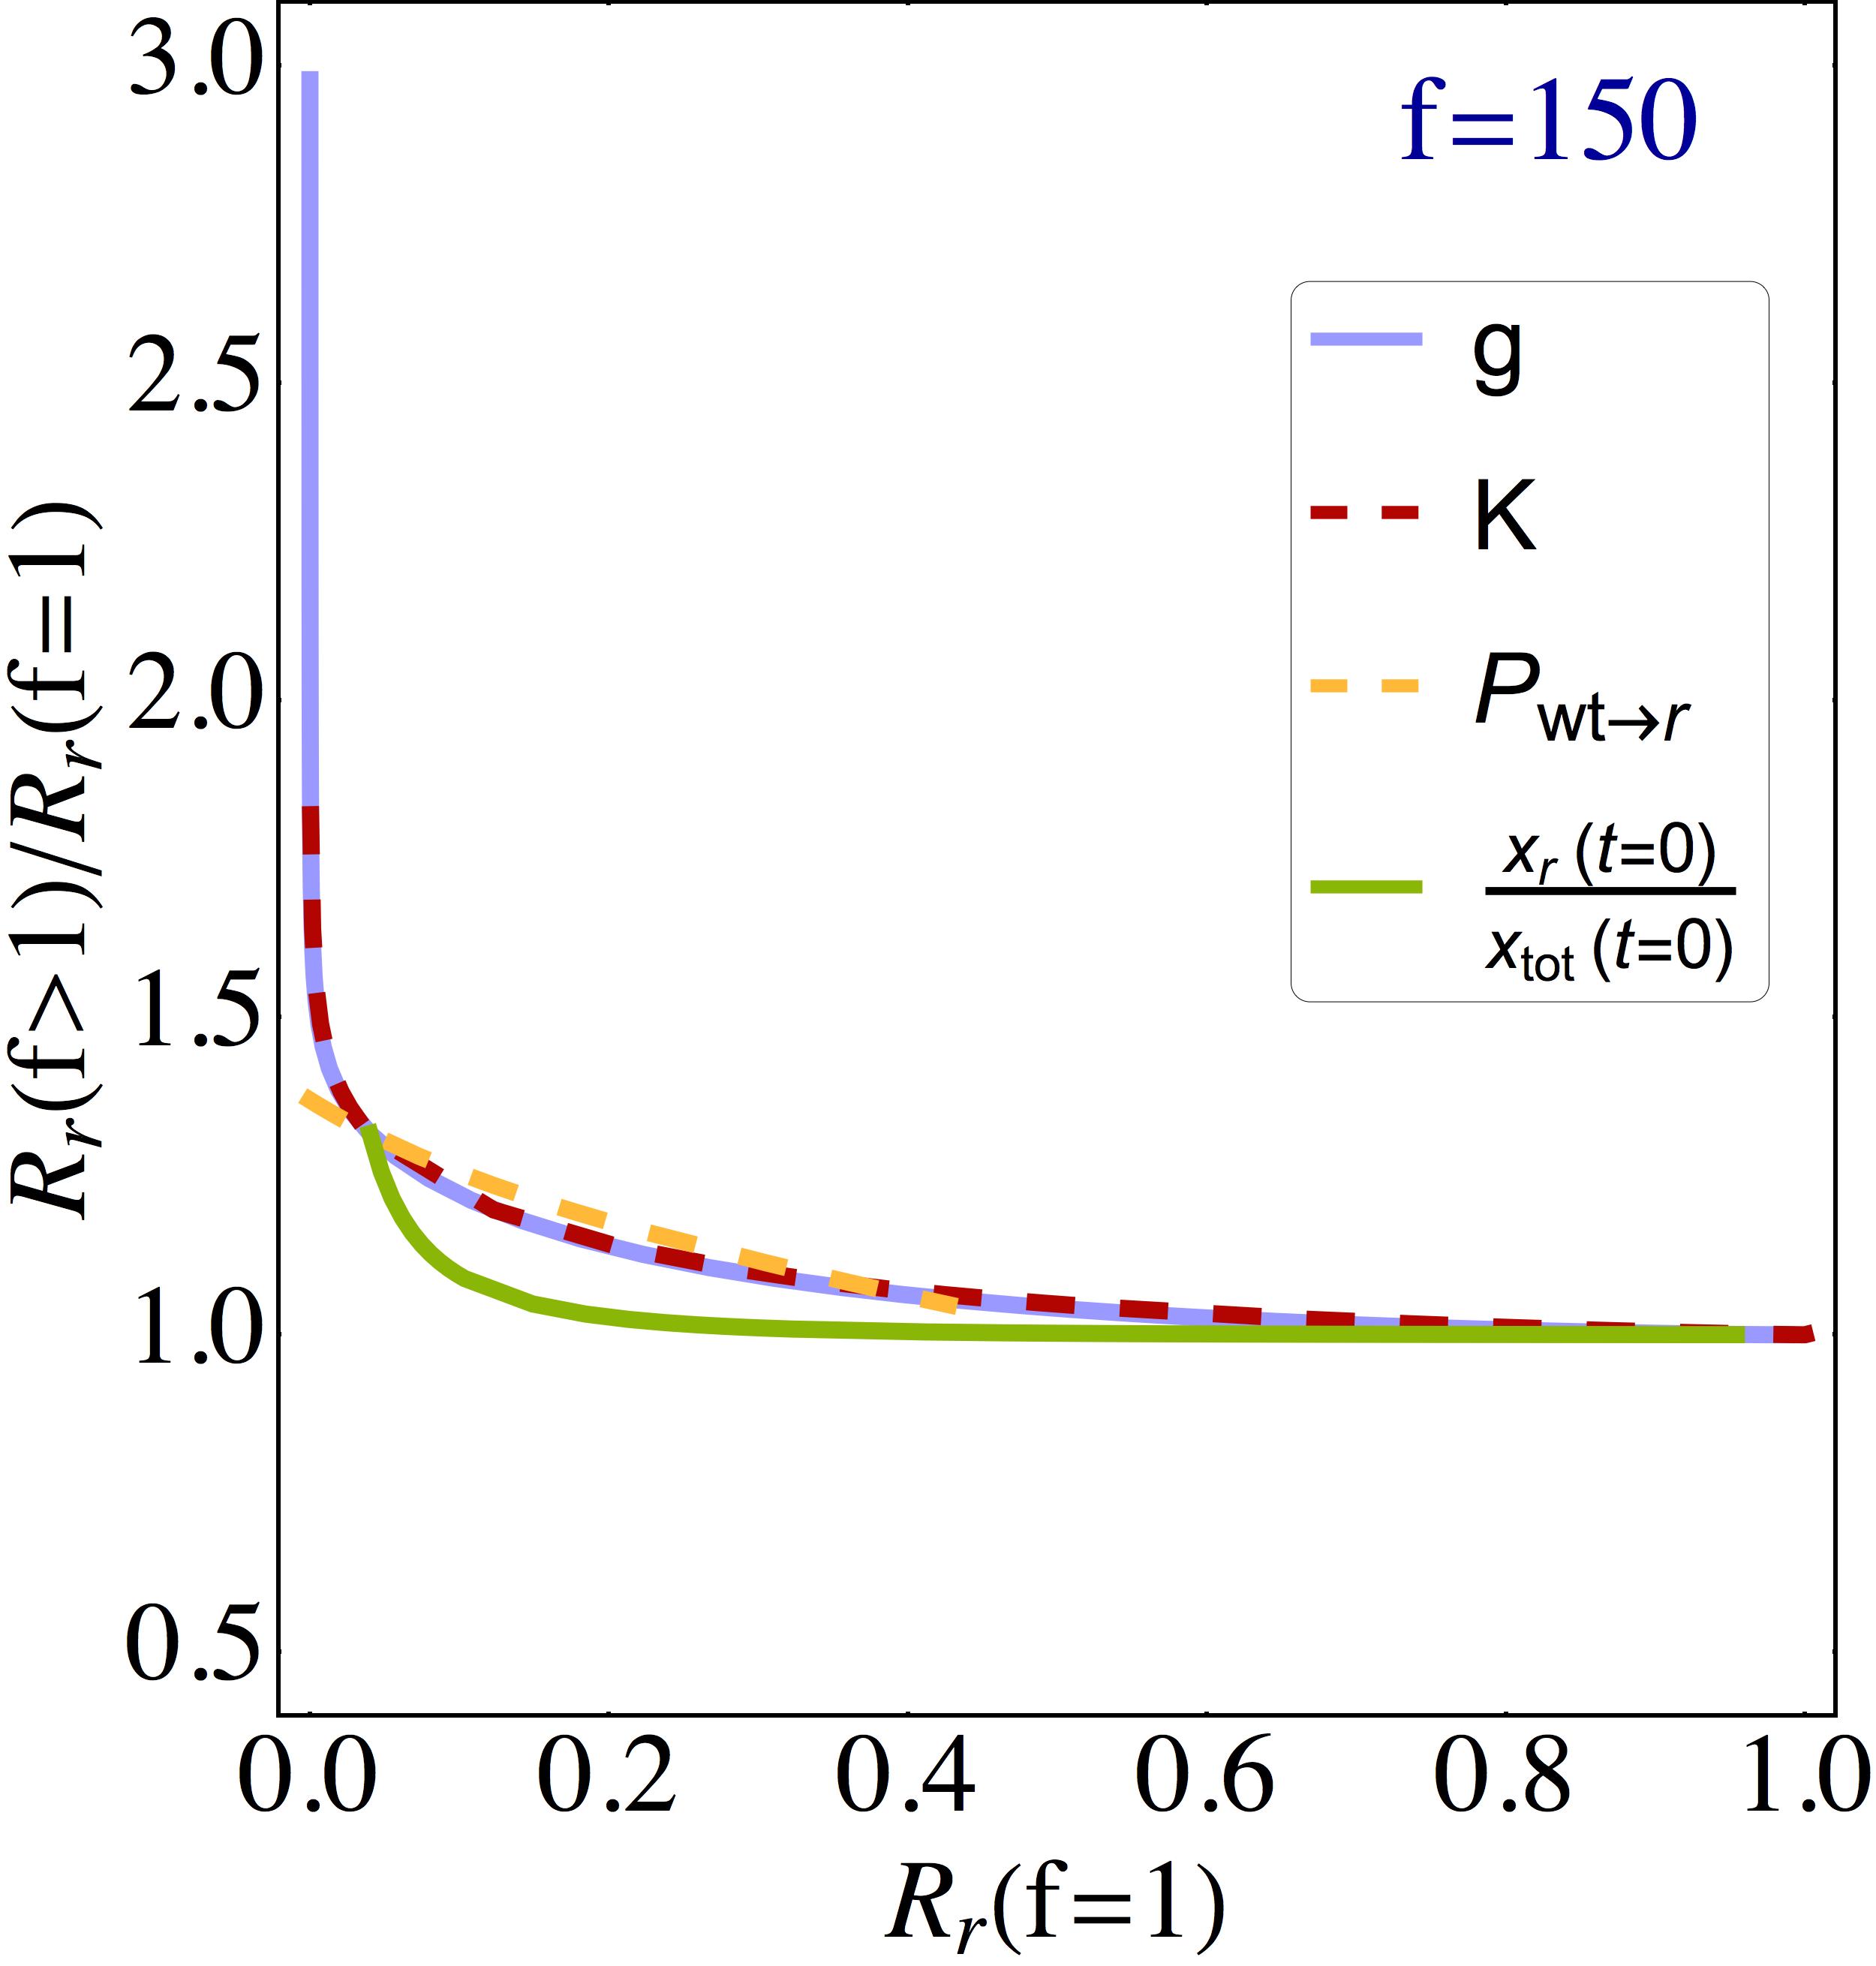
as a function of the main parameters that arise in our model, . The ratio (2) represents the extent to which a particular (elevated) mutation rate is able to drive a successful evolutionary outcome: a larger proportion of resistant cells in the stationary-state distribution. We refer to this as the sensitivity of evolutionary success to the mutation rate. In Fig. 2(a) we show how this sensitivity correlates with our measure of baseline “evolutionary advantage” of the resistant mutant, , as different components of are varied222Since we consider here deterministic dynamics, the ratio directly projects to the stationary state and should therefore be viewed as both a final outcome (at stationary-state) as well as an indicator of the evolutionary advantage conferred by the system’s intrinsic and extrinsic conditions.. For each of these model parameters we see that at some fixed mutation rate (show in the plot is a 150-fold increase over the baseline) sensitivity to the elevation in mutation rate is highest at low (but positive) levels of the resistant mutant’s evolutionary advantage; it decreases and eventually becomes negligible () as its evolutionary advantage increases.
Before proceeding in our analysis, we consider how the different parameters in are in fact indicative of evolutionary advantage: while it is clear how a higher growth rate , a larger initial proportion , and a higher non-deleterious mutation rate lead to advantageous conditions for the resistant mutant to increase its proportions in the population, it is perhaps less obvious why a higher resource capacity produces an advantage specifically for the resistant mutant given that resource utilization is uniform in our model among the two phenotypes. The reason for this is that while the resource capacity appears a priori to be a non-selective environmental stressor, due to the exponential growth phase involved in the evolution of the system (1), higher resource capacity puts off the time of resource saturation, thus compounding the advantage enjoyed by phenotypes with higher growth rate .
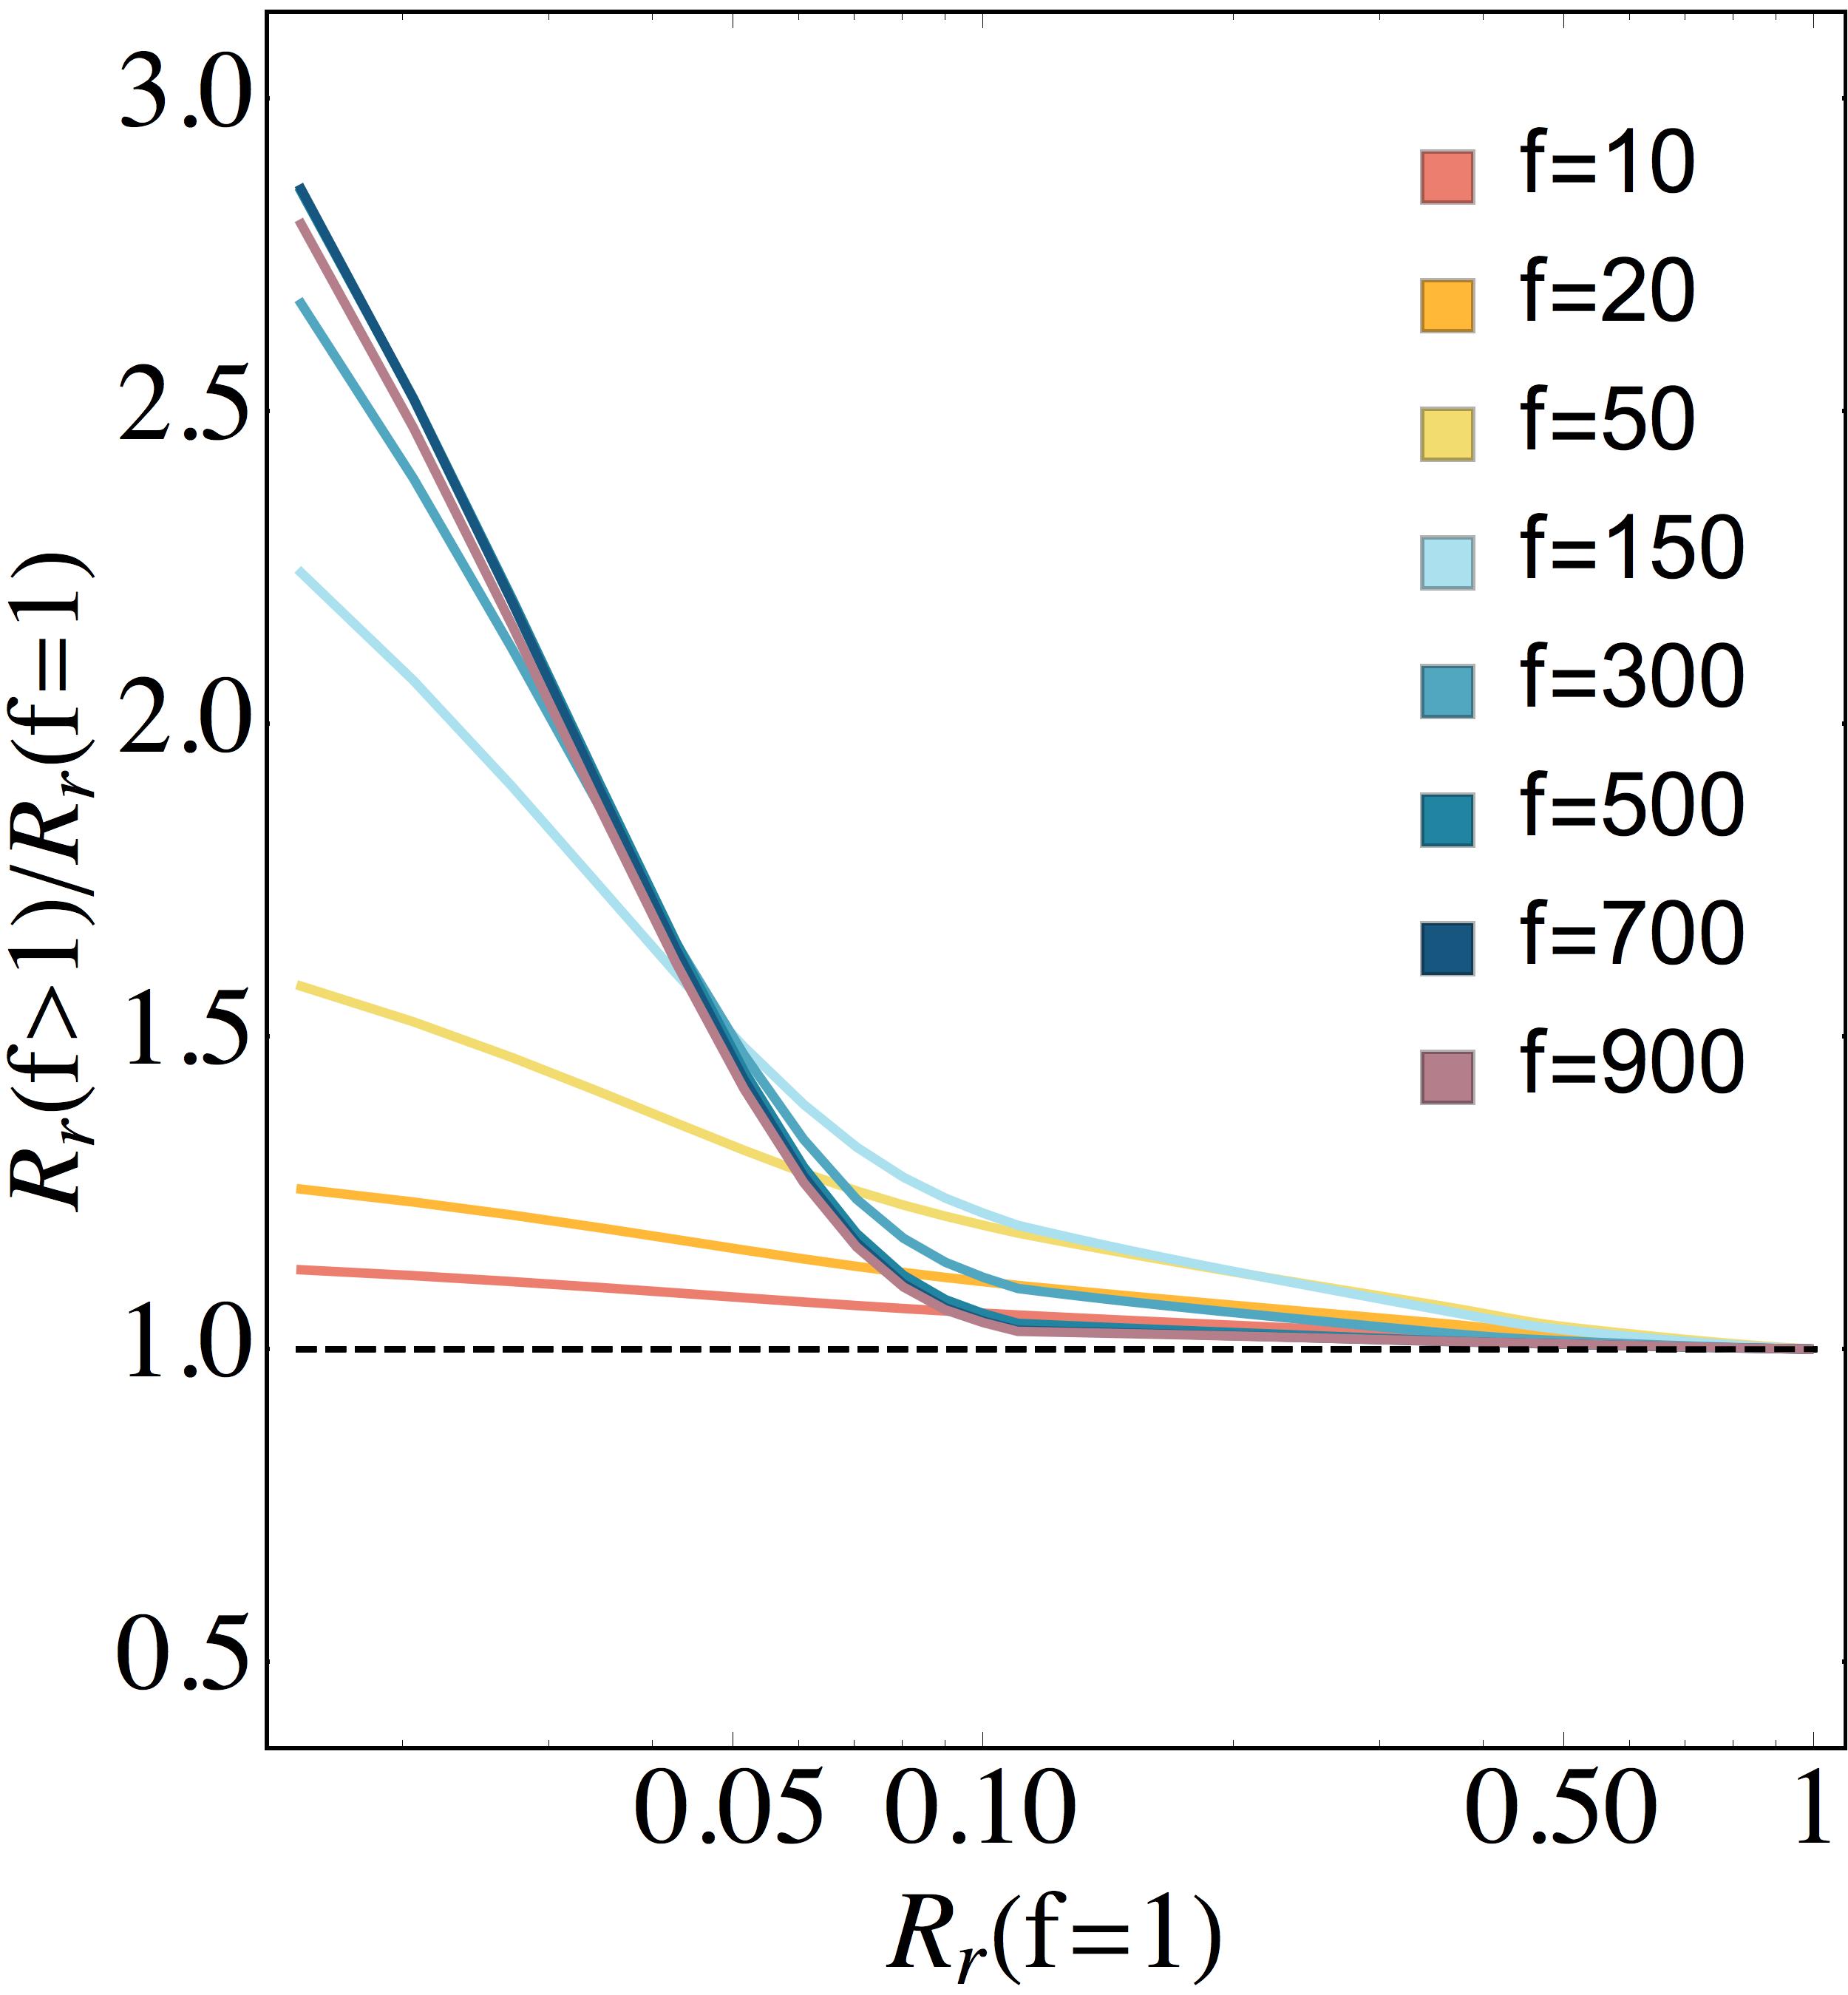
By averaging over individual- interpolations (Fig. 2(b)) and varying (Fig. 2(c) and 2(d)) we observe that the largest impact of the presence of elevated mutation rates in the population is under parameter combinations that, due to any one or multiple advantage-determining parameters, result in the resistant phenotype having a weak advantage. In these circumstances the evolutionary advantage of the resistant cells may be insufficient to establish these populations in high proportions due to competition for limited resources, and certain increases in the mutation rate may thus be critical for adaptation, even at the cost of increased deleterious mutations. When initial conditions confer a high advantage on the resistant phenotype, mutation rate increases offer negligible to negative benefit. The high growth rate of these populations and hence frequent cell divisions imply that increases in their mutation rate also drive approximately-exponentially increases in deleterious mutations, and that when a strong advantage exists the baseline-mutation phenotype will thus rise to fixation faster than its hypermutant counterpart.
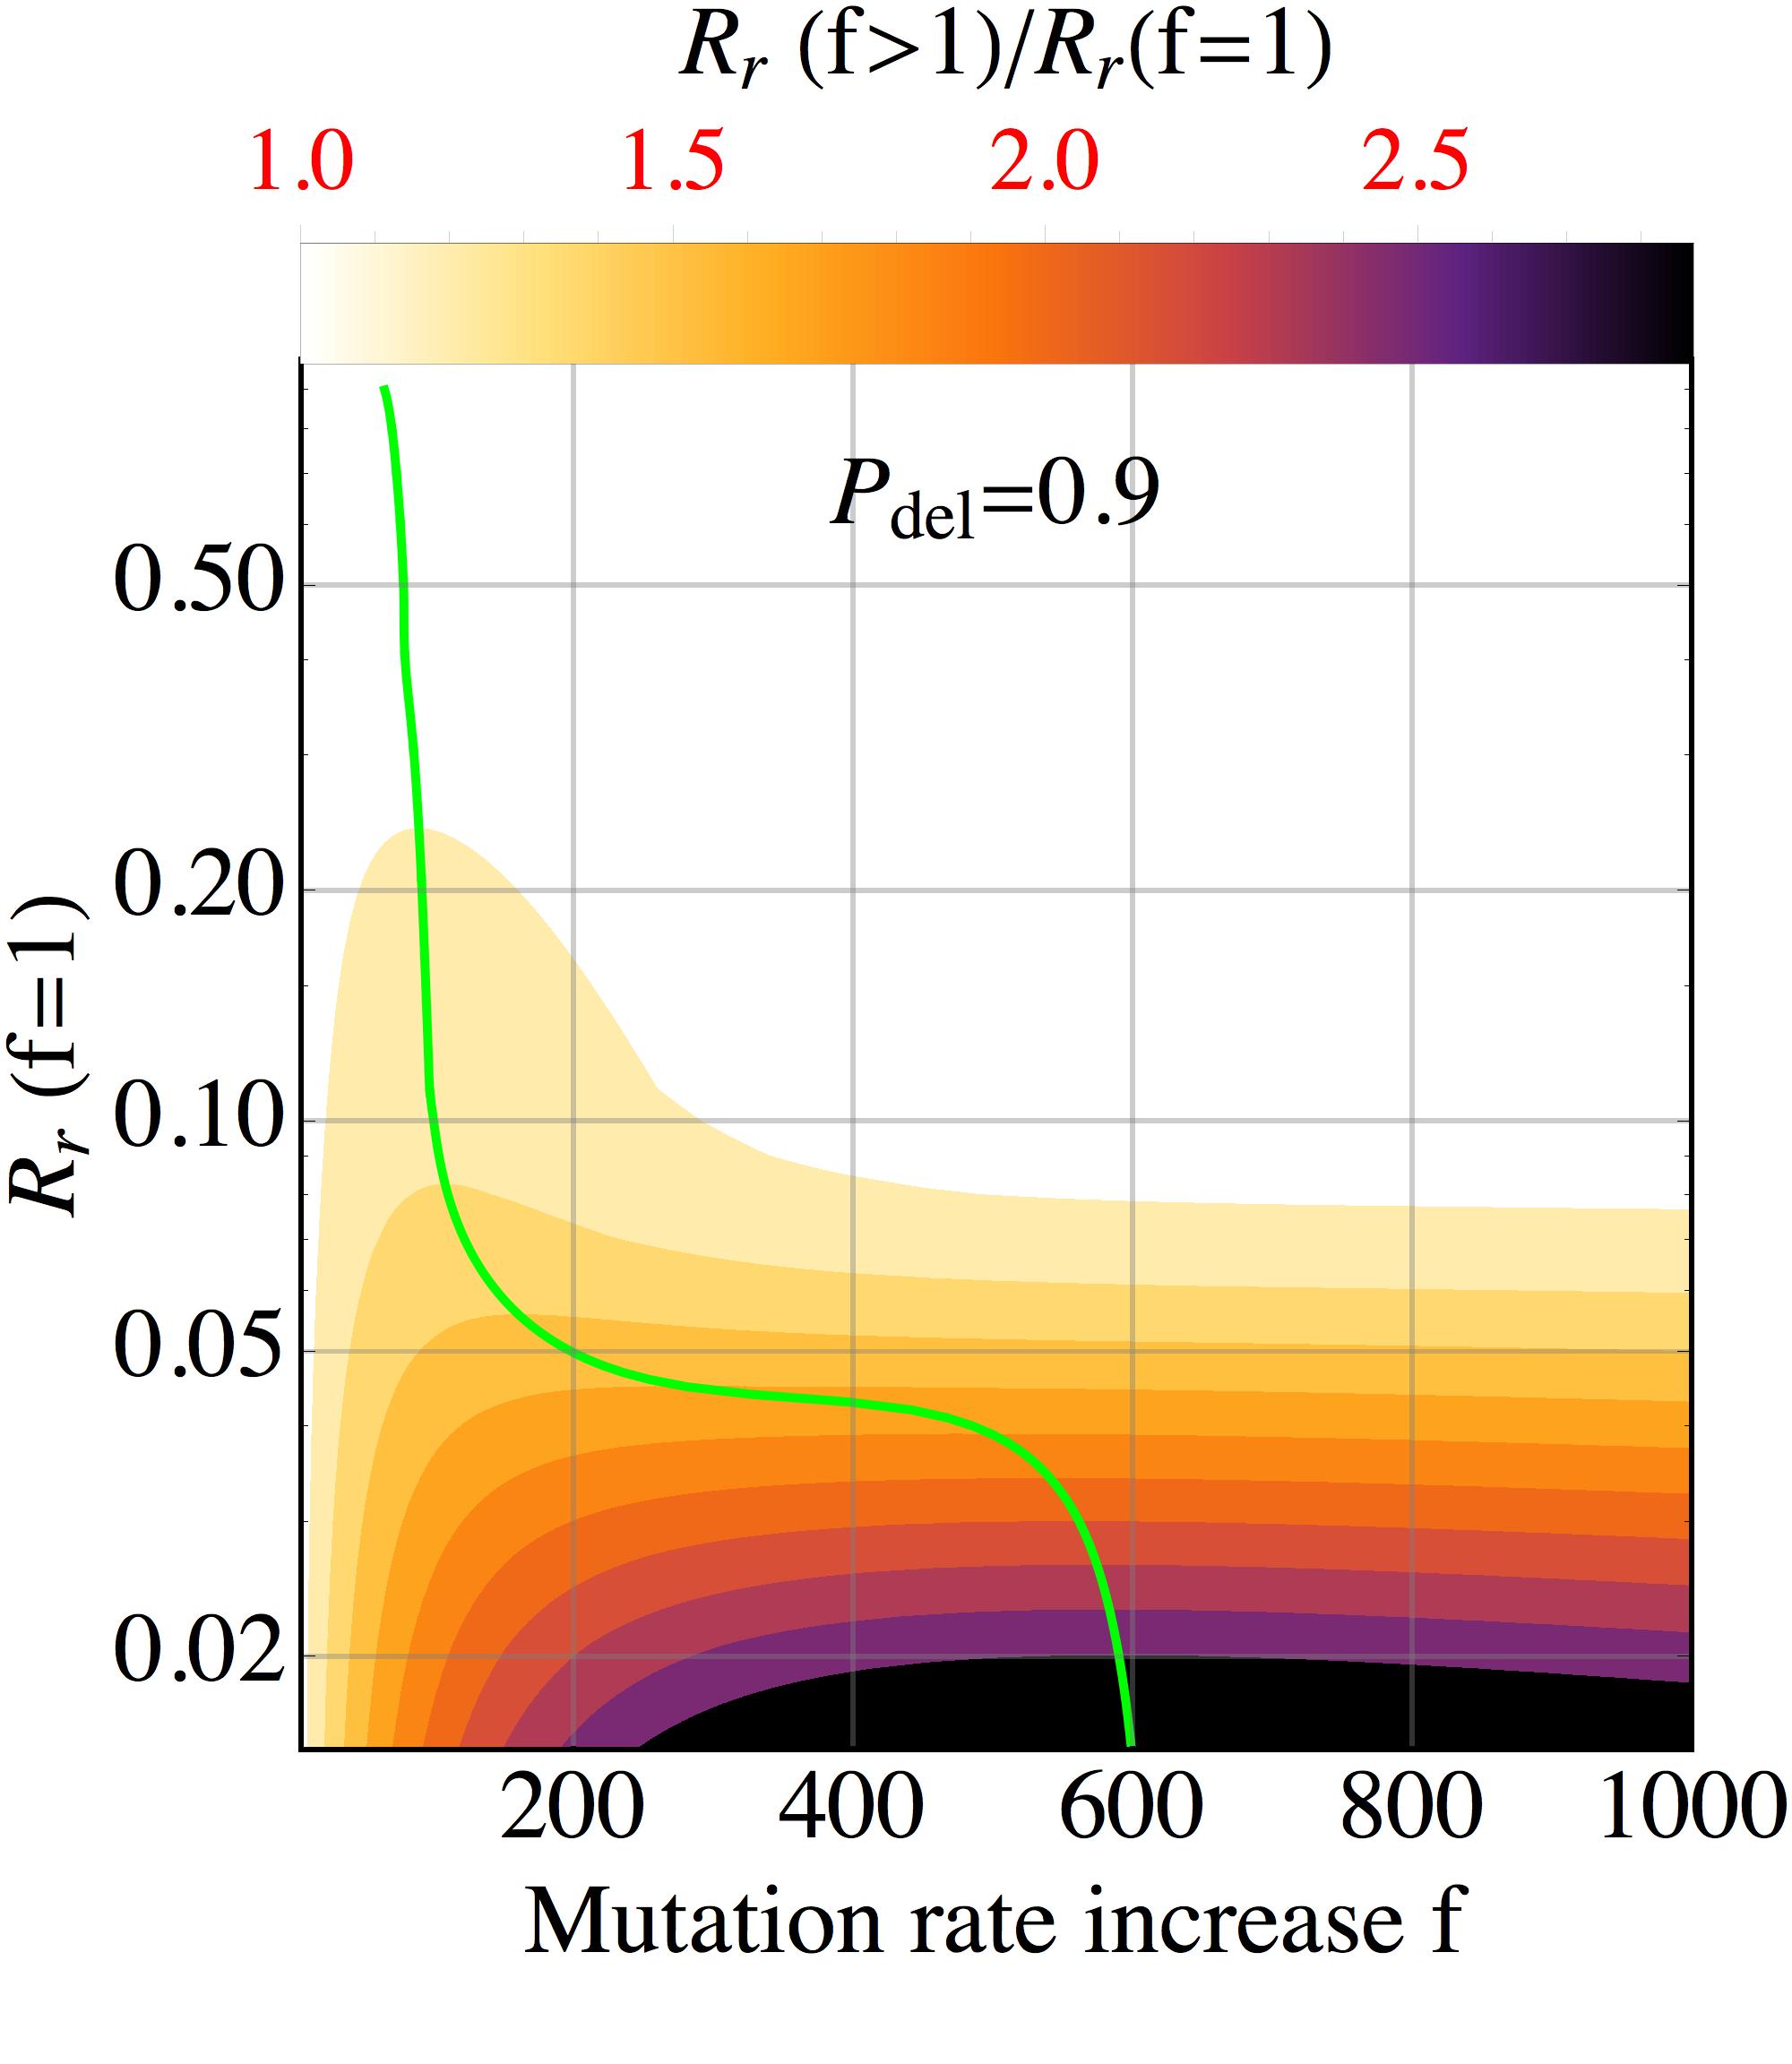
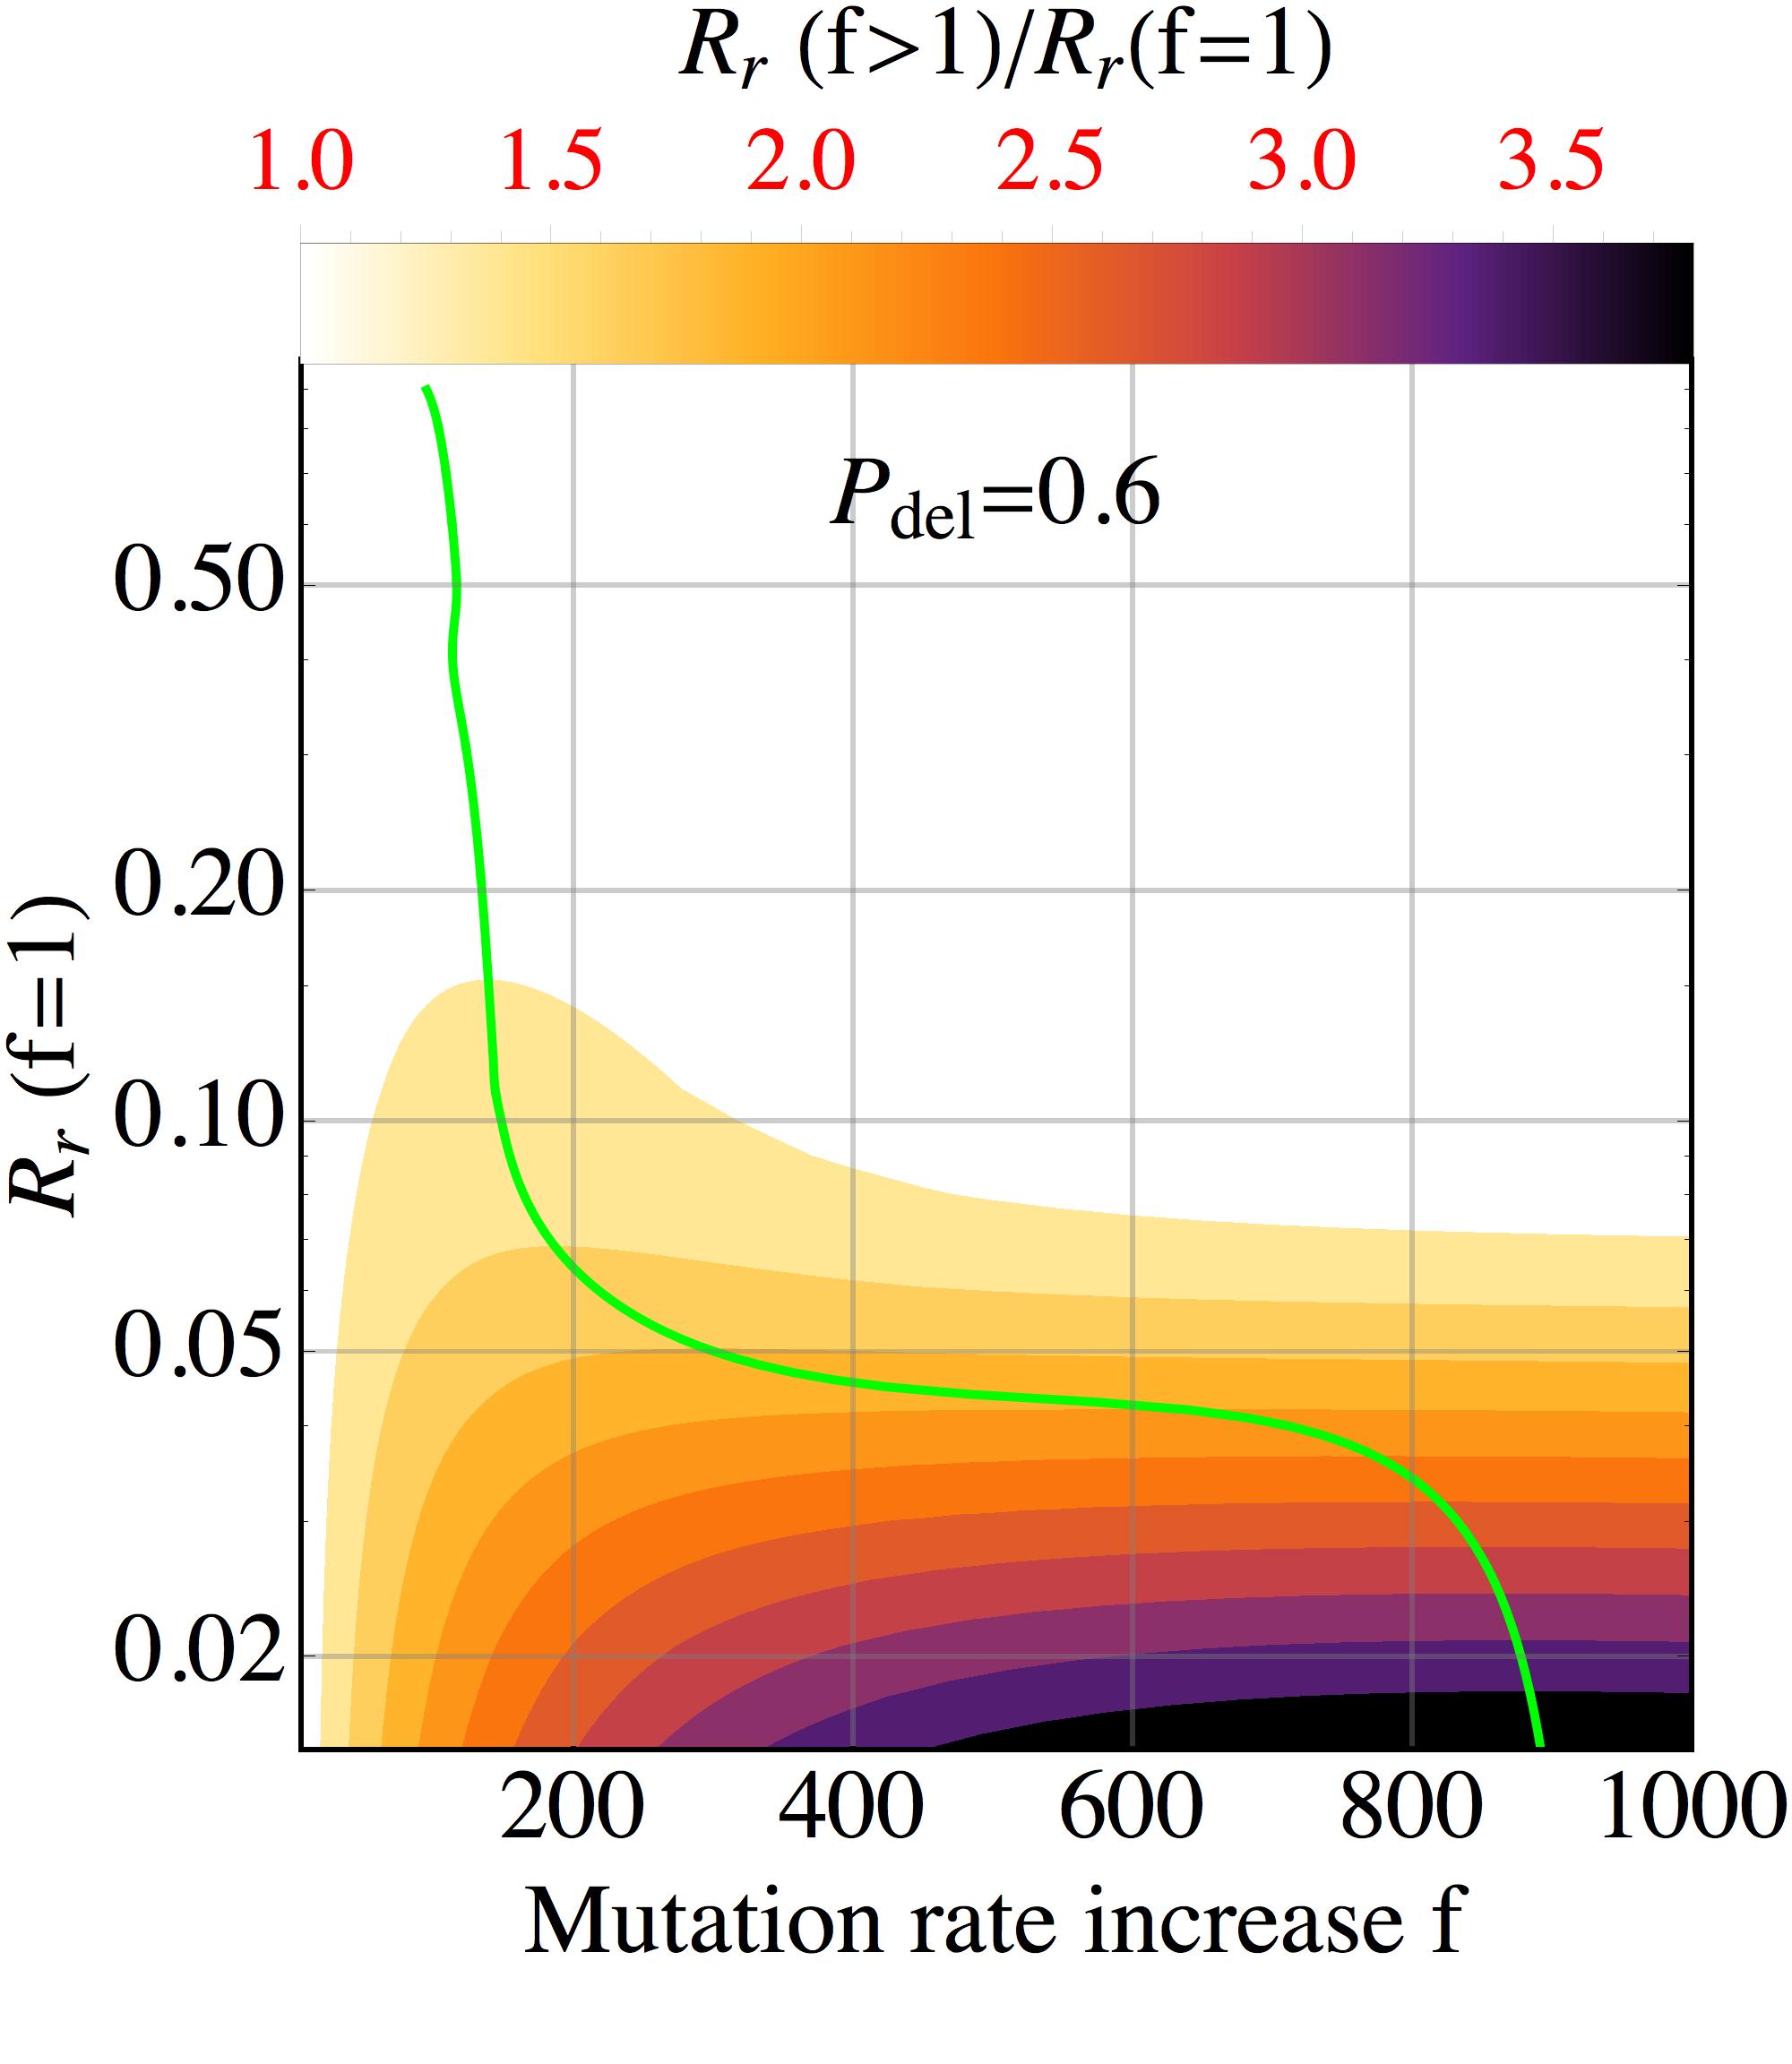
As shown in the contour plots of Fig. 2(c) () and 2(d) (), for any level of resistant mutant evolutionary advantage, there exists an optimal mutation rate (green curves) yielding the highest proportion of resistant cells. Increasing the mutation rate up to this rate provides substantial benefit for lower-advantage mutants, and further increases lead to diminishing (albeit more gradually) returns due to the tradeoff with an increased loss caused by deleterious mutations. We see (Fig. 2(c) compared to 2(d)) that the level of evolutionary advantage past which there is no gain from hypermutation is fairly robust to variations in the rate of deleterious mutations (), but a lower extends the range of mutation rates conferring benefit, as in that case there is little loss to deleterious mutations even at high .
IV Effect of selective pressure on mutation rate sensitivity and on genetic hitchhiking
In this section we focus on the effect of selective pressure in the form of an antibiotic that inhibits bacterial growth and quantify how the extent of selective pressure – different antibiotic conentrations – affects the sensitivity of evolutionary outcome to the mutation rate. The effect of antibiotic concentration on this quantity arises from the respective dependences of the phenotypes’ growth rates on this concentration. Motivated by work rodrigues2016biophysical on the response of E. coli to variations in the dosage of trimethoprim, a competitive inhibitor of dihydrofolate reductase, we assume a hyperbolic decay functional dependence for the growth rate on the inhibitor concentration
| (3) |
where is the growth rate in the absence of an inhibitor and controls the extent to which the population may grow in the presence of the inhibitor. In rodrigues2016biophysical this functional dependence, with and given explicitly as functions of various protein biophysical and cellular properties, was shown to agree with experimental measurements for several mutant phenotypes over a range of , and similar methods can in principle be used to derive and from biophysical principles for a wider range of biologically-relevant scenarios.
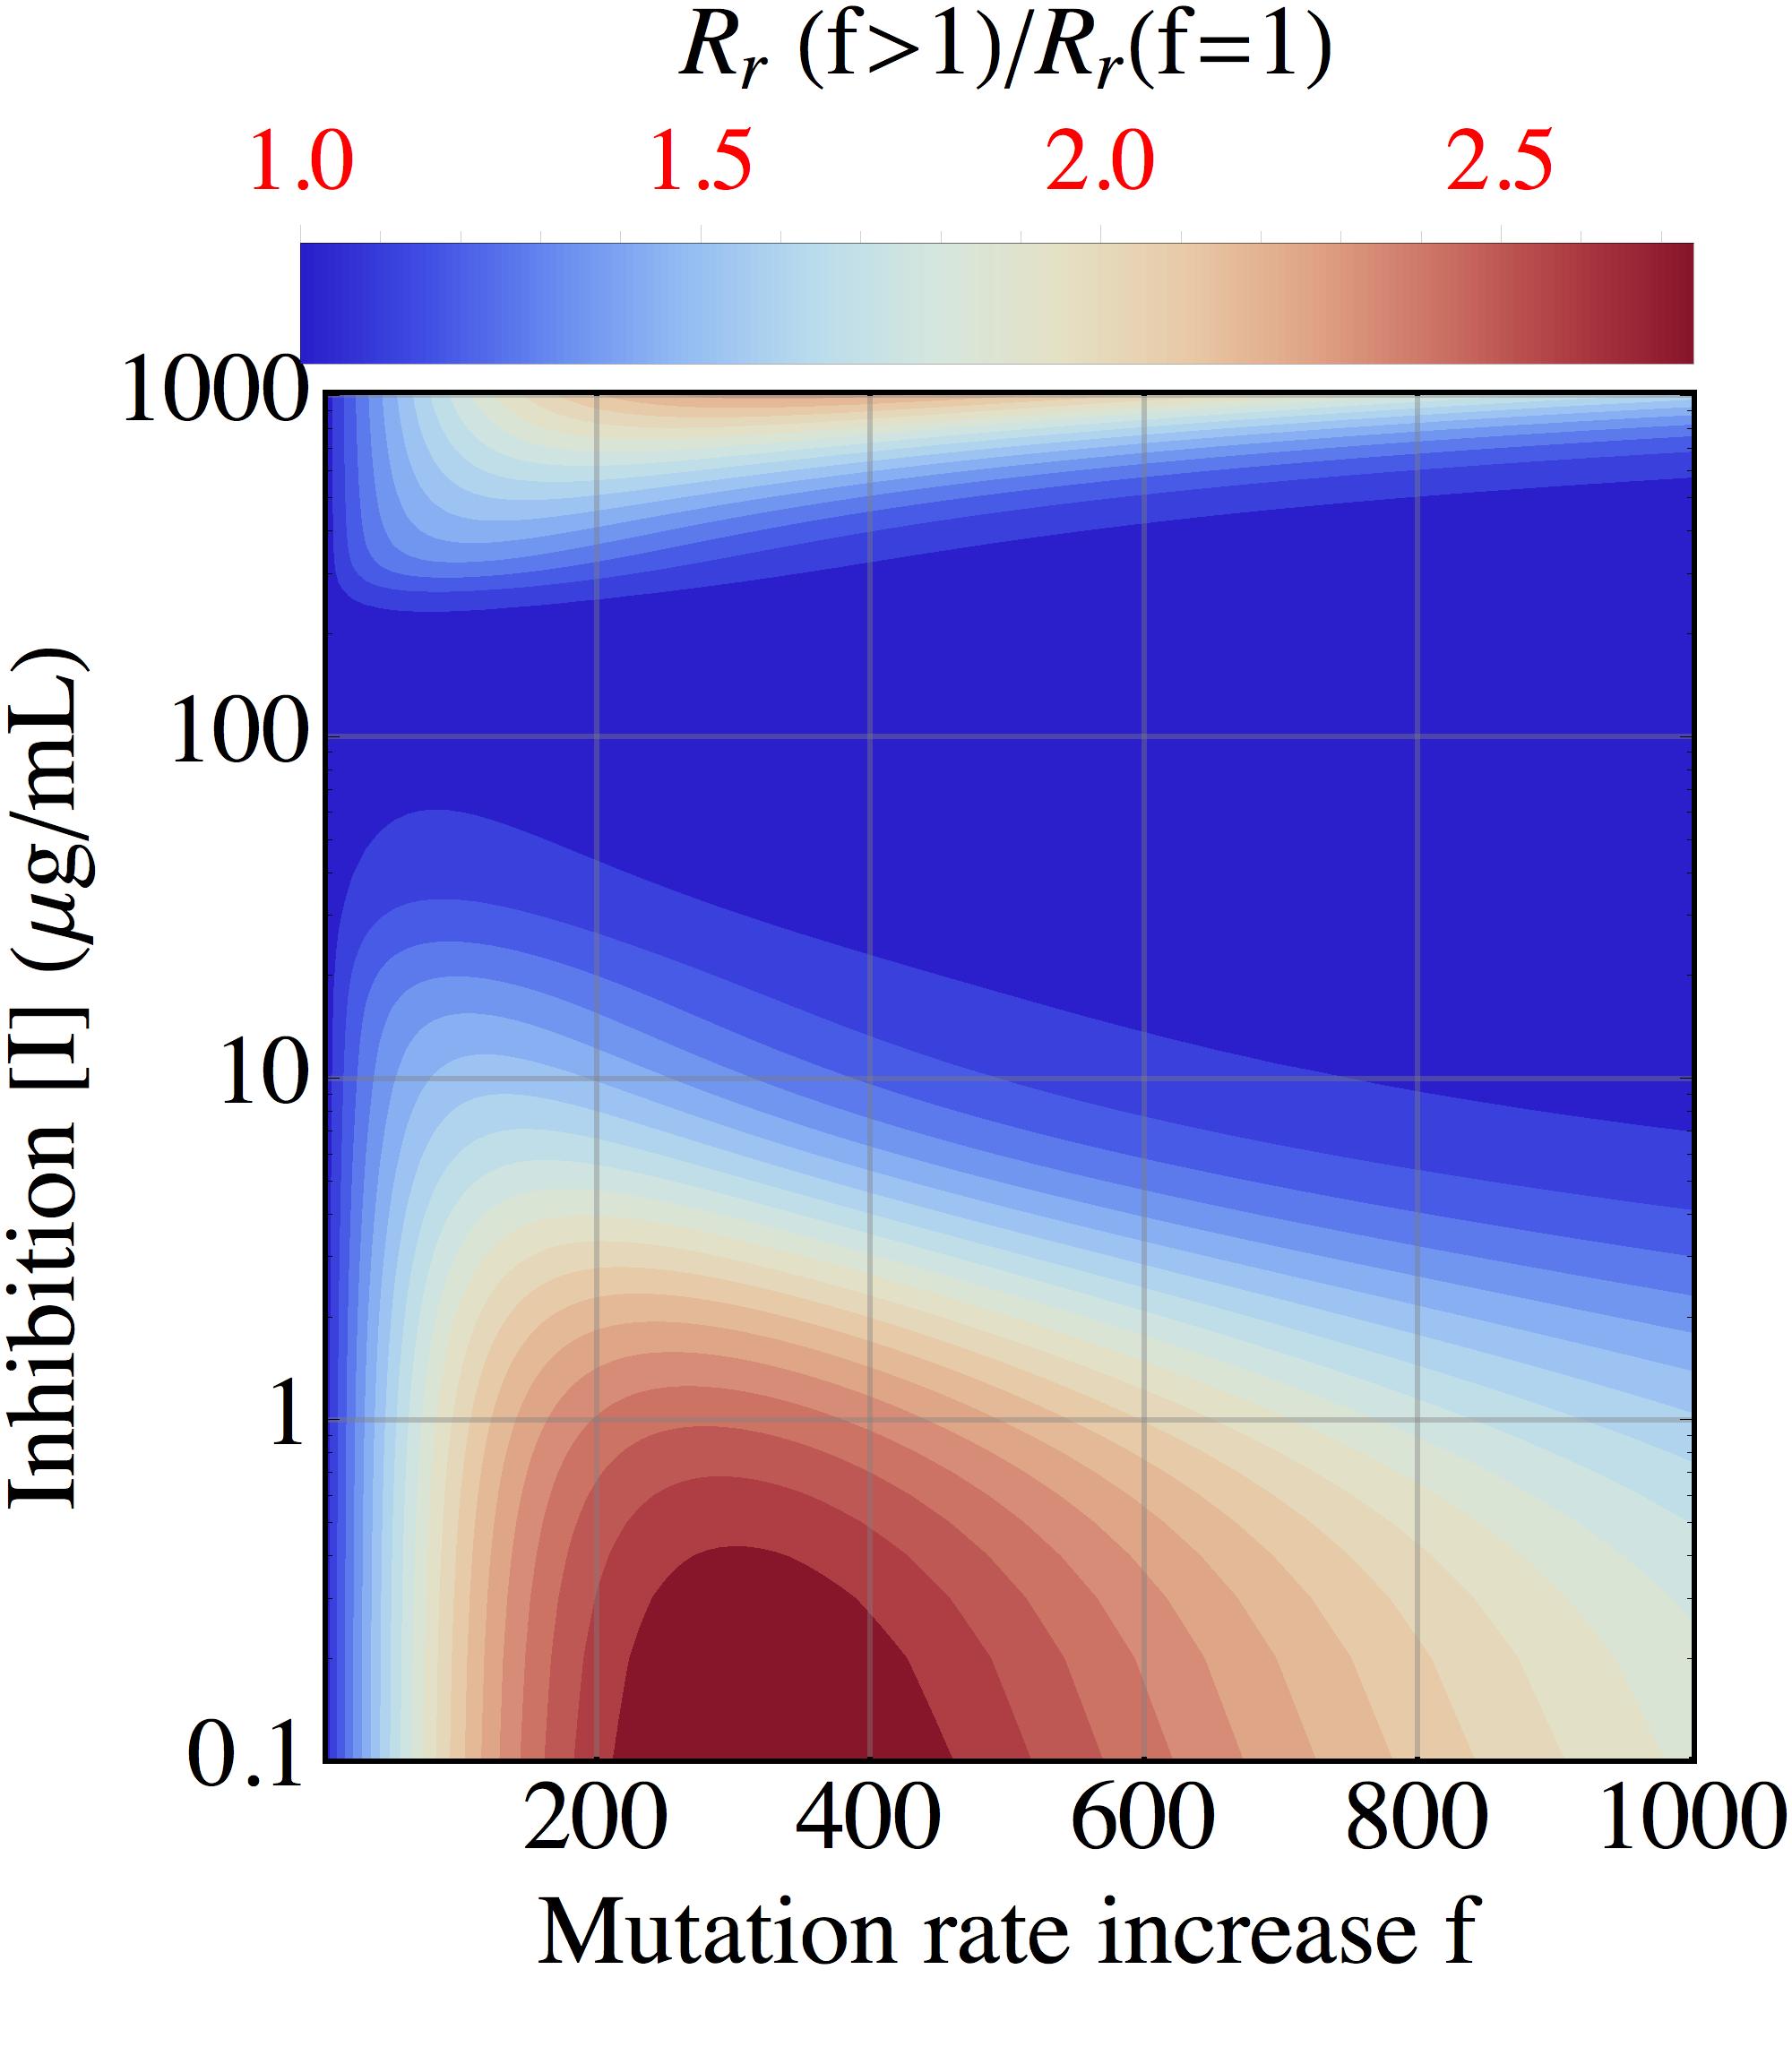
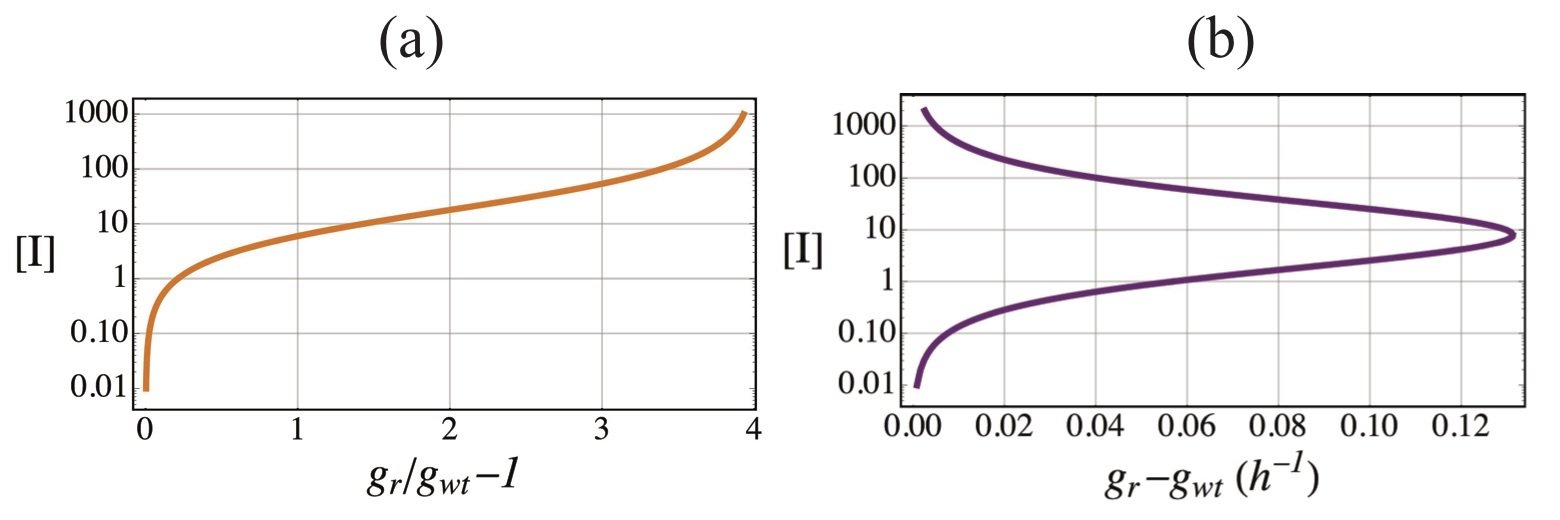
By computing the sensitivity to mutation rate, Eqn. (2), as a function of only the inhibitor with other parameters held fixed, we show (Fig. 3(a)) that at low levels of inhibition, where carries only a small fitness advantage and mutant and wildtype growth rates are similar, there is substantial benefit to be gained from hypermutation. As inhibition is increased the difference between mutant and wildtype growth increases, resulting in the resistant mutant easily increasing in proportions without much benefit from hypermutation; but at yet higher levels of inhibition the role of elevated mutation rates in determining adaptation once again becomes significant. The behavior of the (intrinsic) selection coefficient is not revealing in this respect: it monotonically approaches a constant value at high . However, the difference between and peaks at an intermediate value of and decreases at lower and higher values of (Fig. 4). While the peak does not numerically coincide with the concentrations yielding the lowest , we note that additional parameters in also affect this ratio.
We next consider the extent to which selective pressure, the antibiotic, affects the extent of hypermutation in the population by computing the stationary-state proportion of hypermutants in the population when an inhibitor is applied (resistant cells have a positive evolutionary advantage) relative to when no inhibition is present (neutral selection),
| (4) |
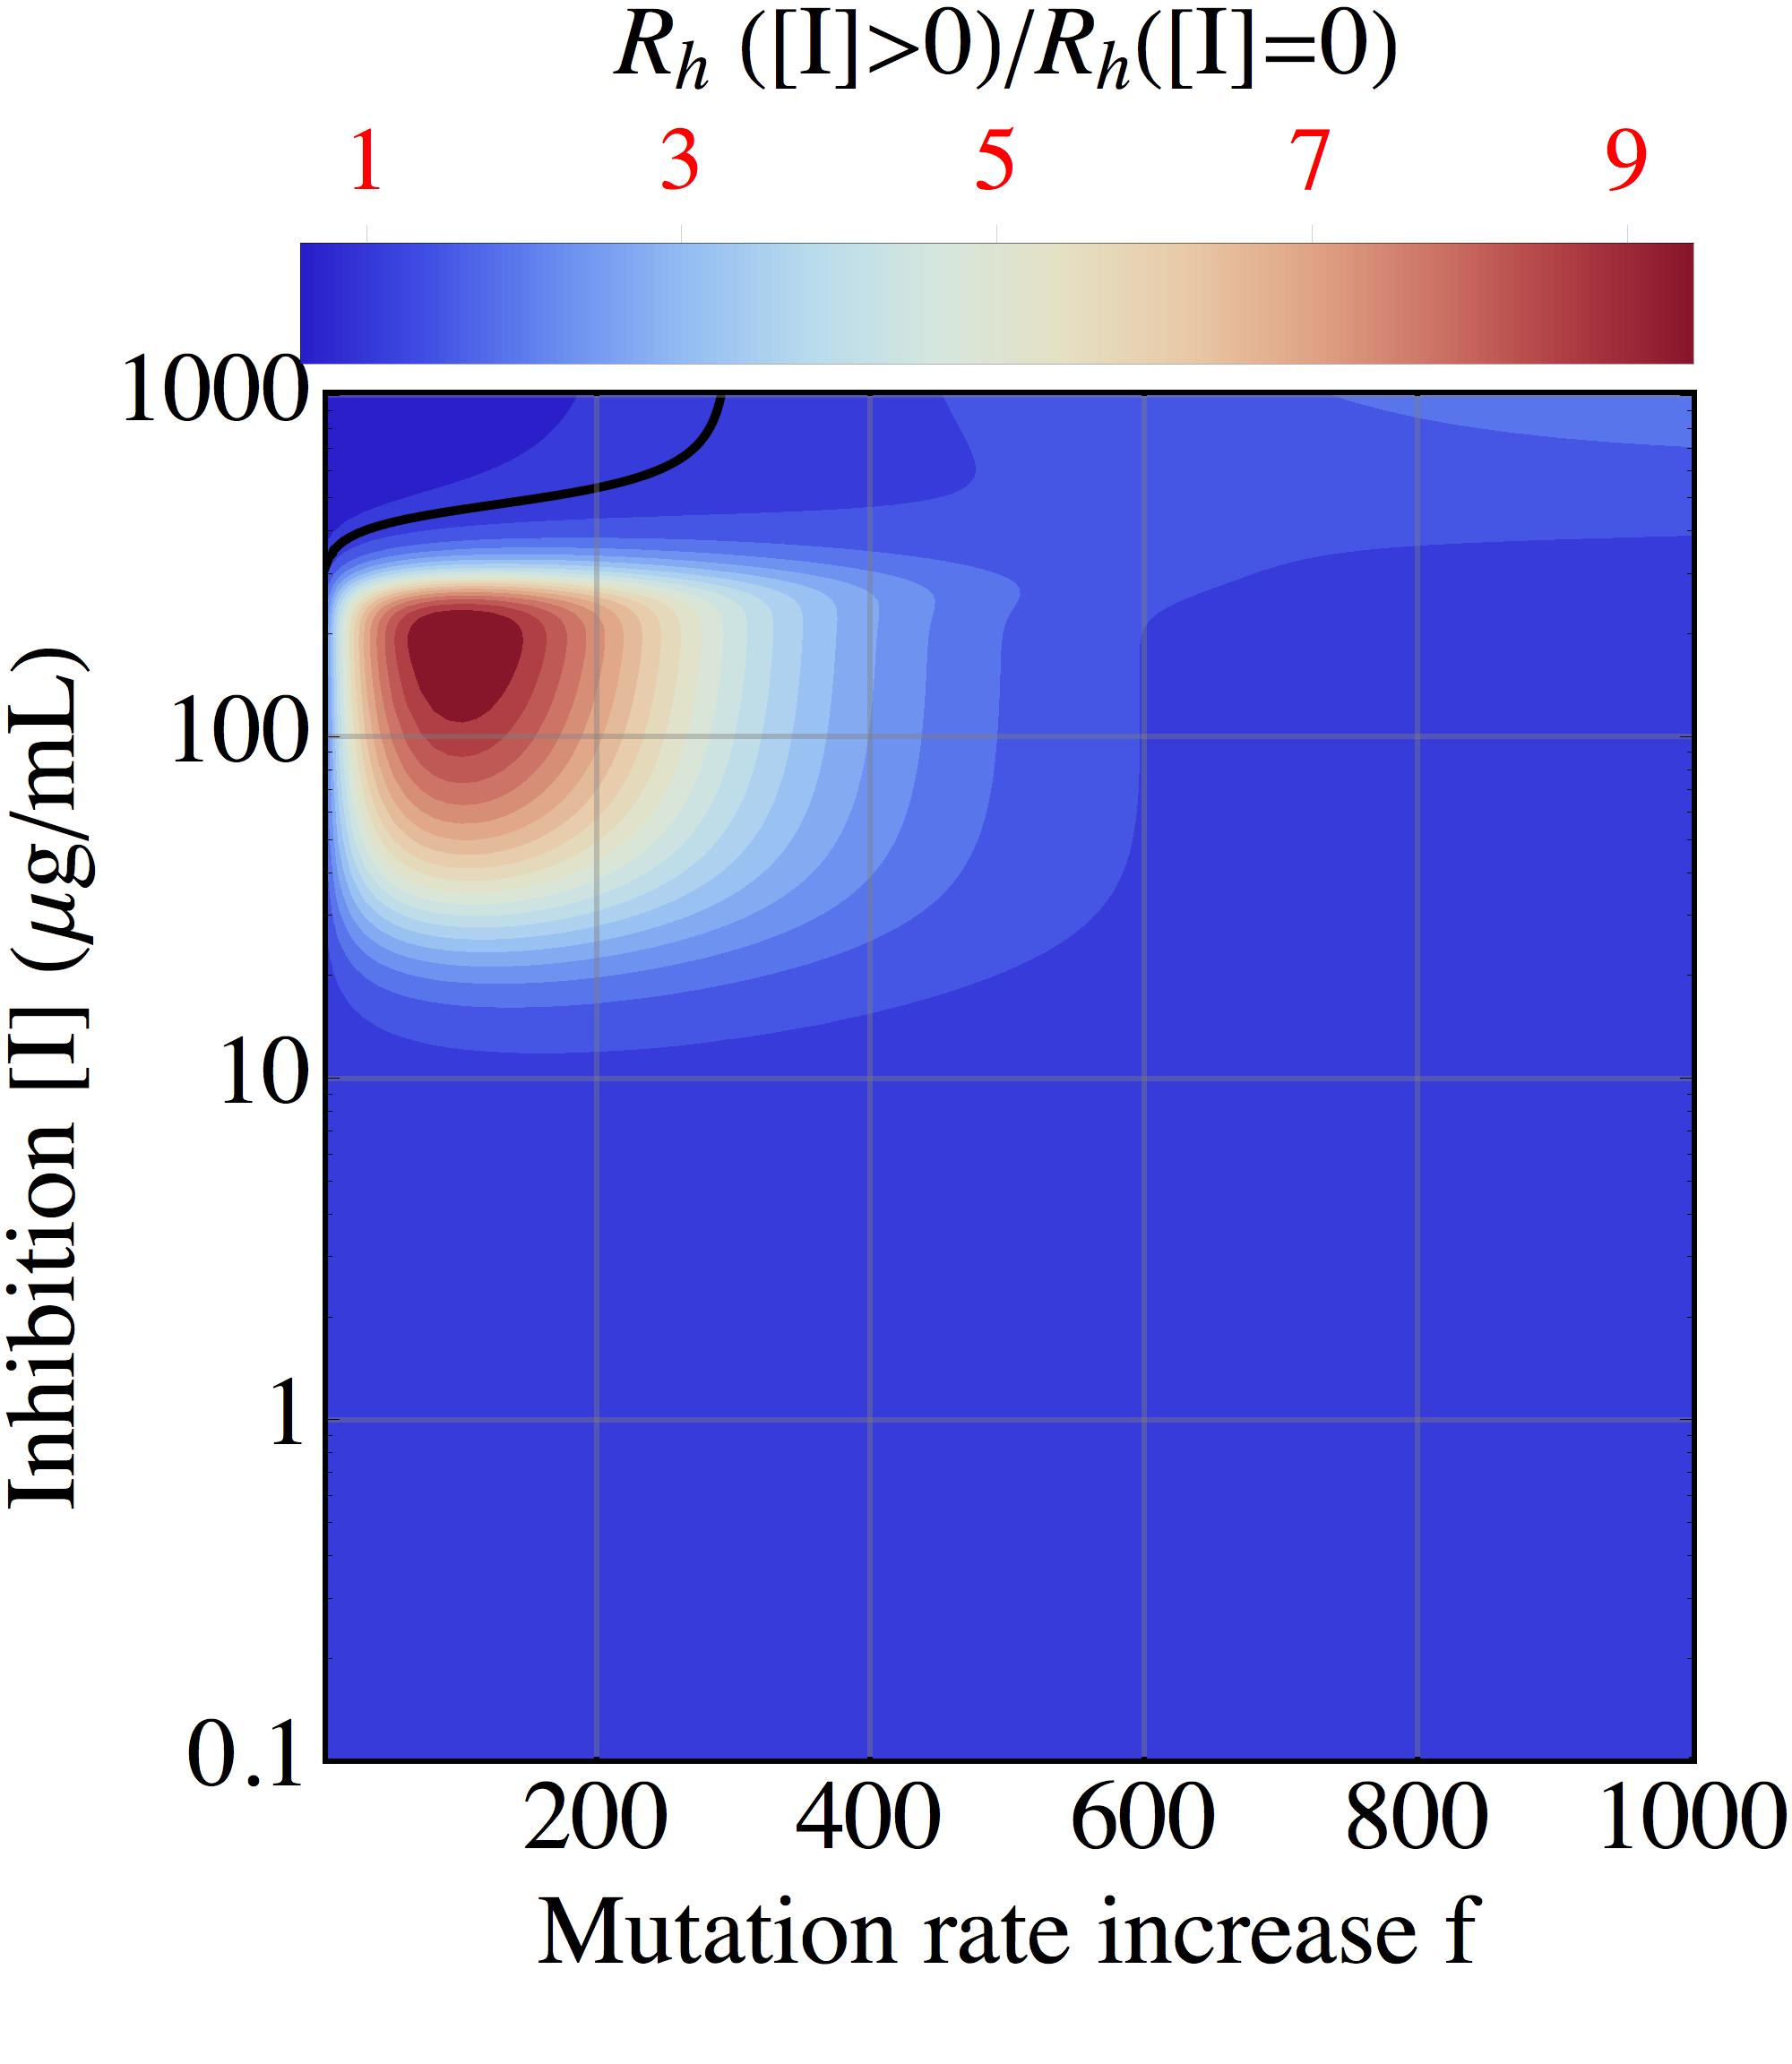
as a function of the inhibition (fig. 3(a)). Fig. 3(b) shows contours of in a two-dimensional space of and . We find (Fig. 3(b)) that genetic hitchhiking on resistant mutations as measured by is most pronounced in a phase space that up to intermediate mutation rate increases is approximately complementary to that in which hypermutation has the most pronounced beneficial effects. This effect can be explained by noting that at low inhibition, where the resistant mutant does not have significant advantage over wildtype, the acquisition of such mutations does not drastically increase the growth rate of hypermutant cells; on the other hand, when resistant mutations are highly advantageous (high inhibition), the baseline-mutation resistant mutant rises to fixation largely unaided by hypermutation, which under finite resources limits the growth potential of other subpopulations (resistant hypermutants). We note that the range of mutation rates at which we observe hitchhiking to be strongest is in keeping with experimental observations (see hall2006hypermutable for a review and robert2018mutation for additional recent data) of a increase over baseline in E. coli clinical isolates (with some data pointing to a nearly in certain cases pang1985identification ).
V Discussion
In obtaining the results presented here we assumed deterministic dynamics. While mutations typically arise randomly and can introduce a large degree of stochasticity into the dynamics, deterministic evolution can provide important insights into processes with varying degrees of stochasticity: large populations are expected to sample a large extent of the available mutational phase space (with infinite populations sampling every possible configuration, or genotype), and experimental work toprak2012evolutionary on evolutionary pathways in E. coli to drug resistance found similar mutational trajectories across populations evolved in parallel. Our deterministic results, moreover, suggest that stochastic fluctuations in the mutation rate can have an outsized effect on the stationary state of the system under a broad range of conditions that suppress the evolutionary advantage of emergent resistant populations. Knowledge of the effects of these conditions in conjunction with a quantitative understanding of how changes in a controllable selective pressure, such as we modeled here in the case of a growth inhibitor, are crucial for forming informed predictions on how variations in this main driving force of adaptation affect the dynamics of complex, high-dimensional systems and on how to best minimize the effects of stochastic fluctuations to establish a desired evolutionary outcome, such as a clinical antibiotic protocol minimizing the risk of resistance evolution.
Acknowledgments
We are grateful to João Rodrigues for providing data on E. coli growth curves and to Michael Manhart for helpful discussions. We acknowledge support from NIGMS of the National Institutes of Health under award numbers 1R01GM124044-01 and 5R01GM068670-14.
References
- (1) M. Lynch, M. S. Ackerman, J.-F. Gout, H. Long, W. Sung, W. K. Thomas, and P. L. Foster, “Genetic drift, selection and the evolution of the mutation rate,” Nature Reviews Genetics 17 no. 11, (2016) 704–714.
- (2) E. Denamur and I. Matic, “Evolution of mutation rates in bacteria,” Molecular microbiology 60 no. 4, (2006) 820–827.
- (3) J. A. G. de Visser, “The fate of microbial mutators,” Microbiology 148 no. 5, (2002) 1247–1252.
- (4) P. D. Sniegowski, P. J. Gerrish, T. Johnson, A. Shaver, et al., “The evolution of mutation rates: separating causes from consequences,” Bioessays 22 no. 12, (2000) 1057–1066.
- (5) F. Taddei, M. Radman, J. Maynard-Smith, B. Toupance, P.-H. Gouyon, and B. Godelle, “Role of mutator alleles in adaptive evolution,” Nature 387 no. 6634, (1997) 700–702.
- (6) H. Lee, E. Popodi, H. Tang, and P. L. Foster, “Rate and molecular spectrum of spontaneous mutations in the bacterium escherichia coli as determined by whole-genome sequencing,” Proceedings of the National Academy of Sciences 109 no. 41, (2012) E2774–E2783.
- (7) J. W. Drake, B. Charlesworth, D. Charlesworth, and J. F. Crow, “Rates of spontaneous mutation,” Genetics 148 no. 4, (1998) 1667–1686.
- (8) M. D. Gross and E. C. Siegel, “Incidence of mutator strains in escherichia coli and coliforms in nature,” Mutation Research Letters 91 no. 2, (1981) 107–110.
- (9) J. E. LeClerc, B. Li, W. L. Payne, T. A. Cebula, et al., “High mutation frequencies among escherichia coli and salmonella pathogens,” Science 274 no. 5290, (1996) 1208–1211.
- (10) I. Matic, M. Radman, F. Taddei, B. Picard, C. Doit, E. Bingen, E. Denamur, and J. Elion, “Highly variable mutation rates in commensal and pathogenic escherichia coli,” Science 277 no. 5333, (1997) 1833–1834.
- (11) E. Denamur, S. Bonacorsi, A. Giraud, P. Duriez, F. Hilali, C. Amorin, E. Bingen, A. Andremont, B. Picard, F. Taddei, et al., “High frequency of mutator strains among human uropathogenic escherichia coli isolates,” Journal of bacteriology 184 no. 2, (2002) 605–609.
- (12) L. M. Hall and S. K. Henderson-Begg, “Hypermutable bacteria isolated from humans–a critical analysis,” Microbiology 152 no. 9, (2006) 2505–2514.
- (13) L. Chao and E. C. Cox, “Competition between high and low mutating strains of escherichia coli,” Evolution 37 no. 1, (1983) 125–134.
- (14) O. Tenaillon, B. Toupance, H. Le Nagard, F. Taddei, and B. Godelle, “Mutators, population size, adaptive landscape and the adaptation of asexual populations of bacteria,” Genetics 152 no. 2, (1999) 485–493.
- (15) M. Heo and E. I. Shakhnovich, “Interplay between pleiotropy and secondary selection determines rise and fall of mutators in stress response,” PLoS computational biology 6 no. 3, (2010) e1000710.
- (16) Y. Ram and L. Hadany, “The evolution of stress-induced hypermutation in asexual populations,” Evolution 66 no. 7, (2012) 2315–2328.
- (17) Y. Ram and L. Hadany, “Stress-induced mutagenesis and complex adaptation,” Proceedings of the Royal Society of London B: Biological Sciences 281 no. 1792, (2014) 20141025.
- (18) M. Lukačišinová, S. Novak, and T. Paixão, “Stress-induced mutagenesis: Stress diversity facilitates the persistence of mutator genes,” PLoS computational biology 13 no. 7, (2017) e1005609.
- (19) T. Swings, B. Van den Bergh, S. Wuyts, E. Oeyen, K. Voordeckers, K. J. Verstrepen, M. Fauvart, N. Verstraeten, and J. Michiels, “Adaptive tuning of mutation rates allows fast response to lethal stress in escherichia coli,” eLife 6 (2017) .
- (20) J. M. Smith and J. Haigh, “The hitch-hiking effect of a favourable gene,” Genetics Research 23 no. 1, (1974) 23–35.
- (21) C. F. Gentile, S.-C. Yu, S. A. Serrano, P. J. Gerrish, and P. D. Sniegowski, “Competition between high-and higher-mutating strains of escherichia coli,” Biology letters 7 no. 3, (2011) 422–424.
- (22) A. Giraud, I. Matic, O. Tenaillon, A. Clara, M. Radman, M. Fons, and F. Taddei, “Costs and benefits of high mutation rates: adaptive evolution of bacteria in the mouse gut,” science 291 no. 5513, (2001) 2606–2608.
- (23) D. M. Fitzgerald, P. Hastings, and S. M. Rosenberg, “Stress-induced mutagenesis: implications in cancer and drug resistance,”.
- (24) R. C. MacLean, C. Torres-Barceló, and R. Moxon, “Evaluating evolutionary models of stress-induced mutagenesis in bacteria,” Nature Reviews Genetics 14 no. 3, (2013) 221–227.
- (25) R. S. Galhardo, P. J. Hastings, and S. M. Rosenberg, “Mutation as a stress response and the regulation of evolvability,” Critical reviews in biochemistry and molecular biology 42 no. 5, (2007) 399–435.
- (26) P. L. Foster, “Stress-induced mutagenesis in bacteria,” Critical reviews in biochemistry and molecular biology 42 no. 5, (2007) 373–397.
- (27) T. G. Hammerstrom, K. Beabout, T. P. Clements, G. Saxer, and Y. Shamoo, “Acinetobacter baumannii repeatedly evolves a hypermutator phenotype in response to tigecycline that effectively surveys evolutionary trajectories to resistance,” PloS one 10 no. 10, (2015) e0140489.
- (28) A. Jolivet-Gougeon, B. Kovacs, S. Le Gall-David, H. Le Bars, L. Bousarghin, M. Bonnaure-Mallet, B. Lobel, F. Guillé, C.-J. Soussy, and P. Tenke, “Bacterial hypermutation: clinical implications,” Journal of medical microbiology 60 no. 5, (2011) 563–573.
- (29) G. M. Eliopoulos and J. Blázquez, “Hypermutation as a factor contributing to the acquisition of antimicrobial resistance,” Clinical Infectious Diseases 37 no. 9, (2003) 1201–1209.
- (30) I. Chopra, A. J. O’Neill, and K. Miller, “The role of mutators in the emergence of antibiotic-resistant bacteria,” Drug Resistance Updates 6 no. 3, (2003) 137–145.
- (31) A. Giraud, I. Matic, M. Radman, M. Fons, and F. Taddei, “Mutator bacteria as a risk factor in treatment of infectious diseases,” Antimicrobial agents and chemotherapy 46 no. 3, (2002) 863–865.
- (32) J. Martinez and F. Baquero, “Mutation frequencies and antibiotic resistance,” Antimicrobial agents and chemotherapy 44 no. 7, (2000) 1771–1777.
- (33) E. Toprak, A. Veres, J.-B. Michel, R. Chait, D. L. Hartl, and R. Kishony, “Evolutionary paths to antibiotic resistance under dynamically sustained drug selection,” Nature genetics 44 no. 1, (2012) 101–105.
- (34) A. C. Palmer, E. Toprak, M. Baym, S. Kim, A. Veres, S. Bershtein, and R. Kishony, “Delayed commitment to evolutionary fate in antibiotic resistance fitness landscapes,” Nature communications 6 (2015) 7385.
- (35) J. V. Rodrigues, S. Bershtein, A. Li, E. R. Lozovsky, D. L. Hartl, and E. I. Shakhnovich, “Biophysical principles predict fitness landscapes of drug resistance,” Proceedings of the National Academy of Sciences 113 no. 11, (2016) E1470–E1478.
- (36) I. Phillips, E. Culebras, F. Moreno, and F. Baquero, “Induction of the sos response by new 4-quinolones,” Journal of Antimicrobial Chemotherapy 20 no. 5, (1987) 631–638.
- (37) L. J. Piddock and R. Wise, “Induction of the sos response in escherichia coli by 4-quinolone antimicrobial agents,” FEMS Microbiology Letters 41 no. 3, (1987) 289–294.
- (38) P. Ysern, B. Clerch, M. Castańo, I. Gibert, J. Barbé, and M. Llagostera, “Induction of sos genes in escherichia coli and mutagenesis in salmonella typhimurium by fluoroquinolones,” Mutagenesis 5 no. 1, (1990) 63–66.
- (39) L. Ren, M. S. Rahman, and M. Z. Humayun, “Escherichia coli cells exposed to streptomycin display a mutator phenotype,” Journal of bacteriology 181 no. 3, (1999) 1043–1044.
- (40) T. Pérez-Capilla, M.-R. Baquero, J.-M. Gómez-Gómez, A. Ionel, S. Martín, and J. Blázquez, “Sos-independent induction of dinb transcription by -lactam-mediated inhibition of cell wall synthesis in escherichia coli,” Journal of bacteriology 187 no. 4, (2005) 1515–1518.
- (41) L. Robert, J. Ollion, J. Robert, X. Song, I. Matic, and M. Elez, “Mutation dynamics and fitness effects followed in single cells,” Science 359 no. 6381, (2018) 1283–1286.
- (42) P. Pang, A. Lundberg, and G. Walker, “Identification and characterization of the mutl and muts gene products of salmonella typhimurium lt2.,” Journal of bacteriology 163 no. 3, (1985) 1007–1015.
- (43) K. Jyssum, “Observations on two types of genetic instability in escherichia coli,” APMIS 48 no. 2, (1960) 113–120.
Appendix A Evolution equations
We consider a population subdivided into wildtype with growth rate and baseline mutation rate , a resistant phenotype with this baseline mutation rate and growth rate , and corresponding phenotypes of equal growth rate but increased mutation rate , . Population levels at time are given by , , , and , respectively. Transitions (mutations) between the subpopulations are permitted in accordance with the schematic Fig. 1. We assume limited resources set by an environmental carrying capacity , so that the subpopulation levels thus evolve in time according to the equations
| (5) |
where is the rate of mutation from a baseline-mutation rate () phenotype to a phenotype (rate at which mutations leading to elevated mutation rates occur) and its reverse (assumed to be equal), is the probability of mutation from wildtype to the resistant phenotype and backward, is the probability of mutation to deleterious phenotypes, .
In order to compute the relative advantage or disadvantage conferred by hypermutation on the fixation of drug resistant subpopulations (Eq. 2) we numerically compute the ratio of resistant mutants (combined non-hypermutant and hypermutant types) in the total population at to the ratio that would result if no hypermutations were allowed in the system, i.e. if we set and consider only phenotypes and . When computing these quantities for a system with an initial distribution of hypermutants of either phenotype, we assume that the system has a corresponding distribution in which
with representing either wildtype or the resistant phenotype.
In the figures shown in the main text and in the Supplemental Material was set at per generation per cell lee2012rate where is the number of basepairs in the E. coli genome. In the results shown in the main text, when the population is not purely wildtype at , the proportion of hypermutants chosen is assumed to be distributed proportionally amongst the wildtype and resistant populations.
Appendix B Rate of acquisition of increased mutation rate and initial proportion of hypermutants
To estimate a biologically reasonable we consider a simple system consisting of a wildtype phenotype and a wildtype , both with fitness , which can mutate into each other with rate :
| (6) |
The steady-state (stationary distribution) proportion of hypermutants in the total population will be given by
| (7) |
at time after resources have been saturated333Since our goal in the analysis of this section is to obtain a first-order estimate for that is independent of the precise mutation rate we omit the potential effect of deleterious mutations here via , as the magnitude of this effect will depend on the actual mutation frequency of the hypermutators.. Hypermutation can be caused by various mechanisms; studies focused on pathogenic E. coli have found comparatively high () proportions of mutators in bacterial isolates ( in jyssum1960observations and in leclerc1996high ); a separate study that looked specifically for MMR deactivation in E. coli found a much lower proportion () when both commensal and pathogenic E. coli were included gross1981incidence . A later study matic1997highly found, however, that when other sources of hypermutation were included besides MMR, E. coli cells exhibiting increased mutation rates – of up to two orders of magnitude from the baseline mutation rate – constituted as much as of the total population, most being mild mutators, with both commensal and pathogenic strains included in the study. The highest mutation rates were found to correspond to MMR deficiencies, with lower increases due to other mechanisms. Note that since is a neutral-selection rate, studies of mutator proportions that were conducted under conditions of adaptive evolution will likely overestimate this parameter and we therefore restrict our data to studies of natural isolates, noting that even in those cases adaptive evolution in the recent past may have taken place.
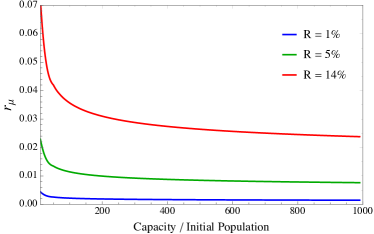
We compute which values yield the stationary distribution ratio (7) for different carrying capacities by taking as in the main text to be 0.34 under no inhibition. The results for different values of are shown in Fig. 5. Since we consider a uniform distribution444A non-uniform distribution can be incorporated by multiplying by a probability distribution that depends on - as this adds additional degrees of freedom to the model we avoid doing so here. of mutation rate increase factors and the figure is heavily tipped towards mild mutators, using this figure will likely overestimate the mutation rate in our model for higher values of . For the purpose of the plots in the main text we set on the lower end, at and an initial proportion of hypermutating cells in the population.
See pages 1 of SuppInfo.pdfSee pages 2 of SuppInfo.pdfSee pages 3 of SuppInfo.pdfSee pages 4 of SuppInfo.pdfSee pages 5 of SuppInfo.pdf