marginparsep has been altered.
topmargin has been altered.
marginparwidth has been altered.
marginparpush has been altered.
The page layout violates the ICML style.
Please do not change the page layout, or include packages like geometry,
savetrees, or fullpage, which change it for you.
We’re not able to reliably undo arbitrary changes to the style. Please remove
the offending package(s), or layout-changing commands and try again.
Interpretable Discovery in Large Image Data Sets
Anonymous Authors1
Preliminary work. Under review by the International Conference on Machine Learning (ICML). Do not distribute.
Abstract
Automated detection of new, interesting, unusual, or anomalous images within large data sets has great value for applications from surveillance (e.g., airport security) to science (observations that don’t fit a given theory can lead to new discoveries). Many image data analysis systems are turning to convolutional neural networks (CNNs) to represent image content due to their success in achieving high classification accuracy rates. However, CNN representations are notoriously difficult for humans to interpret. We describe a new strategy that combines novelty detection with CNN image features to achieve rapid discovery with interpretable explanations of novel image content. We applied this technique to familiar images from ImageNet as well as to a scientific image collection from planetary science.
1 Introduction
As more and more data is collected by science, industry, finance, and other fields, the need increases for automated methods to identify content of interest. The discovery of new or unusual observations within large data sets is a key element of the scientific process, since unexpected observations can inspire revisions to current knowledge and overturn existing theories Kuhn (1962). When exploring a new environment, such as the deep ocean or the surface of Mars, quickly identifying observations that do not fit our expectations is essential for making the best use of limited mission lifetimes. The challenge is particularly acute for image data sets that may contain millions of images (or more), rendering exhaustive manual review infeasible.
Many anomaly and novelty detection methods are available, but in isolation their results can be difficult to interpret. Once an observation is identified as novel or anomalous, the next question is generally, “Why?” To investigate the anomaly, users need to know what properties of the observation caused it to be selected. For images, these properties might include color, shape, location, objects, content, etc.
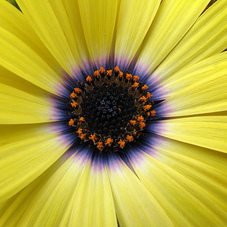
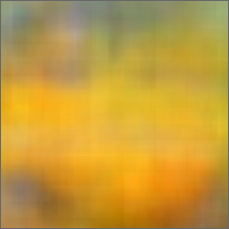
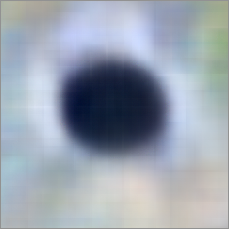
In this work, we propose the first method to generate human-comprehensible (visual) explanations for novel discoveries in large image data sets. A simple example is shown in Figure 1, where a flower with a dark center was selected from a set of images containing yellow objects (e.g., banana, squash, lemon). The yellow color is not novel (middle), so it is omitted from the explanation (right). Instead, the dark center of the flower is highlighted as novel. We describe the details of how the selections are made and how the explanations are generated, then conduct experiments that include studies of well known ImageNet images and data compiled for real scientific investigations. One of the urgent questions within the field is whether interpretability has to come at the expense of accuracy or performance. Our results support an optimistic answer: in the case of novel image detection, we can obtain explainable results in tandem with the best discovery performance.
2 Related Work
Recently there has been a growing interest in interpretable or explainable machine learning methods, especially for supervised learning Biran & Cotton (2017). Some methods are fundamentally interpretable, such as decision trees, while others train a simplified “mimic” or approximation model that provides a post-hoc rationalization for a given decision (e.g., LIME Ribeiro et al. (2016)). Image classification explanations often take the form of a saliency map that identifies the parts of an image that were relevant to the classification decision. Recent advances include a single-pass salience map generator that can run in real-time Dabkowski & Gal (2017). Park et al. (2017) developed a Pointing and Justification (PJ-X) model to answer questions about the content of an image. It provides a text explanation and an annotated image that highlights the image elements that led to the classifier’s decision.
Fewer methods exist for generating explanations for unsupervised learning methods. Brinton proposed an Explainable Principal Components Analysis method that uses human interaction to generate human-comprehensible principal component vectors Brinton (2017). This approach aims for an explainable model, not explainable decisions. Siddiqui et al. (2015) generated explanations to help human experts determine whether a selected item is anomalous or not. Their approach incrementally reveals feature values until the expert is sufficiently confident. The DEMUD algorithm uses a Singular Value Decomposition (SVD) model to discover new classes and provide a custom explanation for each discovery Wagstaff et al. (2013). The residual vector (information not captured by the model) is provided as an explanation for the item’s selection. To our knowledge, no methods exist that generate visually meaningful explanations for class discovery in image data sets.
3 Visual Explanations for Novelty Detection
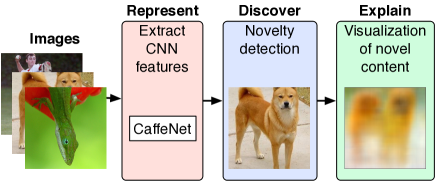
Our approach to interpretable discovery in image data sets uses a novelty detection algorithm to select images and generate raw explanations, a convolutional neural network (CNN) to represent abstract image content, and CNN feature visualization methods to render the explanations understandable to humans (see Figure 2).
3.1 Novelty Detection with Explanations
To detect novel images within a data set, we employed the DEMUD algorithm Wagstaff et al. (2013), which automatically generates explanations during the novelty detection process. DEMUD incrementally builds an SVD model of what is known about a data set . It proceeds by iteratively selecting the most interesting remaining item, with respect to the SVD model, and then incorporating it into the SVD model. Interestingness (or novelty) is estimated using reconstruction error, where a higher error indicates more novelty. Reconstruction error for each item is calculated as
| (1) |
where is the current set of top eigenvectors from the SVD of , the set of already selected items, and is the mean of all previously seen . The most interesting item is moved from to , and an incremental SVD algorithm updates to incorporate . This approach minimizes redundancy in the selections, since items similar to those previously selected will have low reconstruction error.
DEMUD’s explanation for each selection is the residual difference between a reconstructed , after projection into the low-dimensional space defined by , and its original values. The reconstruction of is
| (2) |
and the explanation is . The explanation captures the information contained in that the current model could not represent.
To our knowledge, our work is the first attempt to apply DEMUD to image data and obtain meaningful explanations. The straightforward approach of providing DEMUD with the pixel values in the image does not perform well with respect to image categories because it is overly sensitive to small changes in position, illumination, etc. Further, the explanations that are generated by DEMUD are a sequence of pixel values that are very difficult to interpret. An interest in the image content, rather than its pixel values, calls for a more abstract representation. We solve this problem by employing a convolutional neural network to represent each image prior to novelty detection.
3.2 CNN Features for Image Content Representation
Several methods exist for extracting image content, such as LBP Ojala et al. (2002), SIFT Lowe (2004), and HOG Dalal & Triggs (2005). Recently, the representation of image content provided by trained convolutional networks has been shown to be useful for a variety of visual tasks, not just the original classification task for which the network was trained Razavian et al. (2014).
We extract a feature vector to represent each image by propagating the image through a trained neural network. Any network (or autoencoder) trained on a sufficiently diverse set of inputs could be employed. For our experiments, we used CaffeNet Jia et al. (2014), a version of AlexNet Krizhevsky et al. (2012) that was trained on 1.2 million images from 1000 classes in the ImageNet data set. For each image, we recorded the activations at each fully connected layer.
3.3 Visualization of Explanations
When previous researchers applied DEMUD to numeric data sets, the residuals could be directly interpreted because each feature already represented a human-comprehensible value (e.g., size, age, number of petals). In contrast, in the image domain, residual values for the 4096 features employed by layer fc6 in CaffeNet are not directly interpretable. Note that visualizing these externally generated feature vectors is not addressed by methods that seek to visualize the learned CNN model itself, such as that of Zeiler and Fergus (2014), or to generate synthetic inputs to visualize class membership such as DeepVis Yosinski et al. (2015).
Two recent advances provide methods for visualizing CNN feature vectors as images. The Deep Goggle (DG) system employs gradient descent to generate a synthetic input image that yields the same layer-level activation as a given target Mahendran & Vedaldi (2015). Dosovitskiy and Brox (2016) trained an up-convolutional (UC) network to take the layer-level activation as an input and predict the corresponding original image. DG tends to highlight fine details, while UC more faithfully represents color and location. We adopted the UC method for this study.
Previous investigators used these visualization methods to generate images that correspond to the internal CNN representations of other (real) images. We instead employ UC to visualize the DEMUD reconstruction and residual , which are not real images. These visualizations divide the image content into what is expected () and what is new (), as shown in Figure 1. Figure 3 shows the same yellow flower image with a visualization of the residual obtained when using pixel-level features, in which almost every pixel value is highlighted as novel and it is difficult to understand why the image was selected. Figure 3(c) shows the explanation obtained using CNN features from the first fully-connected layer of CaffeNet (fc6). As expected, fine details are not shown; the fc6 representation instead captures higher level image content, and the image shown here includes only the novel components (e.g., the dark center of the flower).
4 Experimental Results
We conducted several experiments to assess (1) the ability to discover new classes in progressively more difficult conditions and (2) the quality of the generated explanations. We present two here for the sake of brevity. All data sets, extracted features, and evaluation scripts are available at http://jakehlee.github.io/interp-img-disc.html.
4.1 Methodology
We compared two discovery methods (DEMUD and a standard batch-mode SVD) using three different representations: pixels, SIFT features, and CNN-based features.
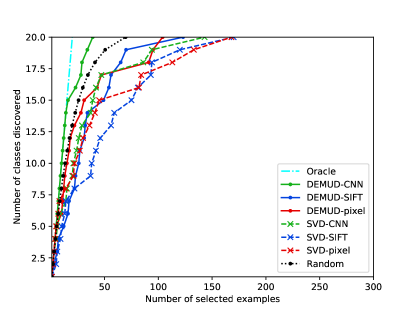
To assess discovery, we used each algorithm to generate a ranked list of images in descending order of novelty. We used the image class labels (which were not visible to the algorithms) to compute , the cumulative number of distinct classes (e.g., dog, baseball, seal, …) that were discovered up to selection . Plotting the number of discovered classes as a function of the number of items selected yields a discovery curve. We calculated the normalized area under the curve (nAUC), given classes, by summing from selection 1 to and dividing by the AUC achieved by perfect discovery:
| (3) |
In all DEMUD and SVD runs, we used a value (number of principal components) of 50. Results were not very sensitive to this choice; sweeping from 10 to 100 yielded results with a standard deviation of less than 1% nAUC. Random selection results are the average of 1000 trials. All other methods are deterministic.
We generated SIFT-based features using a visual bag of words approach. We clustered SIFT keypoints across all images within a data set, then represented each image with the distribution of its keypoints across clusters. Since there is no standard way to select the best number of clusters in advance, for all SIFT results we report the best performance achieved after testing . Note that this representation cannot provide meaningful explanations. DEMUD residuals will be in the form of distributions of unexpected values for keypoint cluster histograms, which have no clear path to visualization. However, we include SIFT as a comparison for the discovery step given its ubiquity in image analysis work.
4.2 Discovery of ImageNet Classes
We first experimented with the ImageNet data set that was compiled for the Large Scale Visual Recognition Challenge (ILSVRC) in 2012 Russakovsky et al. (2015). We randomly selected 50 images from the ILSVRC12 training set for each of 20 classes to obtain a total of 1000 images. Each image was cropped as needed to obtain a 1:1 aspect ratio, then resized to 227x227 pixels. Figure 4(a) shows the number of classes discovered as a function of the number of selections. The “Oracle” line shows perfect discovery performance (i.e., a new class discovered with each selection).
DEMUD using the pixel values or SIFT features to represent the images performed slightly worse than random selection in class discovery. In all cases, DEMUD out-performed the use of a standard SVD. The use of CNN-based representations accelerated class discovery for both methods. DEMUD using CNN layer fc8, which has the highest level of content abstraction, had the highest performance. In fact, it achieved perfect performance for the first 14 selections.
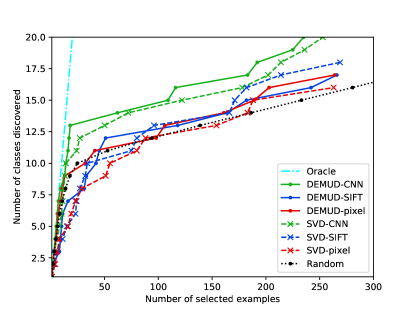
Unbalanced classes.
For real discovery problems, classes are unlikely to be equally balanced in the data set. We expected that random selection would perform worse on an unbalanced data set, while DEMUD would be more robust to class imbalance. To test this hypothesis, we generated a variant of the ImageNet data set in which the first 10 classes contain 50 items and the last 10 classes have only one item. As shown in Figure 4(b), this data set was much more difficult: the minority classes took much longer to discover. However, there was a clear improvement when using CNN representations versus using pixel or SIFT representations, and DEMUD again out-performed a standard SVD.
Table 1 compares results on the balanced and unbalanced data sets, for DEMUD and the SVD, for each representation, and the random selection baseline. As expected, DEMUD suffered less of a performance drop than was observed for random selection, and the CNN features provided much more robustness than did SIFT or pixel features.
| Balanced | Unbalanced | |||
|---|---|---|---|---|
| Features | DEMUD | SVD | DEMUD | SVD |
| CNN-fc8 | 98.55 | 91.86 | 81.98 | 78.18 |
| CNN-fc7 | 97.11 | 92.44 | 71.50 | 69.26 |
| CNN-fc6 | 96.27 | 93.72 | 69.43 | 68.14 |
| SIFT | 91.67 | 86.21 | 66.59 | 68.36 |
| Pixel | 93.43 | 88.71 | 67.97 | 62.51 |
| Random sel. | 96.35 | 63.94 | ||
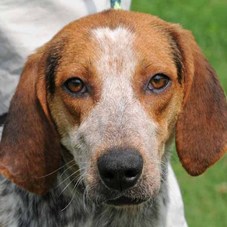
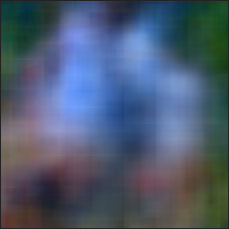
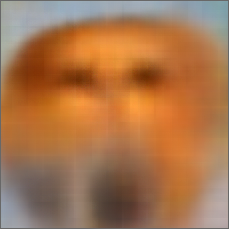
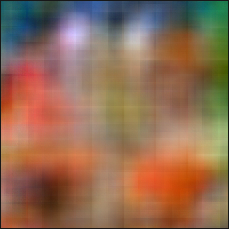
Figure 5 shows two examples of novel selections and their explanations. All visualizations are shown using the UC method Dosovitskiy & Brox (2016). DEMUD’s first selection (not shown) was from the “chow chow” class and includes a kneeling man with two small dogs on grass. The top row shows selection 2, which is the first discovery of an image from the “English foxhound” class. The green grass background and white elements are expected, but the shape of the dog’s face and its orange elements are novel. The bottom row shows selection 16 (discovery of class “vestment”), at which point many of the colors and content are expected. However, it is the first image to include a standing human, and the blue tones of the robe (which is bluer than grass) are emphasized. Note that the number and pose of the humans is abstracted away in the explanation of novel content.
| Selection | Expected | Novel |
|---|---|---|
 |
 |
 |
 |
 |
 |
4.3 Discovery in Mars Rover Images
We applied the same techniques to a publicly available scientific image data set. This data set111http://doi.org/10.5281/zenodo.1049137 consists of 6712 images from 25 classes that were collected by the Curiosity Mars rover from sol (Martian day) 3 to 1060. The classes consist of the ground, horizon, and various rover parts (e.g., wheel, drill, scoop). The number of images per class ranges from 21 to 2684.
While the experiments in preceding sections used the same ImageNet images that were used to train the CNN, the images in this data set come from a very different distribution and have different properties. If we use CaffeNet to predict the classes of these images, the most common predictions are “horned viper”, “sandbar”, “tick”, “nematode”, and “cliff dwelling” (none of which are correct, of course). This experiment therefore also tests whether the Earth-specific abstract concepts learned by CaffeNet generalize sufficiently well to a new domain.
| Features | DEMUD | SVD |
|---|---|---|
| CNN-fc8 | 91.14 | 70.28 |
| CNN-fc7 | 92.75 | 74.60 |
| CNN-fc6 | 89.56 | 76.03 |
| SIFT | 68.47 | 18.56 |
| Pixel | 69.17 | 55.36 |
| Random sel. | 76.33 | |
As expected, this data set yielded lower discovery performance than the ImageNet data sets (see Figure 7 and Table 2). DEMUD-CNN was the only method to perform better than random selection, which it exceeded by a large margin. After 300 selections, DEMUD-CNN was also the only method to have discovered all 25 classes. Interestingly, on this data set, the fc7 CNN layer provided the best representation (although the results with fc8 were not very different).
| Selection | Expected | Novel |
|---|---|---|
 |
 |
 |
 |
 |
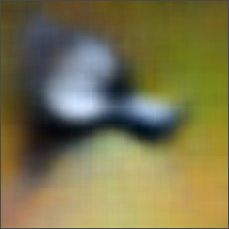 |
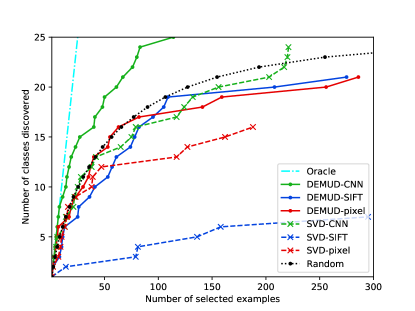
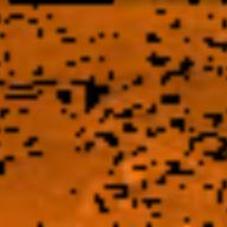
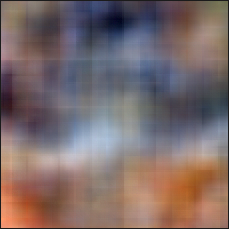
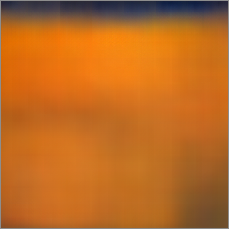
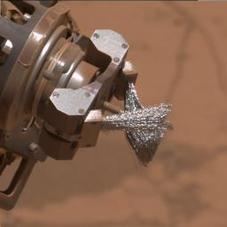
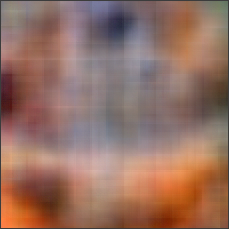
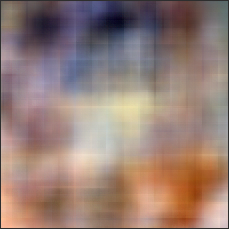
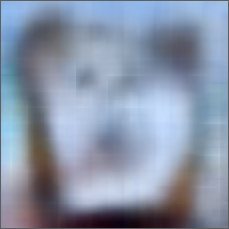
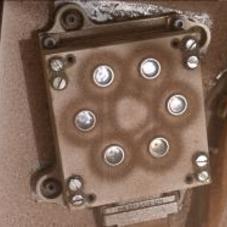
Figure 6 shows some example selections of interest. The top row is the first discovery of the “ground” class (selection 5), where the orange component of the image is the dominant part of the novel content. All selections prior to this one were close-ups of rover parts that did not include the bright orange ground. (This image also appears to be unusually saturated.) The bottom row shows the discovery of the “DRT side view” class (selection 19; DRT is the Dust Removal Tool or brush). While the expected content is very generic, the novel content visualization crisply highlights the tool and brush tips. Note that the orange component of the ground is no longer novel; in fact, in comparison with the previously selected “ground” image, this terrain contains relatively less red, which manifests as more yellow/green in the explanation.
| Selection | Expected | Novel |
|---|---|---|
 |
 |
 |
 |
 |
 |
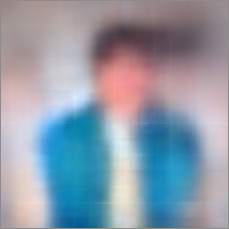
To see how the explanations aid interpretation, consider the images shown in Figure 8. DEMUD discovered the REMS-UV sensor in an image from sol 36 on selection 2 (due to its shape), then selected an image of the same object more than 700 sols later on selection 13 (due to its color). In terms of image class label, the second image is not a novel discovery. However, the explanation shows that selection 13 was chosen because it is distinctly redder (more dusty) than expected, which highlights the process of dust deposition on Mars over the intervening time. DEMUD did not have access to information about the time ordering of the images; it naturally selected two extreme examples (pristine and dust-covered) that emerged as novel within the data set.
Analyzing the full image archive is of interest for retrospective studies, but this same approach can be useful in an immediate, tactical setting. Each day, a team of experts examines the latest downlinked rover images to decide which targets the rover should examine the next day. DEMUD could be used to analyze the latest batch of images and identify those that are novel with respect to the archive. By highlighting these images, DEMUD could help reduce the chance that, in the high-pressure planning environment, a discovery that merits follow-up study goes unnoticed.
5 Conclusions and Future Work
We have developed the first approach to generating visually meaningful explanations for discovery in image data sets. We employ a convolutional neural network to generate abstract representations of image content, then use the DEMUD algorithm to select novel images and generate explanations in the form of residuals (information in the image that could not be represented by the current model). An up-convolutional network generates human-interpretable visualizations of the explanations.
In our experiments, we found that this approach achieved strong (sometimes near-perfect) discovery performance, even in challenging data sets. DEMUD with CNN features always achieved higher discovery performance than using pixel-based representations. Further, the use of CNN features consistently out-performed using SIFT. Performance gains were most dramatic for the Mars rover data set in which the classes are imbalanced, the images are highly similar in color, and pixel and SIFT representations are inadequate.
There are some potential limitations in the ability of a neural network that was trained on ImageNet images to generalize to data sets with very different properties, such as those from Mars. In future work, we will explore whether a new network (or autoencoder) that was trained on images from the target distribution would yield even better discovery performance. We have also found that DEMUD is very good at detecting mislabeled examples, since they contain unusual content with respect to their class. In an initial experiment with ImageNet classes, DEMUD discovered a lion image (with mane) that was labeled as a “tiger cub.” This capability could be useful in exploring even fully labeled data sets, to help identify labeling errors and/or adversarial examples.
This approach can be used to accelerate analysis and discovery in a variety of application areas, ranging from surveillance to remote sensing to ecosystem monitoring. Many investigations employ cameras to observe phenomena of interest. By focusing attention on the most novel images, our approach can help investigators quickly zero in on the observations most likely to lead to new discoveries.
Acknowledgments
We thank the Planetary Data System Imaging Node for funding this project. Part of this research was carried out at the Jet Propulsion Laboratory, California Institute of Technology, under a contract with the National Aeronautics and Space Administration.
References
- Biran & Cotton (2017) Biran, Or and Cotton, Courtnay. Explanation and justification in machine learning: A survey. In Proceedings of the IJCAI-17 Workshop on Explainable AI, pp. 8–13, 2017.
- Brinton (2017) Brinton, Chris. A framework for explanation of machine learning decisions. In Proceedings of the IJCAI-17 Workshop on Explainable AI, pp. 14–18, 2017.
- Dabkowski & Gal (2017) Dabkowski, Piotr and Gal, Yarin. Real time image saliency for black box classifiers. In Proceedings of the 31st Conference on Neural Information Processing Systems, 2017.
- Dalal & Triggs (2005) Dalal, Navneet and Triggs, Bill. Histograms of oriented gradients for human detection. In Proceedings of the IEEE Computer Society Conference on Computer Vision and Pattern Recognition, pp. 886–893, 2005.
- Dosovitskiy & Brox (2016) Dosovitskiy, Alexey and Brox, Thomas. Inverting visual representations with convolutional networks. In Proceedings of the IEEE Conference on Computer Vision and Pattern Recognition, pp. 4829–4837, 2016.
- Jia et al. (2014) Jia, Yangqing, Shelhamer, Evan, Donahue, Jeff, Karayev, Sergey, Long, Jonathan, Girshick, Ross, Guadarrama, Sergio, and Darrell, Trevor. Caffe: Convolutional architecture for fast feature embedding. arXiv preprint arXiv:1408.5093, 2014.
- Krizhevsky et al. (2012) Krizhevsky, Alex, Sutskever, Ilya, and Hinton, Geoffrey E. ImageNet classification with deep convolutional neural networks. In Advances in Neural Information Processing Systems 25, pp. 1097–1105, 2012.
- Kuhn (1962) Kuhn, Thomas S. The Structure of Scientific Revolutions. University of Chicago Press, 1962.
- Lowe (2004) Lowe, David G. Distinctive image features from scale-invariant keypoints. International Journal of Computer Vision, 60(2):91–110, 2004.
- Mahendran & Vedaldi (2015) Mahendran, Aravindh and Vedaldi, Andrea. Understanding deep image representations by inverting them. In Proceedings of the IEEE Conference on Computer Vision and Pattern Recognition, pp. 5188–5196, 2015.
- Ojala et al. (2002) Ojala, T., Pietikäinen, M., and Mäenpää, T. Multiresolution gray-scale and rotation invariant texture classification with local binary patterns. IEEE Transactions on Pattern Analysis and Machine Intelligence, 24(7):971–987, 2002.
- Park et al. (2017) Park, Dong Huk, Hendricks, Lisa Anne, Akata, Zeynep, Rohrbach, Anna, Schiele, Bernt, Darrell, Trevor, and Rohrbach, Marcus. Attentive explanations: Justifying decisions and pointing to the evidence. In Proceedings of the NIPS Interpretable Machine Learning Symposium, 2017.
- Razavian et al. (2014) Razavian, Ali Sharif, Azizpour, Hossein, Sullivan, Josephine, and Carlsson, Stefan. CNN features off-the-shelf: An astounding baseline for recognition. In Proceedings of the IEEE Conference on Computer Vision and Pattern Recognition Workshops, pp. 806–813, 2014.
- Ribeiro et al. (2016) Ribeiro, Marco Tulio, Singh, Sameer, and Guestrin, Carlos. “Why should I trust you?” Explaining the predictions of any classifier. In Proceedings of the 22nd SIGKDD Conference on Knowledge Discovery and Data Mining, pp. 1135–1144, 2016.
- Russakovsky et al. (2015) Russakovsky, Olga, Deng, Jia, Su, Hao, Krause, Jonathan, Satheesh, Sanjeev, Ma, Sean, Huang, Zhiheng, Karpathy, Andrej, Khosla, Aditya, Bernstein, Michael, Berg, Alexander C., and Fei-Fei, Li. ImageNet Large Scale Visual Recognition Challenge. International Journal of Computer Vision, 115(3):211–252, 2015.
- Siddiqui et al. (2015) Siddiqui, Md Amran, Fern, Alan, Dietterich, Thomas G., and Wong, Weng-Keen. Sequential feature explanations for anomaly detection. In Proceedings of the KDD Workshop on Outlier Detection and Description, 2015.
- Wagstaff et al. (2013) Wagstaff, Kiri L., Lanza, Nina L., Thompson, David R., Dietterich, Thomas G., and Gilmore, Martha S. Guiding scientific discovery with explanations using DEMUD. In Proceedings of the Twenty-Seventh Conference on Artificial Intelligence, pp. 905–911, 2013.
- Yosinski et al. (2015) Yosinski, Jason, Clune, Jeff, Nguyen, Anh, Fuchs, Thomas, and Lipson, Hod. Understanding neural networks through deep visualization. In Proceedings of the ICML Deep Learning Workshop, 2015.
- Zeiler & Fergus (2014) Zeiler, Matthew D. and Fergus, Rob. Visualizing and understanding convolutional networks. In Proceedings of the European Conference on Computer Vision, pp. 818–833, 2014.