Explosions of blue supergiants from binary mergers for SN 1987A
Abstract
Based on the work of Menon and Heger (2017), we present the bolometric light curves and spectra of the explosions of blue supergiant progenitors from binary mergers. We study SN 1987A and two other peculiar Type IIP supernovae: SN 1998A and SN 2006V. The progenitor models were produced using the stellar evolution code Kepler and then exploded using the 1D radiation hydrodynamic code Crab. The explosions of binary merger models exhibit an overall better fit to the light curve of SN 1987A than previous single star models, because of their lower helium-core masses, larger envelope masses, and smaller radii. The merger model that best matches the observational constraints of the progenitor of SN 1987A and the light curve is a model with a radius of , an ejecta mass of , an explosion energy of erg, a nickel mass of , and a nickel mixing velocity of . This model also works for SN 1998A and is comparable with earlier estimates from semi-analytic models. In the case of SN 2006V, however, a model with a radius of and ejecta mass of matches the light curve. These parameters are significantly higher than predictions from semi-analytic models for the progenitor of this supernova.
keywords:
binaries: general – supergiants – supernovae: general – methods: numerical – supernovae: individual: SN 1987A, SN 1998A, SN 2006V.1 Introduction
Type II plateau supernovae (Type IIP SNe) are the most common class of core-collapse supernovae whose progenitors are red supergiants (RSGs) of a few hundred solar radii with large hydrogen-rich envelopes (some ) and contains an iron core at the time of collapse (Grassberg et al., 1971; Falk & Arnett, 1977; Smartt, 2009; Dessart et al., 2010). They are characterized by a distinct plateau phase in their bolometric luminosity evolution, typically of days, followed by the nebular phase where the light curve descends to a long tail powered by radioactive decay of to .
In February 1987, however, a new H-rich Type II SN was spotted, in the Large Magellanic Cloud (LMC). Although the spectrum of SN 1987A contained H-lines, its light curve was dome-shaped, with a much slower rise to maximum compared to Type IIP SNe and a near absence of a plateau. These features indicated that the progenitor was far more compact than a RSG. Revisiting the pre-explosion images of the LMC showed that the progenitor was indeed a hot, compact, blue supergiant (BSG; Walborn et al., 1987). Sk– had a luminosity of , an effective temperature of kK, and a radius of (Woosley et al., 1988; Barkat & Wheeler, 1989a). The small progenitor radius helped explain both its slowly rising light curve (days) and its low peak luminosity compared to typical Type IIP SNe (Wood, 1988; Arnett et al., 1989). Sk– is by far the most well-observed of all supernovae progenitors. A curious circumstellar nebular structure, in the form of a triple-ring, was observed around the central debris site (Burrows et al., 1995), which was ejected by the parent star, at least 20,000 years before exploding (Burrows et al., 1995; Sugerman et al., 2005). The rings themselves were enriched in nitrogen compared to carbon and oxygen, with number fraction ratios of and (Lundqvist & Fransson, 1996), and in helium compared to hydrogen with a number fraction ratio of (France et al., 2011). These abundances originate from the surface of the progenitor during its phase as a BSG and indicate enrichment by material that underwent CNO burning at some time during the evolution of the projenitor.
The first evolutionary models that attempted to reproduce the observational features of Sk– were from single stars. These models were derived by fine-tuning specific aspects of the evolutionary path to make the star explode as a BSG, such as rotation rate (Weiss et al., 1988), reducing the helium-core mass (Barkat & Wheeler, 1989b), decreasing the envelope metallicity (Weiss et al., 1988), increasing the abundance of helium in the envelope, increasing mass loss (Saio et al., 1988; Shigeyama & Nomoto, 1990), restricting the convection (Woosley et al., 1988), or inducing rotation and restricting semi-convection (Woosley et al., 1997). Along with the extreme physics evoked, except for the spin-up mechanism described by Heger & Langer (1998), these single star models could not explain how the progenitor could gain enough angular momentum to eject material that would form the complex triple-ring nebular structure (Podsiadlowski, 1992; Smartt, 2009). The first evolutionary calculations that explored the role of accretion or a merger in the binary system, were done by Podsiadlowski & Joss (1989) and Podsiadlowski et al. (1990), in which two of the models evolved into BSGs that tallied with the location of Sk–. The merger evolutionary scenario was further developed in Podsiadlowski et al. (1992, 2006) and the 3D hydrodynamic simulations of the merger itself were studied in (Ivanova & Podsiadlowski, 2002b, a, 2003). The 3D simulations of Morris & Podsiadlowski (2009) also demonstrated that the triple-ring nebular structure could be reproduced by using a merger model.
The light curve of SN 1987A can be classified into three parts: the early light curve up to days was powered by the release of the internal energy left behind by the shock wave after propelling the expansion of the ejecta; the middle part of the light curve was entirely powered by the radioactive decay energy of to ; and the late part of the light curve, days, was powered by the decay of to (Woosley, 1988; Shigeyama & Nomoto, 1990; Utrobin, 2004). These features of the light curve of SN 1987A make it significantly different from those of typical Type IIP SNe (Woosley, 1988; Arnett et al., 1989; Hamuy, 2003).
The fast and smooth rise of the light curve and its broad dome shape indicated a large extent of mixing of 56Ni out into the envelope where it could not have been produced by thermonuclear reactions, along with the mixing of H and other chemical species into the He core (Woosley, 1988; Shigeyama & Nomoto, 1990; Blinnikov et al., 2000; Utrobin, 2004). Spectral observations between days showed an unusual phenomenon called the Bochum event, wherein fine structures were observed in the line profile (Hanuschik et al., 1988; Phillips & Heathcote, 1989). In addition, the net flux of the line dropped to zero at Day 20, but was greater than zero before and after that, which indicated that an additional heating source powered the line after its drop at Day 20 (Phillips & Heathcote, 1989; Thimm et al., 1989). This heating source was attributed to the emission of -rays from the decay of 56Ni and 56Co clumps or fingers, which were mixed from the explosion engine to the outer layers of the ejecta where H was present (Woosley, 2012). The mixing is expected to occur when the shock wave from the explosion gets decelerated at the (C+O)/He and He/H composition interfaces. The formation of Rayleigh-Taylor (RT) instabilities at these interfaces causes outward mixing of into the hydrogen envelope, whereas inward mixing of hydrogen into the helium core of the progenitor star only depends on the strength of RT instabilities at the He/H composition interface (see, e.g., Arnett et al., 1989; Shigeyama & Nomoto, 1990; Kifonidis et al., 2003, 2006; Wongwathanarat et al., 2015).
Observations also supported the requirement of strong mixing of species in the ejecta: the bulk of the Ni and Fe mass in the ejecta was observed to mix out to regions travelling at km/s (Colgan et al., 1994). Utrobin et al. (1995) could reproduce the Bochum event by accounting for the fast, outward mixing of Ni clumps with one clump of Ni found to be travelling as fast as km/s. The later evolution ( days) of velocity estimated from the line profile in the ejecta showed that H was distributed down to regions within the He core, where the ejecta had velocities of km/s (Chugai, 1991; Kozma & Fransson, 1998; Maguire et al., 2012). Observations of the 3D distribution of the ejecta by Larsson et al. (2016) found H line emission in the ejecta down to velocities of km/s.
Since its discovery, eleven more supernovae have been identified with very similar spectra and light curve shapes as SN 1987A (Pastorello et al., 2012; Taddia et al., 2013). Together, they are classified as Type II-peculiar supernovae (Type II-pec SNe), and they are all expected to have massive BSG progenitors. The prototype of this class is SN 1987A, which to this date remains the most well-recorded supernova with data from as early as 1 day until it faded away a year later.
Supernova explosion studies can be classified in two categories: those based on evolutionary models and those on non-evolutionary models. The first one uses a progenitor model constructed from stellar evolution calculations and then varies the explosion parameters to produce a match with the observations. The second one is a reverse-engineering process, in which one constructs an ‘optimal’ stellar model by assuming a homologous relation between mass and radius. In this method, individual parameters such as the radius, ejecta mass, explosion energy, and mixing are varied to obtain the best parameter set for reproducing the light curve of the supernova.
We use the following notations in this paper: is the radius of the progenitor (or pre-SN) model and is the mass of the pre-SN model. is the ejecta mass obtained from , where is the baryonic mass cut that determines the neutron star mass and is the inner mass boundary of the progenitor which is not included in the explosion (see Section 2.4). is the explosion energy applied at the mass cut, and for which we use the unit Bethe (B) where Bergs; it is the excess above the total energy of the envelope beyond the mass cut and hence is essentially converted into the kinetic energy of the ejected mass. The mass in the ejecta is denoted as and the velocity of the ejected mass is denoted as .
Explosion studies that have used these single star evolutionary models have been done by, e.g., Woosley (1988); Nomoto et al. (1988); Saio et al. (1988); Arnett et al. (1989); Shigeyama & Nomoto (1990); Blinnikov et al. (2000); Utrobin (2004), using 1D radiation hydrodynamic codes. These models have a radius of , He core mass of and an envelope mass of . With a choice of explosion parameters that include , , which was determined from the luminosity of the nickel decay tail of the light curve, and a ‘strong’ nickel mixing velocity compared to the observed value of of , these models produced reasonably good fits with the light curve shape. Dessart & Hillier (2010) used a more sophisticated 1D time-dependent radiative transfer code to study the first 20 days of the spectral and light curve evolution, with an progenitor model which had and . The results from the explosion of this model also matched the observations in this period very well.
Non-evolutionary explosion calculations carried out by Utrobin (1993, 2004, 2005) predicted different results for the progenitor than the above evolutionary calculations. Utrobin (1993) demonstrated that a progenitor model with and a density structure with a polytropic index of , when exploded with , can fit the light curve. Utrobin (2004) scaled an evolutionary model which had and to one with and . By using an explosion energy of and a nickel mass of with this scaled model, Utrobin (2004) could produce an excellent fit to the light curve data, but again with a strong nickel mixing velocity of . On the other hand, an artificially constructed progenitor model which had , and a modified density distribution compared to above evolutionary models, could reproduce the observed light curve with a ‘moderate’ nickel mixing velocity of , which is much closer to the observed value.
Except for Dessart & Hillier (2010), all the above studies, both evolutionary and non-evolutionary, used only the photometric data of SN 1987A to constrain the progenitor model and did not study the evolution of the spectral lines in the ejecta. Using a non-evolutionary model of Utrobin (2004), Utrobin (2005) were the first to simultaneously constrain a progenitor model by including both the photometric and spectroscopic observations of SN 1987A. Based on this study, Utrobin (2005) predicted that the optimal progenitor model whose explosion can match the bolometric light curve, the kinetics of spectral lines and the Ni mixing velocity of required from observations, has , , and an explosion energy to ejecta mass ratio of ergs/, which gives B for this model.
The 3D simulations of Wongwathanarat et al. (2015) demonstrated that the extent of mixing in the supernova explosion depends heavily on the overall progenitor density structure, in particularly the density gradient at the He/H interface, the compactness of the CO core, and the location of the composition interfaces. It was found that the nickel fingers penetrate deeper in RSG models, between in the H-rich envelope, than in BSG models in which the fingers penetrated out only up to velocities of , except in model B15 in which nickel was mixed out to a maximum velocity of . The growth rate of Rayleigh-Taylor (RT) instabilities depends on the location where they are formed, which is connected to the density structure of the He core and the formation time of the reverse shock that forms when the shock wave is decelerated as it passes through the He/H interface. For BSGs, nickel plumes in the He core do not have sufficient time to grow and penetrate the envelope before being stalled by the reverse shock. In order to allow the growth of nickel fingers, a steeper density gradient at the He/H interface, as typically found in RSGs, is required in the BSG models as well.
The most detailed work so far that did a complete study of the evolution of the supernova ejecta from the early explosion phase until the late nebular phase is that of Utrobin et al. (2015). Using certain single-star BSG progenitor models, they performed 3D neutrino-driven explosion simulations to study the evolution of hydrodynamic and chemical composition quantities until shock breakout and thereafter mapped these quantities to a 1D spherically symmetric model to obtain the light curve shape and the evolution of the photospheric velocity profiles. None of the single-star evolutionary models used in the study could reproduce the light curve shape or spectral observations of SN 1987A, except for the optimal model of (Utrobin, 2005). The observed nickel mixing velocity of was found only in one of the evolutionary models (B15), with and , whereas the other evolutionary models only produced nickel mixing velocities up to . Hydrogen was found to be mixed inward down to velocities of in all models, in agreement with observations. The mixing of hydrogen determines the shape of the broad dome of the light curve.
Thus there are two reasons why we need new pre-SN evolutionary models for SN 1987A. First, despite strong proof that the progenitor of SN 1987A evolved from a binary merger, there are no pre-SN models in published literature based on the binary merger scenario that match both, the observed signatures of Sk– and whose explosions also match the light curve and spectral features of the supernova. Second, there is a need for an evolutionary model whose 3D neutrino-driven explosion can reproduce the required penetration of nickel and hydrogen fingers in agreement with the observed velocities of mixed matter and thereafter fit the light curve as well. Utrobin et al. (2015) already predicted that a progenitor from a binary merger can have larger envelope mass and may be more favourable to match the overall light curve shape of SN 1987A.
All explosion studies for SN 1987A so far have used single star pre-SN models, which were derived by fine-tuning specific aspects of the evolution to make the star explode as a BSG. Menon & Heger (2017, hereafter Paper I) conducted the first systematic and detailed study of binary merger evolutionary models based on the merger scenario of Podsiadlowski et al. (1992, 2007), which were evolved until the pre-SN stage, i.e., until just prior to the onset of iron-core collapse. Six of the pre-SN models matched the observational criteria of Sk– and the majority of the pre-SN models were blue. The study included a large range of initial parameters, including the primary and secondary masses and mixing boundaries during the merging. In this paper, we use these pre-SN models to conduct the first study of explosions of binary merger progenitors for SN 1987A. We broaden our study to investigate the viability of our progenitor models for two other peculiar Type IIP SNe: SN 1998A and SN 2006V. We would especially like to thank the authors of Lusk & Baron (2017) for putting together the bolometric light curve data and nickel masses of five SN 1987A-like objects.
The merger pre-SN models have been computed with code Kepler and the light curves were calculated using code Crab, as explained in Section 2. In Section 3 we explain the role of different parameters affecting the shape of the light curve, how they compare with earlier single star models and the best fit model for SN 1987A. We also assess whether the merger models can explain other peculiar Type IIP supernovae and thus infer the properties of their progenitors.
2 Methodology
2.1 Kepler: the stellar evolution code
In Paper I, we constructed post-merger models using the implicit hydrodynamic stellar evolution code Kepler (Woosley et al., 2002; Woosley & Heger, 2007). The code assumes a dynamo model (Spruit, 2002) and includes the physics for angular momentum transport due to rotation Heger et al. (2000); Heger & Langer (2000), and prescriptions for mixing arising from rotationally-induced instabilities (Heger et al., 2000, 2005). Up to oxygen depletion in the core, energy generation treated using a 19-isotope network that comprises the key reaction needed, and after oxygen depletion the code switches to a 128 isotope nuclear quasi-statistical equilibrium model, and after silicon burning to a nuclear statistical equilibrium network (Heger & Woosley, 2010; Sukhbold et al., 2016). The reaction rates used are as described in Rauscher & Thielemann (2000); Woosley & Heger (2007).
2.2 The binary merger
2.2.1 Evolution leading up to the binary merger
The progenitor models of Paper I were built according to the binary merger scenario outlined in Podsiadlowski et al. (2007), and incorporating results from merger simulations of Ivanova et al. (2002) and from 1D post-merger simulations of Ivanova & Podsiadlowski (2003). The evolution of the binary sequence is as follows (Podsiadlowski et al., 1992; Podsiadlowski, 1992; Podsiadlowski et al., 2007): A massive main-sequence primary (between ) and an intermediate mass main-sequence secondary () have an initial orbital period of yr. When the primary star evolves to a red giant with a He-depleted core, it overflows its Roche Lobe and transfers mass on a dynamically unstable timescale to the secondary, which leads to a common envelope episode. The secondary and the core of the primary spiral in towards each other as they lose energy due to frictional forces. This loss of orbital energy, causes a partial ejection of the envelope. The spiral-in phase continues until the secondary also fills its Roche Lobe and transfers mass on the He core of the primary, over a period of the order of a 100 yr (Ivanova & Podsiadlowski, 2002b, a). At the end of the mass-transfer phase, the secondary is expected to be completely disrupted and dissolves in the envelope of the primary. In the hydrodynamic simulations of Ivanova & Podsiadlowski (2002a), a stream of the H-rich secondary mass was found to penetrate the He core during the mass transfer and dredge up He-rich material to the surface, thus causing the He core to shrink in mass. After the merging phase is completed, the thermally unstable RSG structure is expected to first puff up and then contract to a BSG. The star reaches core collapse as a BSG and explodes as a Type II SNe (Ivanova & Podsiadlowski, 2003). The present models do not consider spin-up by the merger. Ivanova & Nandez (2016) find, although for low-mass common-envelope mergers, that most of the angular momentum is quickly lost along with the ejecta from the surface.
It should be noted that there are alternative binary scenarios to the one used in this work to produce BSG pre-SN models. These involve a primary that undergoes a Case B mass transfer when the primary is still burning He in its core, as discussed in Podsiadlowski & Joss (1989); Podsiadlowski et al. (1992); Podsiadlowski (1992). A BSG may form either from the merger of a secondary main-sequence star with the primary, or the secondary could itself evolve to a BSG after the accretion of mass from the primary.
2.2.2 Blue supergiants from post-binary mergers (Paper I)
In Paper I, evolutionary models were constructed by considering three initial parameters: the primary mass, , the secondary mass, , and the fraction of the He shell of the primary’s He core dredged up, . The range of these parameters were: , , and ; , , , and , , , and , where corresponds to the boundary of the CO core.
The evolution was followed from the zero age main sequence of the rotating primary star (), until the central helium abundance dropped to , i.e., until the end of core He-burning. At this stage the primary is an RSG with a He-depleted core and it merges with the secondary main-sequence star according to the scenario of Podsiadlowski et al. (2007). A simple 1D merging prescription was implemented, based on the merger phenomenon described in Section 2.2.1. At the end of the merger the He-core mass becomes smaller, depending on the mixing boundary set by , and the envelope mass becomes larger, depending on the mass of the secondary that was accreted. The model was evolved until just prior to the onset of iron core-collapse, when the infall velocity in any part of the star exceeded km s-1. This sets the pre-supernova (pre-SN) model.
Two important factors that determined the final position of the post-merger star in the HR diagram were and . In general, increasing for a given combination of and led to smaller He cores and resulted in the pre-SN model to have a lower , whereas increasing for given and caused the pre-SN model to have a higher . For the parameter space we considered, BSG pre-SN models, which have , always formed when to and . In the study of Paper I, of the pre-SN models computed were BSGs whereas the rest were yellow supergiants (YSGs), with .
2.3 Progenitor models used in this work
Although eleven peculiar Type IIP SNe are known (Pastorello et al., 2012), only five of these have sufficiently good observational data (Lusk & Baron, 2017) aside from SN 1987A. These are: SN 1998A, SN 2000cb, SN 2006au, SN 2006V, and SN 2009e. SN 2000cb was studied by Utrobin & Chugai (2011) and its progenitor was expected to have a radius of and an ejecta mass of . We attempted to make new merger models with the ejecta mass of , however, their radius was much larger than . Hence we could not study SN 2000cb in this work. For SN 2006au, there were no data points for the cobalt decay tail luminosity in the bolometric light curve and therefore we could not investigate this supernova in this study. In the case of SN 2009e, there were not enough data points in the bolometric light curve for days (Pastorello et al., 2012), without which it was not possible to perform a progenitor analysis. Hence SN 2009E was also omitted from our study.
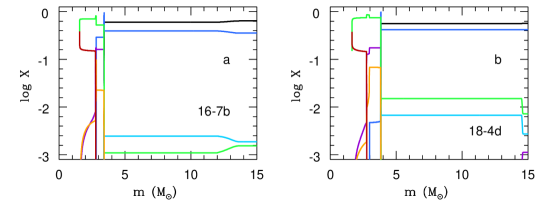
In this work, we use the pre-SN models of Paper I for SN 1987A and SN 1998A and computed additional models for SN 2006V. These are all listed in Table 1. The progenitor models for SN 1987A are those that satisfy all the observational criteria of Sk–, viz., the N/C and N/O ratios in its surface, and its position in the HR diagram. We expand the range of models we investigate for SN 1987A to study the impact of changing the parameters and on the explosion results.
| Model | ||||||||||||
|---|---|---|---|---|---|---|---|---|---|---|---|---|
| () | () | (%) | () | () | () | () | () | (kK) | () | () | ||
| SN 1987A | ||||||||||||
| 16-5a | 16 | 5 | 10 | 1.49 | 4.0 | 16.0 | 20.0 | 1.52 | 16.8 | 4.9 | 32.8 | 0.011 |
| 16-6a | 16 | 6 | 10 | 1.52 | 4.0 | 16.0 | 20.0 | 1.52 | 16.8 | 4.9 | 32.8 | 0.008 |
| 16-6b | 16 | 6 | 50 | 1.59 | 3.6 | 17.4 | 21.0 | 1.50 | 16.9 | 4.9 | 35.7 | 0.009 |
| 16-6d | 16 | 6 | 90 | 1.38 | 3.1 | 17.9 | 21.0 | 1.40 | 12.8 | 4.7 | 46.0 | 0.006 |
| 16-6c | 16 | 6 | 100 | 1.49 | 3.1 | 17.9 | 21.0 | 1.38 | 11.0 | 4.8 | 64.3 | 0.008 |
| 16-7a | 16 | 7 | 10 | 1.65 | 3.8 | 18.2 | 22.0 | 1.53 | 16.9 | 4.9 | 30.8 | 0.009 |
| 16-7b | 16 | 7 | 50 | 1.55 | 3.4 | 18.6 | 22.0 | 1.38 | 15.8 | 4.9 | 37.4 | 0.009 |
| 16-8a | 16 | 8 | 10 | 1.65 | 3.8 | 19.2 | 23.0 | 1.53 | 18.8 | 5.0 | 28.8 | 0.009 |
| SN 1998A | ||||||||||||
| 16-7b | 16 | 7 | 50 | 1.55 | 3.4 | 18.6 | 22.0 | 1.38 | 15.8 | 4.9 | 37.4 | 0.009 |
| SN 2006V | ||||||||||||
| 18-4d | 18 | 4 | 90 | 1.64 | 3.8 | 16.7 | 20.5 | 1.50 | 7.5 | 4.8 | 150.3 | 0.009 |
2.4 Crab: The explosion code
The implicit Lagrangian radiation hydrodynamics code Crab (Utrobin, 2004, 2007) integrates the spherically symmetric equations. It solves the set of hydrodynamic equations including self-gravity, and a radiation transfer equation. The latter is treated in the one-group (gray) approximation in the outer, optically transparent or semitransparent layers of the SN ejecta and is as the diffusion of equilibrium radiation in the approximation of radiative heat conduction in the inner, optically thick layers, where thermalization of radiation takes place (e.g., Mihalas & Mihalas, 1984). The pre-SN models provided by the evolutionary simulations of binary mergers are used as the initial data in our hydrodynamic modelling of the SN outburst. The SN explosion is approximated by the collapse of the inner core, which is removed from the computational mass domain and collapses into a neutron star. The explosion is initiated by a supersonic piston applied to the location where the entropy drops to S=4 kb/baryon (i.e., ) near the bottom of the stellar envelope and by assuming no fallback mass.
The time-dependent radiative transfer equation is written in a co-moving frame of reference to accuracy of order ( is the fluid velocity, is the speed of light) and is solved for the zeroth and first angular moments of the non-equilibrium radiation intensity. To close the system of moment equations, a variable Eddington factor is evaluated, directly taking the scattering of radiation in the ejecta into account. The total set of equations is discretized spatially on the basis of the method of lines (e.g., Hairer et al., 1993; Hairer & Wanner, 1996). The resultant system of ordinary differential equations is integrated using the implicit method of Gear (1971) with an automatic choice of both the time integration step and the order of accuracy of the method. Shock waves are automatically captured by means of the linear and nonlinear artificial viscosity of Caramana et al. (1998). In addition, Compton cooling and heating is included in the radiation hydrodynamic equations and treated according to Weymann (1966). Moreover, the calculation of the SN bolometric luminosity allows for retardation and limb-darkening effects.
Energy deposition of gamma rays from the decay chain 56Ni Co Fe is calculated by solving the gamma-ray transport with the approximation of an effective absorption opacity of 0.06 cmg-1, whereas positrons are assumed to deposit their energy locally. The Compton electrons, occurring in scattering of gamma rays, lose their energy through Coulomb heating of free electrons, and ionization and excitation of atoms and ions. The rates of the corresponding non-thermal processes are taken from Kozma & Fransson (1992).
A non-equilibrium radiation field and a non-thermal excitation and ionization require solving the general problem of the level populations and the ionization balance instead of using the Boltzmann formulae and the Saha equations under the LTE conditions. Multiple calculations of the corresponding equation of state in hydrodynamic modeling are possible by neglecting the excited atomic and ionic levels, i.e., by considering only the atomic and ionic ground states and their ionization balance. The non-LTE ionization balance includes the elements H, He, C, N, O, Ne, Na, Mg, Si, S, Ar, Ca, Fe, and the negative hydrogen ion H-. It is controlled by the following elementary processes: photoionization and radiative recombination, electron ionization and three-particle recombination, and non-thermal ionization. These processes are calculated using the partition functions of atoms and ions (Irwin, 1981), the photoionization cross sections (Verner & Yakovlev, 1995; Verner et al., 1996), and the electron collisional ionization rates (Voronov, 1997). The photoionization of the negative hydrogen ion is treated with the cross section data of Wishart (1979), and the electron collisional detachment reaction with the rate coefficient of Janev et al. (1987).
The mean opacities, the thermal emission coefficient, and the contribution of lines to the opacity are computed taking into account non-LTE effects. Photoionization, free-free absorption, Thomson scattering on free electrons, and Rayleigh scattering on neutral hydrogen contribute to the mean opacities. For all atoms and ions but the negative hydrogen ion the free-free absorption coefficient is calculated with the effective nuclear charge corrected for screening effects (Sutherland & Dopita, 1993) and the temperature-averaged free-free Gaunt factor (Sutherland, 1998). For the negative hydrogen ion the free-free absorption coefficient was computed by Bell & Berrington (1987). The calculation of the Rayleigh scattering by hydrogen atoms is based on the the cross section of Gavrila (1967) and the exact static dipole polarizability of hydrogen from Teachout & Pack (1971).
In the outer, semitransparent and transparent layers, the ground state populations are calculated in non-LTE for the equation of state and for continuum opacity. An expanding SN ejecta with a velocity gradient makes the contribution of spectral lines to the opacity essential and permits us to treat line opacities in the Sobolev approximation using the generalized formula of Castor et al. (1975). The expansion line opacities are determined by atomic and ionic level populations with the Boltzmann formulae and the Saha equations for a mixture of all elements from H to Zn at the local non-equilibrium radiation temperature. The line database of Kurucz (2002) provides us with oscillator strengths of nearly lines. The corresponding energy level data are from the atomic spectra database of the National Institute of Standards and Technology.
3 Results
3.1 Comparison between binary merger and single star pre-supernova models
The binary merger BSG models (Table 1) are structurally different from single star models. In Fig. 1, we compare the density profiles of the pre-SN Model 16-7b, which has a total mass of , and single star pre-SN models with main-sequence masses of used in Utrobin et al. (2015).
In general, our merger models have smaller He cores than those single star models ( compared to ), more massive envelopes ( compared to ) and have smaller radii as well ( compared to ). The merger models also have denser envelopes and a steeper density profile at the He-core/H-envelope interface than single star models (Fig. 1). The compactness parameter (Ott et al., 2008; Ott et al., 2013) in this study is calculated as for as in Utrobin et al. (2015). Our models have a smaller core compactness parameter, between , compared to single star models, which have a compactness parameter of . The iron-core masses of the merger pre-SN models are between , whereas those of the single star models are between .
The “optimal” non-evolutionary model computed by Utrobin (2005) whose explosion matched the light curve and photospheric velocity profile, had an ejecta mass of and a radius of . The single star evolutionary models thus have larger radii and smaller ejecta masses than this optimal model, whereas some of our binary merger models from Table 1 do fit these ideal progenitor characteristics. Of these, the explosion of Model 16-7b, with , , and was found to best fit the light curve of SN 1987A. In the following sections, we first analyse how the light curve is affected by varying the explosion parameters for this model and after choosing the most optimal explosion parameter set, we show how the light curve responds to changing the properties of the progenitor.
3.2 The light curve of SN 1987A
The light curves of Type IIP supernovae are powered by two sources: the deposited shock energy from the explosion and the energy from the radioactive decay of to and later the decay of to . In the case of compact progenitors, most of the shock energy is expended to adiabatically expand the star and hence the light curve is predominantly powered by gamma-ray energy (Woosley, 1988; Blinnikov et al., 2000; Utrobin, 2004). If there was no in the star, the light curve would begin to descend after days as it radiates away the fraction of shock energy deposited (Woosley, 1988; Utrobin, 2004).
Subsequent to the triggering of the explosion, the shockwave moves out of the centre towards the stellar surface, heating up the envelope as it does so, and causes it to expand with velocities increasing outward and exceeding the local escape velocity. After the shock breaks out of the surface, the luminosity surges to a peak between erg s-1 (Woosley, 1988; Blinnikov et al., 2000; Utrobin, 2004). As the star expands and cools, the luminosity decreases until about days at which point the temperature inside the star reaches that of hydrogen recombination. A cooling and recombination wave (CRW) forms and travels inward, with the photosphere in it, and the internal energy of the star begins to radiate outward (Utrobin, 1993). The period of the first days is referred to as the early light curve. From Day to Day , the SN luminosity is determined by the CRW properties. After about days and until about days, referred to as the middle light curve, the energy diffused outward increasingly becomes dominated by the gamma-ray radioactive energy (Utrobin, 1993). When the SN ejecta become optically thin for radiation, the bolometric luminosity follows the instantaneous release of energy from the decay of to . This is the late light curve phase (days).
3.2.1 Varying explosion parameters
In this section, we study the effect of varying the explosion energy, the width of boxcar mixing, and the velocity of nickel mixed to the surface on the light curve shape. For the explosion of all progenitor models, we fix the nickel mass at and the mass cut at .
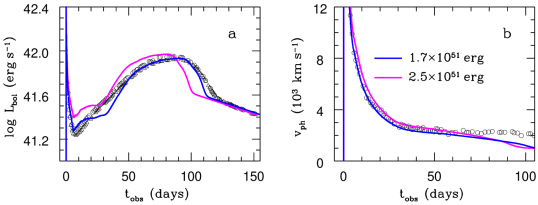
All explosion parameters in this section are varied for Model 16-7b of Table 1. In Fig. 3, we vary the explosion energy between . The best match for the light curve is produced for , at the dip at days and the overall fit in the middle light curve region. This result is in concurrence with the prediction of Utrobin (2005) for their optimal model, in which the line profile at days reproduced the spectroscopic observations of SN 1987A at a ratio of B/. We hence use the same value for all our hydrodynamic models in this study.
Next, we use an artificial procedure that mimics the mixing that arises from instabilities in the ejecta as seen in 3D simulations after the passage of the shockwave Kifonidis et al. (2003, 2006); Wongwathanarat et al. (2015) and which has also been used in other 1D explosion studies such as those of Pinto & Woosley (1988); Kasen & Woosley (2009); Dessart et al. (2013); Morozova et al. (2015). This 1D mixing is implemented via a running boxcar of width through the envelope of the star, which averages the composition of all chemical species other than . In Fig. 4, we vary the width of the running boxcar, , which effectively smoothens composition gradients in the ejecta. Increasing increases the spread of hydrogen inward (thick lines in Fig. 4). The boxcar width determines the distribution of hydrogen within the He core, which, in turn, determines the shape of the dome at the transition from the luminosity maximum to the radioactive tail (Fig. 4b). A value of mimics hydrogen mixing down to zero velocity, which agrees with spectral observations, and produces the best match with the dome shape of SN 1987A.
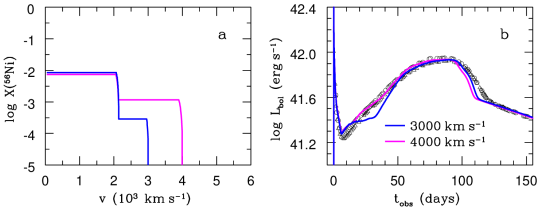
After setting the values of and , we selectively vary the mixing of in velocity space, keeping all other species intact (Fig. 5). We find that in order to have a smoothly rising light curve to maximum, a strong nickel mixing velocity of is required, which is the same result as found in previous explosion studies using evolutionary models (Shigeyama & Nomoto, 1990; Blinnikov et al., 2000; Utrobin, 2004). Using the observed value of results in a slower luminosity increase between days due to the photosphere approaching the region where the internal energy of the ejecta has been radiated away and the gamma-ray energy from the radioactive decay has not been diffused yet. If is distributed out to regions moving at larger velocities, then the gamma rays diffused compensates for the drop in internal energy of the envelope and the light curve rises smoothly.
3.2.2 Varying progenitor parameters
From the results of the previous section, we choose the following explosion parameters for the investigation into other progenitor models: B/, nickel mixing velocity of and boxcar mixing of .
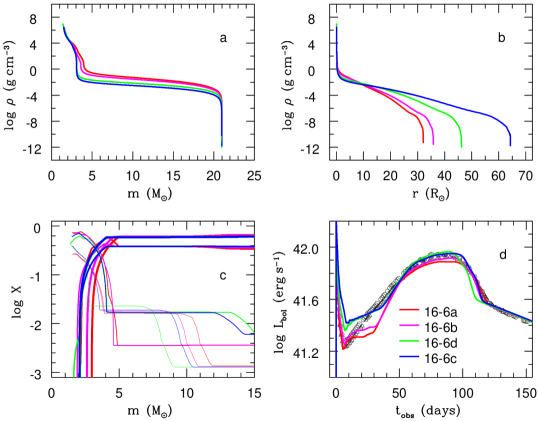
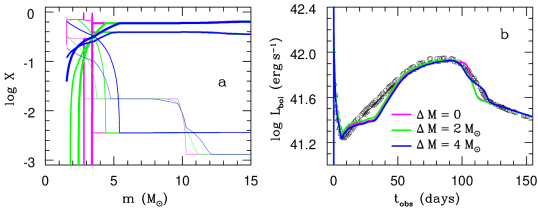
In Fig. 6, we show how the fraction of the He shell of the He core dredged up affects the light curve shape for merger models with a primary of mass and a secondary of mass . These are Models 16-6a, 16-6b, 16-6d, and 16-6c in Table 1, which have the same pre-SN mass and have set as , , , and , respectively. With increasing , the models have larger radii (Fig. 6b). In addition, in this sequence of the models, the He-core mass decreases and, consequently, the location of the H-rich envelope is more inward, whereas in the outer () H-rich layers the hydrogen abundance decreases and the helium abundance increases (Fig. 6c). The greater the pre-SN radius is, the longer is the expansion timescale for the envelope. Hence the CRW forms sooner for smaller initial radii and the light curve begins to ascend earlier. More important is that increasing the initial radius reduces the role of adiabatic energy losses (Utrobin, 2005), resulting in a higher internal energy per unit mass, with roughly the same internal energy per unit mass initially deposited by the shock, and consequently a higher luminosity between days that causes the luminosity to increase with a less pronounced bump (Fig. 6d). Thus, overall, with increasing , the luminosity rises earlier and shifts upward during the early light curve phase.
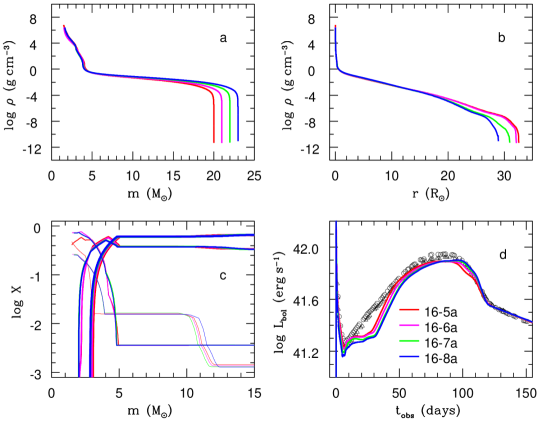
In Fig. 7, we show how the accreted secondary mass , affects the light curve shape. Shown are Models 16-5a, 16-6a, 16-7a, and 16-8a of Table 1, which have and , , , and , respectively, and radii in the range . The density profiles of the cores of these models are nearly the same (Fig. 7a), as also are their He-core masses (Table 1). Increasing increases the ejecta mass, but shrinks the pre-SN radius. The latter increases the role of adiabatic energy losses during the supernova explosion, shifting the luminosity downward during the early light curve phase and delaying the rise of the light curve to its maximum because of a greater total internal energy, which is proportional to the ejecta mass, and this energy is then radiated away over a longer period of time. Thus overall, the light curve shifts to later times with increasing , but keeping nearly the same characteristic width of the dome. The behaviour of the bump feature between days with increasing (Fig. 7d) is similar to that with decreasing (Fig. 6d). In both cases, i.e., changing and , the progenitor property that most affects the shape of the light curve is its pre-SN radius.
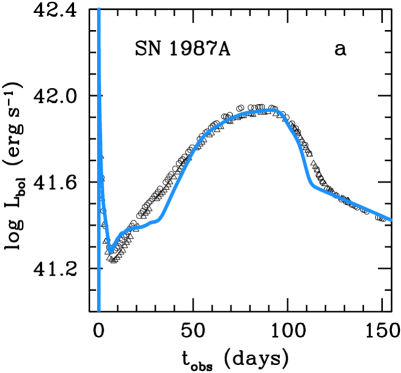
Of all progenitor models studied in this work, the one that best fits the observed properties of Sk– and whose explosion matches the light curve and the photospheric velocity of iron absorption lines (Fig. 9) is Model 16-7b, with an explosion energy of B, ejecta mass of , nickel mixing velocity of , and a nickel mass of .
3.3 Other peculiar Type IIP supernovae: SN 1998A and SN 2006V
Here we discuss the application of our analysis to two other peculiar Type IIP SNe. Table 2 lists the predicted progenitor properties from hydrodynamic models, semi-analytic models, and scaling relations for five peculiar Type IIP SNe.
| Supernova | Source | Method | ||||
|---|---|---|---|---|---|---|
| SN 1998A | Pastorello et al. (2005) | 22 (18) | 86.3 (43.2) | 5-6 (1.6) | 0.11 (0.075) | Semi-analytic model |
| Pastorello et al. (2012) | 0.09 (0.075) | Updated results | ||||
| SN 2000cb | Kleiser et al. (2011) | 16.5 (14) | 43.2 (43.2) | 4 (1.1) | 0.1 | Scaling relations |
| 17.5 (14) | 43.2 (43.2) | 2 (1) | Hydrodynamic model | |||
| Utrobin & Chugai (2011) | 22.3 | 4.4 | 0.083 | Hydrodynamic model | ||
| SN 2006V | Taddia et al. (2012) | 20 (14) | (33) | (0.078) | Scaling relations | |
| 17 (14) | 75 (33) | 2.4 (1.1) | 0.127 (0.078) | Semi-analytic model | ||
| SN 2006au | Taddia et al. (2012) | 20 (14) | (33) | (0.078) | Scaling relations | |
| 19.3 (14) | 90 (33) | 3.2 (1.1) | 0.073 (0.078) | Semi-analytic model | ||
| SN 2009E | Pastorello et al. (2012) | 26 | 86.2 | 1.3 | 0.039 | Semi-analytic model |
| 19 | 100.7 | 0.6 | 0.043 | Hydrodynamic model |
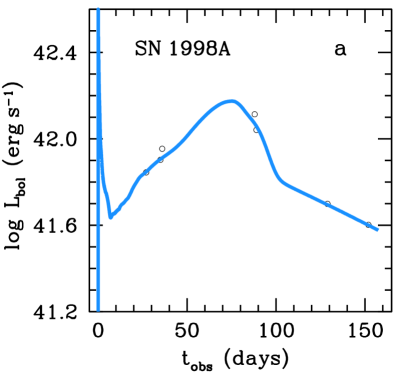
SN 1998A, which exploded in a spiral arm of the SBc galaxy IC 2627, was a more energetic explosion than SN 1987A (Williams et al., 1998; Woodings et al., 1998), whose photometric data was obtained by Pastorello et al. (2005). Its luminosity exceeds that of SN 1987A at all times and from the luminosity of its decay tail, the nickel mass of this supernova is estimated to be compared to for SN 1987A (Pastorello et al., 2005, 2012). The high photospheric velocities determined from the absorption minima of , , and lines indicated that the explosion of SN 1998A was times more energetic than SN 1987A (Pastorello et al., 2005, 2012).
From a semi-analytic model that used single star pre-SN models, Pastorello et al. (2005) predicted a progenitor of radius of and an ejecta mass of for SN 1998A (Table 2) by scaling with progenitor quantities of and for SN 1987A. Our results by fitting binary merger models are quite different from these predictions.
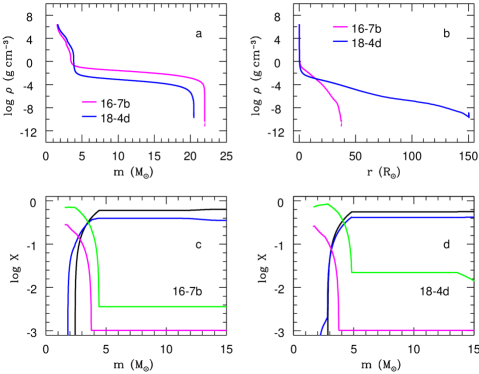
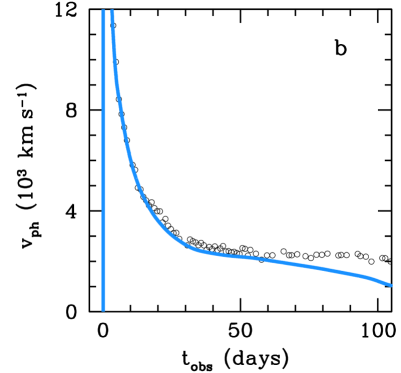
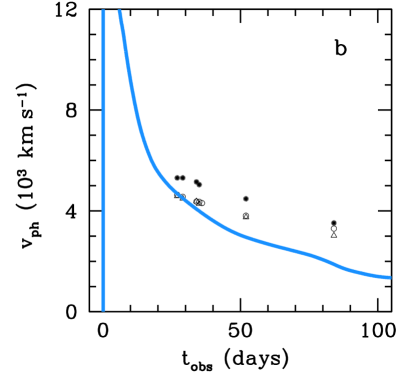
Using CRAB, we determine the best fit progenitor model as one that matches both the light curve and the photospheric velocities estimated from weak lines (Fig. 10). We test Model 16-7b for SN 1998A, whose density distribution and chemical composition averaged by the boxcar mixing with the mass width prior to the explosion are shown in Fig. 8. Both the luminosity during the outburst of SN 1998A and its photospheric velocity (Fig. 10) are remarkably higher than those of SN 1987A (Fig. 9). This indicates a greater explosion energy and a higher nickel mass compared to SN 1987A (Table 3). Model 16-7b reproduces the light curve shape and nearly matches the photospheric velocity profile for B and (determined from the luminosity in the radioactive decay tail). The light curve smoothly rising to the dome maximum requires a strong mixing of nickel up to to avoid the formation of the local dip in the luminosity at around Day 20 (Fig. 10c).
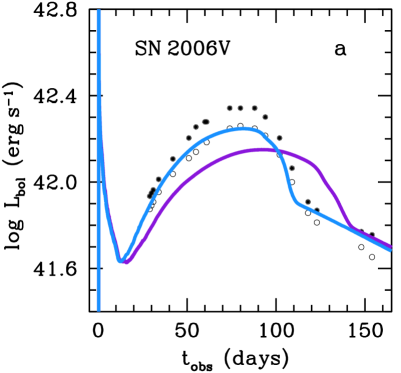
SN 2006V is more luminous compared to SN 1987A. It occurred in the spiral galaxy UGC 6510 (Chen et al., 2006) and its photometric data were taken by Taddia et al. (2012). Using semi-analytic modelling and scaling relations, Taddia et al. (2012) found that the progenitor had and and exploded with an energy of and a large nickel mass of . These results are based on the following SN 1987A properties: , , B and .
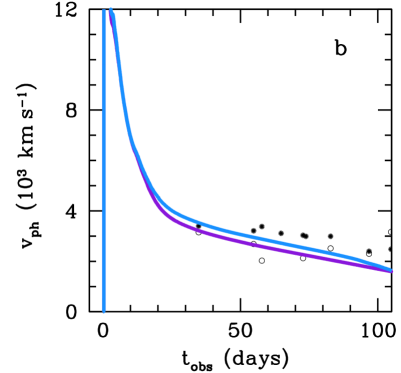
For hydrodynamic modelling, SN 2006V is a very interesting object. Confronting it with SN 1987A reveals two important facts. SN 2006V is more luminous than SN 1987A by about 0.4 dex during the entire outburst (Figures 11a and 9a), whereas the photospheric velocities of these SNe at Day 50 are comparable (Figs 11b and 9b). The latter implies that SN 2006V and SN 1987A have comparable average velocities of the ejecta. The luminosity in the interval from nearly Day 10 to Day 30 depends mainly on the average velocity of the ejecta and the pre-SN radius (Utrobin, 2005). A comparison of the average velocities leaves only one way to increase the SN luminosity, namely, to enlarge the initial radius of the pre-SN model compared to that of SN 1987A.
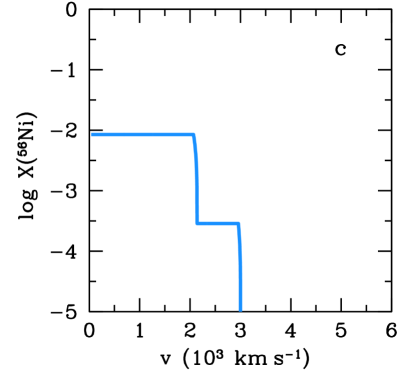
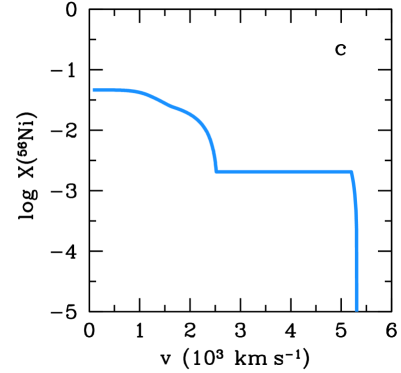
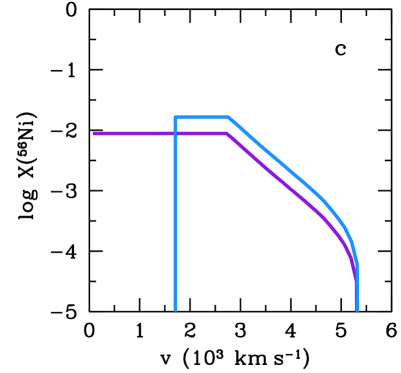
Our best fit binary merger model (Fig. 11) that matches the light curve and the photospheric velocity is Model 18-4d, which has a radius of and an ejecta mass of , and formed from the merger of a primary of mass and secondary of mass . The explosion was modelled using B and a nickel mass of . Unlike SN 1987A and SN 1998A in which nickel is mixed all the way down to zero velocity (the centre), in SN 2006V nickel is required to be mixed only within a spherical layer, between and (Fig. 11c; blue line).
When nickel is distributed within a sphere (Fig. 11c, magenta line), this kind of distribution results in a wider luminosity maximum that is shifted to lower luminosities and to later epochs compared to the observed one (Fig. 11a; magenta line). To solve the problem arisen, we have to modify the light curve in a proper way but having available only one free parameter, namely, a distribution of nickel throughout the ejecta. The maximum velocity of the nickel ejecta is well specified by the smoothness of the rising part of the light curve from about Day 30 to the luminosity maximum. In order to draw the maximum toward earlier epochs and, consequently, toward higher luminosities, we should decrease the optical depth of the ejecta from the layers where gamma rays deposit their energy to the stellar surface. Keeping the maximum velocity of the nickel ejecta, the solution of the problem is moving the inner 56Ni-rich layers out of the centre. In other words, we should make the central cavity free of radioactive nickel (Fig. 11c; blue line). This gives a good agreement of the calculated light curve with that observed (Fig. 11a; blue line).
| SN | Model | ||||||||||
|---|---|---|---|---|---|---|---|---|---|---|---|
| () | () | (%) | () | () | () | ( erg) | () | () | () | ||
| 1987A | 16-7b | 16 | 7 | 50 | 22.0 | 20.4 | 37.4 | 1.7 | 0.073 | 0 | 3,000 |
| 1998A | 16-7b | 16 | 7 | 50 | 22.0 | 20.4 | 37.4 | 4.5 | 0.12 | 0 | 5,300 |
| 2006V | 18-4d | 18 | 4 | 90 | 20.5 | 18.8 | 150.3 | 1.0 | 0.15 | 1700 | 5,400 |
4 Discussions and Conclusions
In this paper, we have presented the results of the first explosion study of progenitors from binary mergers for peculiar Type IIP SNe. Our binary merger models for SN 1987A are significantly different from the evolutionary single star progenitor models of Woosley et al. (1988); Shigeyama & Nomoto (1990); Woosley et al. (1997); Woosley & Heger (2007): they have smaller He-core masses ( compared to ), larger envelope masses ( compared to ) and smaller radii ( compared to ). The overall compact structure and large envelope mass of the merger progenitor model are close to the characteristics predicted by an “optimal” non-evolutionary model of Utrobin (2005), which has and . The binary merger models also have a steeper density gradient at the He-core/H-envelope interface and a smaller compactness parameter compared to single star models.
From the set of progenitor models we explored, the explosion of Model 16-7b from the merger of a primary star of mass , secondary of mass , with a dredge-up efficiency of , resulting in a pre-supernova model which has a radius of , a helium core mass of , and an ejecta mass of , exploding with an energy of B, nickel mixing velocity of and nickel mass of matches the light curve and photospheric velocity profile of SN 1987A (Fig. 9). The fit of this model to the light curve data is a significant improvement over current explosion models from single stars, especially in matching the luminosity dip at Day 8 and the dome shape between Days (Fig. 9 in Utrobin et al., 2015). Model 16-7b also satisfies the observational constraints of the progenitor Sk– (Menon & Heger, 2017), with kK, , and , , and , making it the first evolutionary model in literature that is compatible with the observations of the progenitor and the explosion properties of SN 1987A. The explosion parameters that produce the best fit to the light curve and photospheric velocity of SN 1987A are: , nickel mass of and nickel mixing velocity up to which agrees with spectroscopic measurements. These results are in agreement with the predictions of Utrobin (2004, 2005) from their studies of non-evolutionary models.
The ejecta mass we obtain for the pre-SN Model 16-7b on including a part of the C-O core, contains , , and . Studies of the nebular phase spectra of SN 1987A give mass estimates of these species. Oxygen, which is the most abundant of the metals and a good probe of the progenitor mass for single star models, contributes (Chugai, 1994; Kozma & Fransson, 1998; Chugai et al., 1997). The masses of helium and hydrogen are and , respectively (Kozma & Fransson, 1998). The model values of oxygen and helium are comparable to the spectral values, whereas the hydrogen mass of the ejecta is larger than its observational estimate by a factor of three. We have no ready explanation for the disparity found between the hydrogen masses. We can, however, make a general remark that hydrodynamic modeling of the observed light curves from the onset of the explosion to the radioactive tail involves all the ejected matter and gives better estimates of the total element masses than exploring the emission lines observed at the nebular phase which provides the element abundances only in the restricted parts, not in the whole ejecta.
The choice of initial parameters for the merger models, i.e., the fraction of the He shell of the primary’s He core dredged up (), the mass of the secondary star () and the mass of the primary star (), which together determine the mass of the He core, envelope mass and the radius of the pre-SN star, also affect the light curve shape. For a given and , increasing causes the He-core mass to decrease and the structure to become radially more extended. The explosion of progenitor models with decreasing He-core mass affects the luminosity dip at around Day 8, causing the light curve to ascend more rapidly and shifting it upward overall. On the other hand, increasing for given and causes the pre-SN model’s envelope mass to increase and its radius to decrease. The explosion of these models causes the light curve to descend further at Day 8 and to have a more pronounced delayed rise to the luminosity maximum between Days . Consequently, the light curve moves further to the right as increases, keeping nearly the same characteristic width of the dome.
We extended the study to investigate the explosions of our pre-SN models for two other peculiar Type IIP SNe, SN 1998A and SN 2006V. The explosion of Model 16-7b, with B, a nickel mass of and a nickel mixing velocity up to reproduced the light curve shape and reasonably matched the photospheric velocity evolution of SN 1998A. Using a semi-analytic model, Pastorello et al. (2005) predicted the progenitor for this supernova to have had a radius less than and ejecta mass of and to have exploded with an energy of B. Thus our results are in reasonable agreement with the predictions of Pastorello et al. (2005).
According to our study, SN 2006V had a much more extended progenitor, with and . This pre-SN model was created from the merger of a primary of , with , and had a He-core mass of , an envelope mass of , kK, and a luminosity of . Our progenitor for this supernova thus is not a blue supergiant, but a yellow supergiant. On the other hand, Taddia et al. (2012), who did the photometric analysis of this supernova, predicted a progenitor with and , based on a semi-analytic model. Thus our results for the progenitor differ significantly from those predicted by Taddia et al. (2012). The corresponding explosion parameters in our study are: , nickel mass of and nickel mixing in the regions with velocities between . The latter result is different from the nickel mixing velocity profiles for SN 1987A and SN 1998A in which the nickel was mixed down all the way to the centre where the velocity was zero. It is remarkable that this kind of 56Ni distribution with the central cavity free of nickel is similar to that derived for the luminous Type IIP SN 2013ej (Utrobin & Chugai, 2017). Again, our explosion parameters are different from Taddia et al. (2012) who calculated an explosion energy of B and a nickel mass of . These results of Taddia et al. (2012) may have to do with the progenitor model assumed for SN 1987A, which had a much smaller ejecta than our progenitor model, with compared to and a smaller explosion energy of B as compared to B.
The light curve of SN 2000cb had a much broader dome than that of SN 1987A and other peculiar Type IIP SNe and was a more energetic explosion than SN 1987A, with B (Kleiser et al., 2011) and B (Utrobin & Chugai, 2011). The “optimal” non-evolutionary progenitor model for SN 2000cb calculated by Utrobin & Chugai (2011) has and . Although our merger progenitor models can match these constraints on radius and ejecta mass, they are structurally not suitable to reproduce the unusual light curve shape of this supernova. We also could not study SN 2006au due to data missing from the first days of the supernova and neither SN 2009E because its nickel decay tail in the light curve was not recorded.
Studying the mixing of nickel and hydrogen is promising with these new pre-supernova models. As BSG progenitors may not only form from the late Case C merger scenario developed in this work, it would also be interesting to study the core-envelope structure of a BSG produced from a Case B merger/accretion scenarios and the results of their explosion. Currently, 3D explosion simulations of our models are underway along with a separate study of the nuclear yields from their explosions.
Acknowledgements
We thank Alexandra Kozyrova and Luc Dessart for useful initial discussions on this project. We also thank Andrea Pastorello for the data on SN 1998A and Francesco Taddia for the data on SN 2006V. We also thank Natasha Ivanova and Philipp Podsiadlowski for initial discussions about the progenitor model and the anonymous referee for his encouraging comments and suggestions. AH was supported by an ARC Future Fellowship (FT120100363).
References
- Arnett et al. (1989) Arnett W. D., Bahcall J. N., Kirshner R. P., Woosley S. E., 1989, ARA&A, 27, 629
- Barkat & Wheeler (1989a) Barkat Z., Wheeler J. C., 1989a, ApJ, 341, 925
- Barkat & Wheeler (1989b) Barkat Z., Wheeler J. C., 1989b, ApJ, 342, 940
- Bell & Berrington (1987) Bell K. L., Berrington K. A., 1987, Journal of Physics B Atomic Molecular Physics, 20, 801
- Blinnikov et al. (2000) Blinnikov S., Lundqvist P., Bartunov O., Nomoto K., Iwamoto K., 2000, ApJ, 532, 1132
- Burrows et al. (1995) Burrows C. J., et al., 1995, ApJ, 452, 680
- Caramana et al. (1998) Caramana E. J., Shashkov M. J., Whalen P. P., 1998, Journal of Computational Physics, 144, 70
- Castor et al. (1975) Castor J. I., Abbott D. C., Klein R. I., 1975, ApJ, 195, 157
- Catchpole et al. (1987) Catchpole R. M., et al., 1987, MNRAS, 229, 15P
- Catchpole et al. (1988) Catchpole R. M., et al., 1988, MNRAS, 231, 75P
- Chen et al. (2006) Chen Y.-T., Yang M., Lin C.-S., 2006, Central Bureau Electronic Telegrams, 390
- Chugai (1991) Chugai N. N., 1991, Soviet Ast., 35, 171
- Chugai (1994) Chugai N. N., 1994, ApJ, 428, L17
- Chugai et al. (1997) Chugai N. N., Chevalier R. A., Kirshner R. P., Challis P. M., 1997, ApJ, 483, 925
- Colgan et al. (1994) Colgan S. W. J., Haas M. R., Erickson E. F., Lord S. D., Hollenbach D. J., 1994, ApJ, 427, 874
- Constantino et al. (2014) Constantino T., Campbell S., Gil-Pons P., Lattanzio J., 2014, ApJ, 784, 56
- Dessart & Hillier (2010) Dessart L., Hillier D. J., 2010, MNRAS, 405, 2141
- Dessart et al. (2010) Dessart L., Livne E., Waldman R., 2010, MNRAS, 408, 827
- Dessart et al. (2013) Dessart L., Hillier D. J., Waldman R., Livne E., 2013, MNRAS, 433, 1745
- Falk & Arnett (1977) Falk S. W., Arnett W. D., 1977, ApJS, 33, 515
- France et al. (2011) France K., et al., 2011, ApJ, 743, 186
- Gavrila (1967) Gavrila M., 1967, Physical Review, 163, 147
- Gear (1971) Gear C. W., 1971, Numerical initial value problems in ordinary differential equations
- Grassberg et al. (1971) Grassberg E. K., Imshennik V. S., Nadyozhin D. K., 1971, Ap&SS, 10, 28
- Hairer & Wanner (1996) Hairer E., Wanner G., 1996, Solving Ordinary Differential Equations II, Stiff and Differential-Algebraic Problems, second revised edn. Springer-Verlag Berlin Heidelberg
- Hairer et al. (1993) Hairer E., Norsett S. P., Wanner G., 1993, Solving Ordinary Differential Equations I, Nonstiff Problems, second revised edn. Springer-Verlag Berlin Heidelberg
- Hamuy (2003) Hamuy M., 2003, ApJ, 582, 905
- Hamuy et al. (1988) Hamuy M., Suntzeff N. B., Gonzalez R., Martin G., 1988, AJ, 95, 63
- Hanuschik et al. (1988) Hanuschik R. W., Thimm G., Dachs J., 1988, MNRAS, 234, 41P
- Heger & Langer (1998) Heger A., Langer N., 1998, A&A, 334, 210
- Heger & Langer (2000) Heger A., Langer N., 2000, ApJ, 544, 1016
- Heger & Woosley (2010) Heger A., Woosley S. E., 2010, ApJ, 724, 341
- Heger et al. (2000) Heger A., Langer N., Woosley S. E., 2000, ApJ, 528, 368
- Heger et al. (2005) Heger A., Woosley S. E., Spruit H. C., 2005, ApJ, 626, 350
- Irwin (1981) Irwin A. W., 1981, ApJS, 45, 621
- Ivanova & Nandez (2016) Ivanova N., Nandez J. L. A., 2016, MNRAS, 462, 362
- Ivanova & Podsiadlowski (2002a) Ivanova N., Podsiadlowski P., 2002a, in Tout C. A., van Hamme W., eds, Astronomical Society of the Pacific Conference Series Vol. 279, Exotic Stars as Challenges to Evolution. p. 245
- Ivanova & Podsiadlowski (2002b) Ivanova N., Podsiadlowski P., 2002b, Ap&SS, 281, 191
- Ivanova & Podsiadlowski (2003) Ivanova N., Podsiadlowski P., 2003, in Hillebrandt W., Leibundgut B., eds, From Twilight to Highlight: The Physics of Supernovae. p. 19 (arXiv:astro-ph/0210368), doi:10.1007/10828549_3
- Ivanova et al. (2002) Ivanova N., Podsiadlowski P., Spruit H., 2002, MNRAS, 334, 819
- Janev et al. (1987) Janev R. K., Langer W. D., Evans K., 1987, Elementary processes in Hydrogen-Helium plasmas - Cross sections and reaction rate coefficients
- Kasen & Woosley (2009) Kasen D., Woosley S. E., 2009, ApJ, 703, 2205
- Kifonidis et al. (2003) Kifonidis K., Plewa T., Janka H.-T., Müller E., 2003, A&A, 408, 621
- Kifonidis et al. (2006) Kifonidis K., Plewa T., Scheck L., Janka H.-T., Müller E., 2006, A&A, 453, 661
- Kleiser et al. (2011) Kleiser I. K. W., et al., 2011, MNRAS, 415, 372
- Kozma & Fransson (1992) Kozma C., Fransson C., 1992, ApJ, 390, 602
- Kozma & Fransson (1998) Kozma C., Fransson C., 1998, ApJ, 497, 431
- Kurucz (2002) Kurucz R. L., 2002, in Schultz D. R., Krstic P. S., Ownby F., eds, American Institute of Physics Conference Series Vol. 636, Atomic and Molecular Data and Their Applications. pp 134–143, doi:10.1063/1.1516330
- Larsson et al. (2016) Larsson J., et al., 2016, ApJ, 833, 147
- Lundqvist & Fransson (1996) Lundqvist P., Fransson C., 1996, ApJ, 464, 924
- Lusk & Baron (2017) Lusk J. A., Baron E., 2017, PASP, 129, 044202
- Maguire et al. (2012) Maguire K., et al., 2012, MNRAS, 420, 3451
- Menon & Heger (2017) Menon A., Heger A., 2017, Monthly Notices of the Royal Astronomical Society, 469, 4649
- Mihalas & Mihalas (1984) Mihalas D., Mihalas B. W., 1984, Foundations of radiation hydrodynamics
- Morozova et al. (2015) Morozova V., Piro A. L., Renzo M., Ott C. D., Clausen D., Couch S. M., Ellis J., Roberts L. F., 2015, ApJ, 814, 63
- Morris & Podsiadlowski (2009) Morris T., Podsiadlowski P., 2009, MNRAS, 399, 515
- Nomoto et al. (1988) Nomoto K., Shigeyama T., Kumaga S., Hashimoto M.-A., 1988, Proceedings of the Astronomical Society of Australia, 7, 490
- Ott et al. (2008) Ott C. D., Burrows A., Dessart L., Livne E., 2008, ApJ, 685, 1069
- Ott et al. (2013) Ott C. D., et al., 2013, ApJ, 768, 115
- Pastorello et al. (2005) Pastorello A., et al., 2005, MNRAS, 360, 950
- Pastorello et al. (2012) Pastorello A., et al., 2012, A&A, 537, A141
- Phillips & Heathcote (1989) Phillips M. M., Heathcote S. R., 1989, PASP, 101, 137
- Phillips et al. (1988) Phillips M. M., Heathcote S. R., Hamuy M., Navarrete M., 1988, AJ, 95, 1087
- Pinto & Woosley (1988) Pinto P. A., Woosley S. E., 1988, ApJ, 329, 820
- Podsiadlowski (1992) Podsiadlowski P., 1992, PASP, 104, 717
- Podsiadlowski & Joss (1989) Podsiadlowski P., Joss P. C., 1989, Nature, 338, 401
- Podsiadlowski et al. (1990) Podsiadlowski P., Joss P. C., Rappaport S., 1990, A&A, 227, L9
- Podsiadlowski et al. (1992) Podsiadlowski P., Joss P. C., Hsu J. J. L., 1992, ApJ, 391, 246
- Podsiadlowski et al. (2006) Podsiadlowski P., Morris T. S., Ivanova N., 2006, in Kraus M., Miroshnichenko A. S., eds, Astronomical Society of the Pacific Conference Series Vol. 355, Stars with the B[e] Phenomenon. p. 259
- Podsiadlowski et al. (2007) Podsiadlowski P., Morris T. S., Ivanova N., 2007, in Immler S., Weiler K., McCray R., eds, American Institute of Physics Conference Series Vol. 937, Supernova 1987A: 20 Years After: Supernovae and Gamma-Ray Bursters. pp 125–133, doi:10.1063/1.3682893
- Rauscher & Thielemann (2000) Rauscher T., Thielemann F.-K., 2000, Atomic Data and Nuclear Data Tables, 75, 1
- Saio et al. (1988) Saio H., Nomoto K., Kato M., 1988, ApJ, 331, 388
- Shigeyama & Nomoto (1990) Shigeyama T., Nomoto K., 1990, ApJ, 360, 242
- Smartt (2009) Smartt S. J., 2009, ARA&A, 47, 63
- Spruit (2002) Spruit H. C., 2002, A&A, 381, 923
- Sugerman et al. (2005) Sugerman B. E. K., Crotts A. P. S., Kunkel W. E., Heathcote S. R., Lawrence S. S., 2005, ApJS, 159, 60
- Sukhbold et al. (2016) Sukhbold T., Ertl T., Woosley S. E., Brown J. M., Janka H.-T., 2016, ApJ, 821, 38
- Sutherland (1998) Sutherland R. S., 1998, MNRAS, 300, 321
- Sutherland & Dopita (1993) Sutherland R. S., Dopita M. A., 1993, ApJS, 88, 253
- Taddia et al. (2012) Taddia F., et al., 2012, A&A, 537, A140
- Taddia et al. (2013) Taddia F., et al., 2013, A&A, 558, A143
- Teachout & Pack (1971) Teachout R. R., Pack R. T., 1971, Atomic Data, 3, 195
- Thimm et al. (1989) Thimm G. J., Hanuschik R. W., Schmidt-Kaler T., 1989, MNRAS, 238, 15P
- Utrobin (1993) Utrobin V., 1993, A&A, 270, 249
- Utrobin (2004) Utrobin V. P., 2004, Astronomy Letters, 30, 293
- Utrobin (2005) Utrobin V. P., 2005, Astronomy Letters, 31, 806
- Utrobin (2007) Utrobin V. P., 2007, A&A, 461, 233
- Utrobin & Chugai (2011) Utrobin V. P., Chugai N. N., 2011, A&A, 532, A100
- Utrobin & Chugai (2017) Utrobin V. P., Chugai N. N., 2017, MNRAS, 472, 5004
- Utrobin et al. (1995) Utrobin V. P., Chugai N. N., Andronova A. A., 1995, A&A, 295, 129
- Utrobin et al. (2015) Utrobin V. P., Wongwathanarat A., Janka H.-T., Müller E., 2015, A&A, 581, A40
- Verner & Yakovlev (1995) Verner D. A., Yakovlev D. G., 1995, A&AS, 109, 125
- Verner et al. (1996) Verner D. A., Ferland G. J., Korista K. T., Yakovlev D. G., 1996, ApJ, 465, 487
- Voronov (1997) Voronov G. S., 1997, Atomic Data and Nuclear Data Tables, 65, 1
- Walborn et al. (1987) Walborn N. R., Lasker B. M., Laidler V. G., Chu Y.-H., 1987, ApJ, 321, L41
- Weiss et al. (1988) Weiss A., Hillebrandt W., Truran J. W., 1988, A&A, 197, L11
- Weymann (1966) Weymann R., 1966, ApJ, 145, 560
- Williams et al. (1998) Williams A., Woodings S., Martin R., Verveer A., Biggs J., 1998, IAU Circ., 6805
- Wishart (1979) Wishart A. W., 1979, MNRAS, 187, 59P
- Wongwathanarat et al. (2015) Wongwathanarat A., Müller E., Janka H.-T., 2015, A&A, 577, A48
- Wood (1988) Wood P. R., 1988, Proceedings of the Astronomical Society of Australia, 7, 386
- Woodings et al. (1998) Woodings S. J., Williams A. J., Martin R., Burman R. R., Blair D. G., 1998, MNRAS, 301, L5
- Woosley (1988) Woosley S. E., 1988, ApJ, 330, 218
- Woosley (2012) Woosley S., 2012, Supernovae: The Tenth Santa Cruz Workshop in Astronomy and Astrophysics, July 9 to 21, 1989, Lick Observatory. Santa Cruz Summer Workshops in Astronomy and Astrophysics, Springer New York, https://books.google.co.in/books?id=TRnSBwAAQBAJ
- Woosley & Heger (2007) Woosley S. E., Heger A., 2007, Phys. Rep., 442, 269
- Woosley et al. (1988) Woosley S. E., Pinto P. A., Weaver T. A., 1988, Proceedings of the Astronomical Society of Australia, 7, 355
- Woosley et al. (1997) Woosley S. E., Heger A., Weaver T. A., Langer N., 1997, ArXiv Astrophysics e-prints,
- Woosley et al. (2002) Woosley S. E., Heger A., Weaver T. A., 2002, Reviews of Modern Physics, 74, 1015
- de Jager et al. (1988) de Jager C., Nieuwenhuijzen H., van der Hucht K. A., 1988, A&AS, 72, 259